Greetings everyone, as you know I have been working on Grafana Dashboards across all Veeam RESTful APIs (the only one pending is VBA GCP), but as the time has passed, the releases and core products I was using have evolved as well…
I am talking about the time-series I am using to store all the recollected data from the APIs. I was using InfluxDB v1.x (latest stable release is v1.8), but InfluxData is about to deprecate it and consider it end-of-life at the end of 2021. That left all the Community using it with the only option to go to InfluxDB v2.x, and start leveraging Flux, the new query language, which is extremely versatile btw.
Introducing the new Grafana Dashboard for Veeam Enterprise Manager for InfluxDB v2 using Flux, and Grafana 8.x
Before go any further, I just wanted to thank tigattack who contributed to the Script that pushes the data to InfluxDB v2.0.
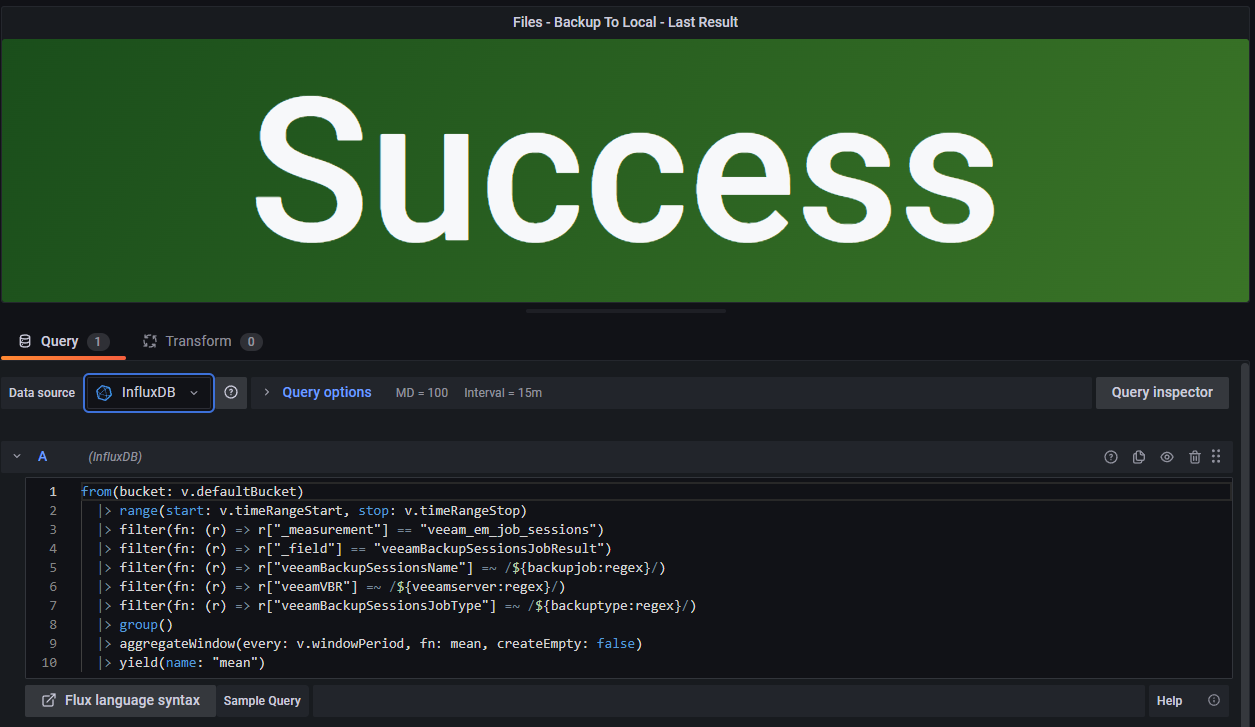
Now, there it has been ton of work, as I needed to craft all the queries again from scratch converting legacy InfluxQL things like this:

Into something modern like this using Flux (which I am new into)

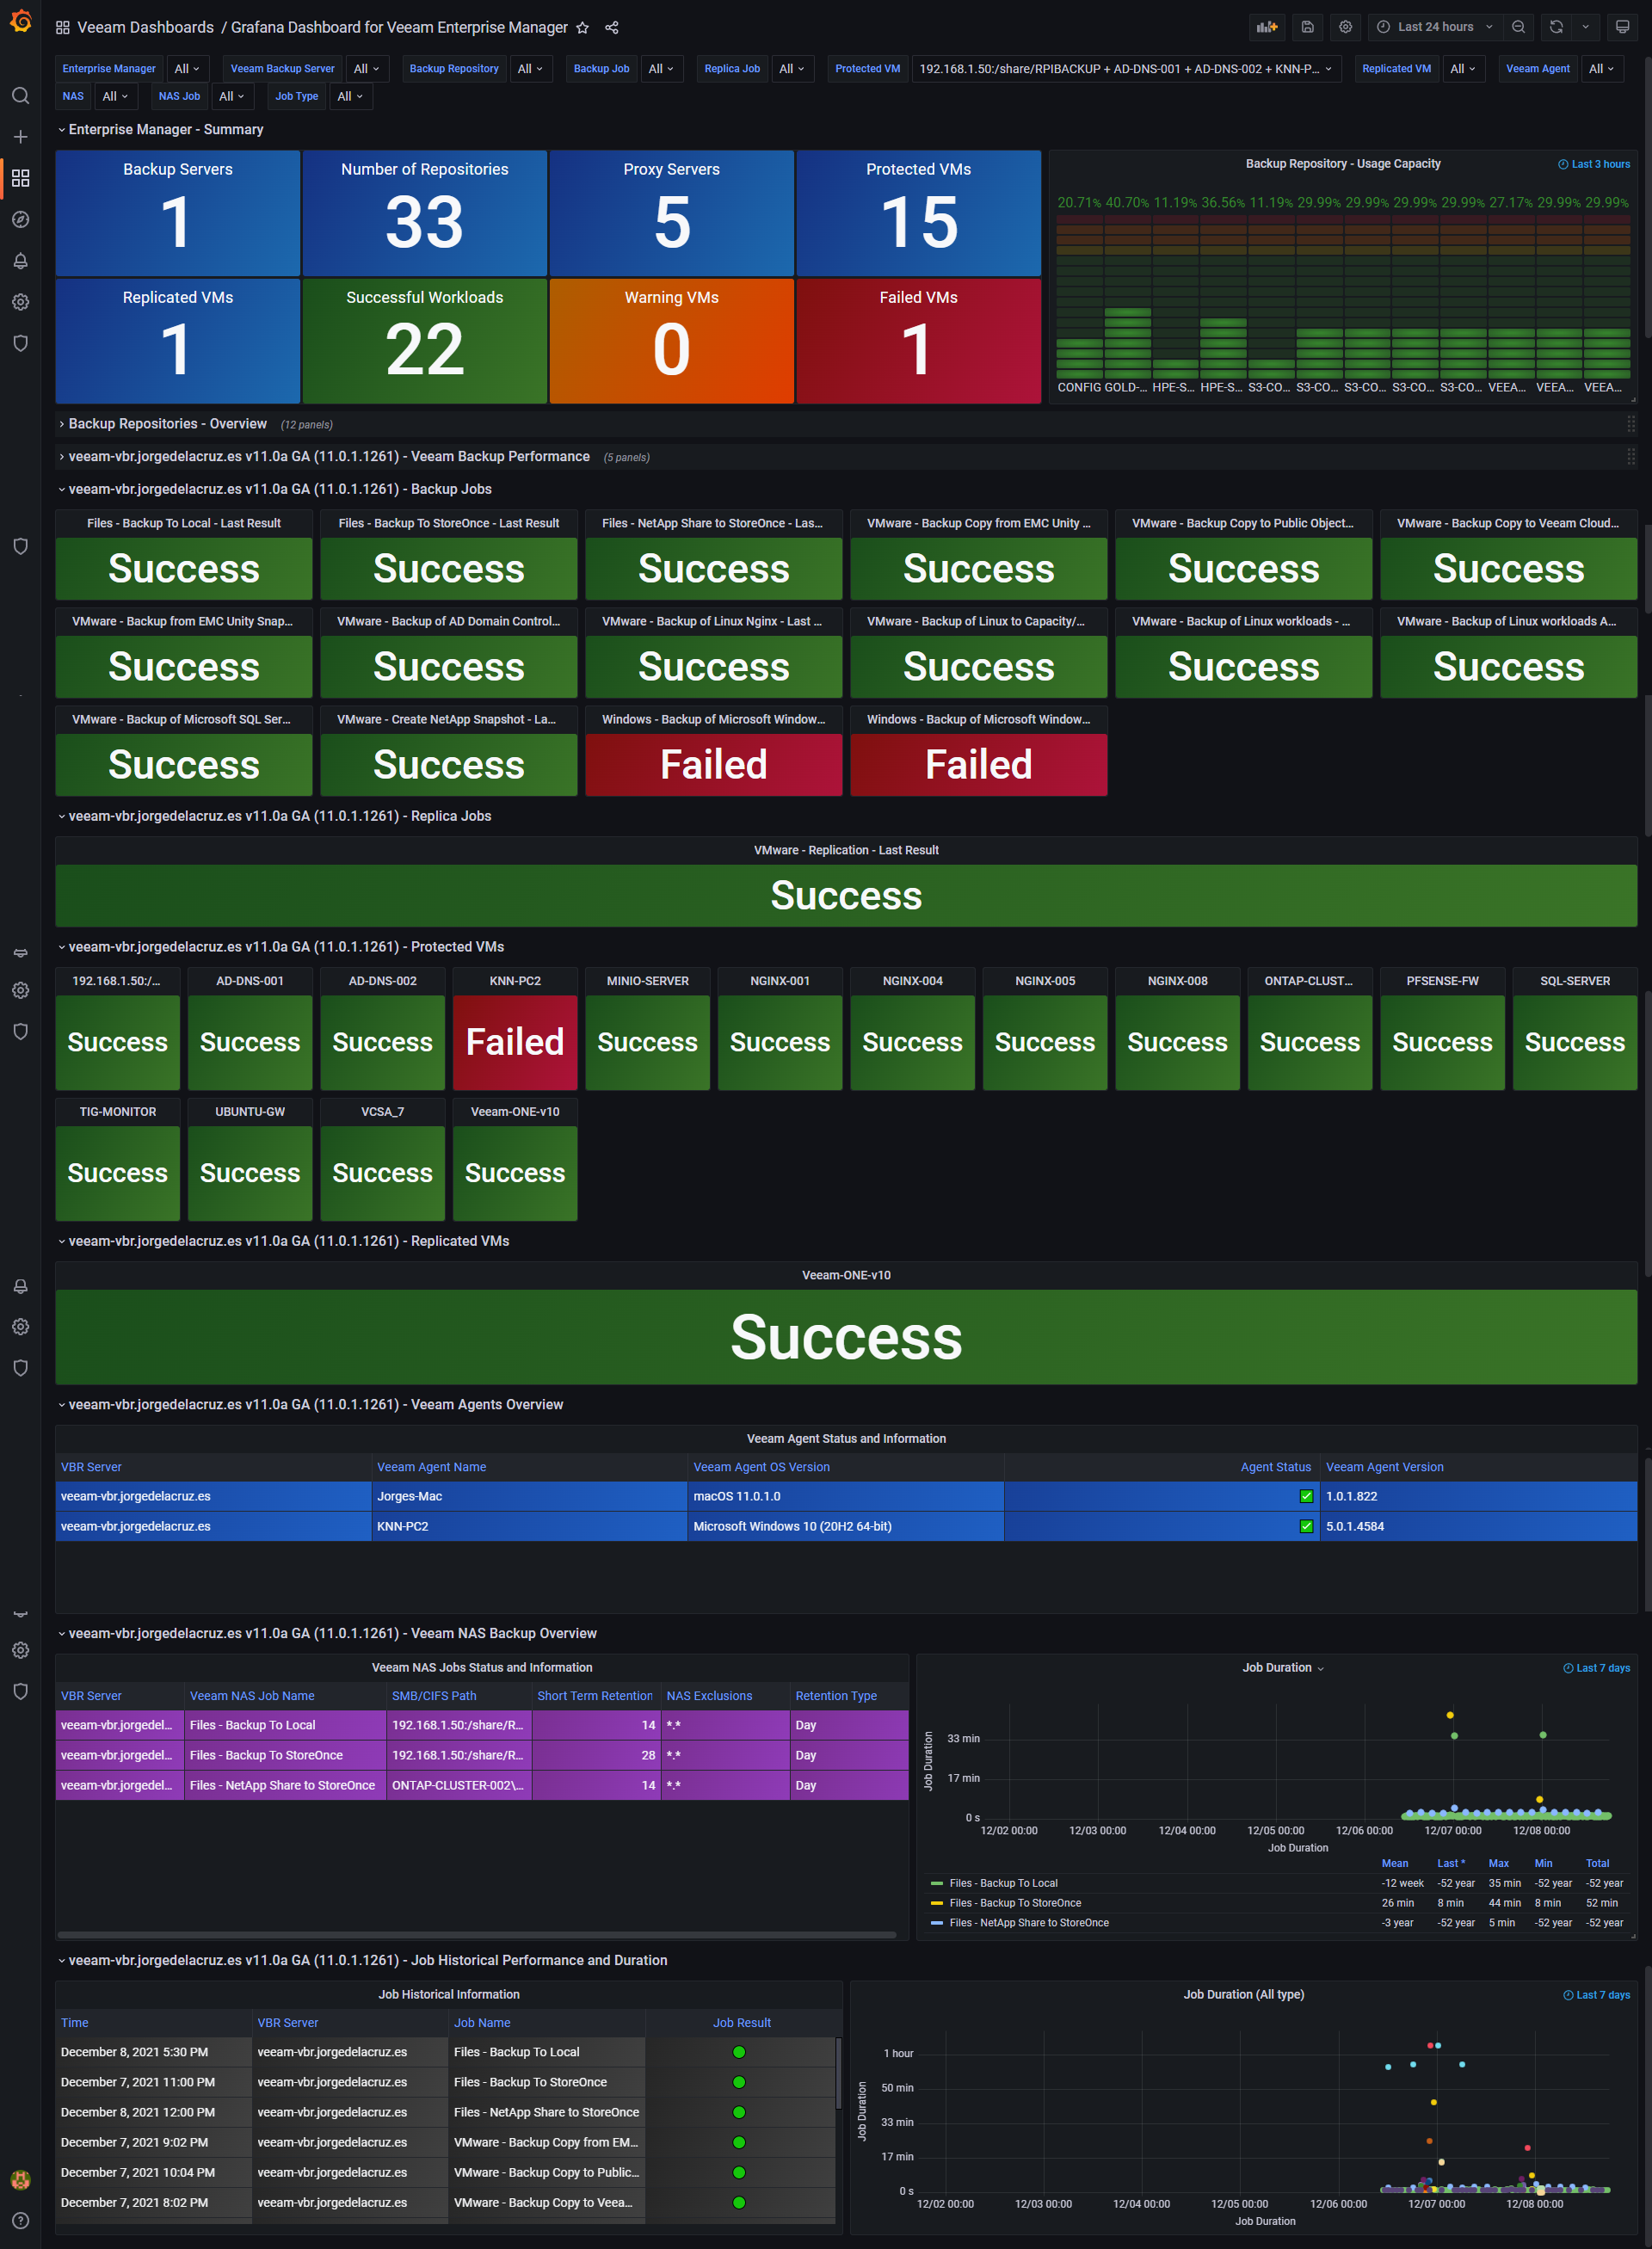
The final result is something extremely beautiful, yet useful, like this. Yes at the top you can filter by so many things, VMs, VBR Servers, Repos, Backup Jobs, Replica, etc.:

Alright, alright, I know YOU WANT IT, so keep reading about the setup.
Step 1 - Have InfluxDB v2, and Grafana v8.x installed
I can not cover this here, but there are tons of guides about how to install both systems, they are just a few commands, or just deploy everything in Docker, ping me privately if need help.
Step 2 - Download, and prepare the veeam_enterprisemanager.sh
This is not that difficult, on a Linux system, it can be a Linux container inside WSL2, or just a VM, or a docker container, anything with access to your InfluxDB v2, and your Enterprise Manager:
You will need to edit the basics, these are your details:
##
# Configurations
##
# Endpoint URL for InfluxDB
veeamInfluxDBURL="http://YOURINFLUXSERVERIP" #Your InfluxDB Server, http://FQDN or https://FQDN if using SSL
veeamInfluxDBPort="8086" #Default Port
veeamInfluxDBBucket="veeam" # InfluxDB bucket name (not ID)
veeamInfluxDBToken="TOKEN" # InfluxDB access token with read/write privileges for the bucket
veeamInfluxDBOrg="ORG NAME" # InfluxDB organisation name (not ID)

# Endpoint URL for login action
veeamUsername="YOUREMUSER" #Your username, if using domain based account, please add it like user@domain.com (if you use domain\account it is not going to work!)
veeamPassword='YOUREMPASSWORD'
veeamJobSessions="100"
veeamAuth=$(echo -ne "$veeamUsername:$veeamPassword" | base64);
veeamRestServer="YOUREMSERVERIP"
veeamRestPort="9398" #Default Port
Make the script executable, and run it :) If all works, then schedule it.
Step 3 - Import the Veeam Dashboard on your Grafana
The final step, the easiest one, on your Grafana click Import and either use the ID 11516, or the URL - https://grafana.com/grafana/dashboards/11516
And that’s it, now you have a fresh Grafana with all your information that the Enterprise Manager has. If you keep running this for days, weeks, months, is when you will be able to see in great detail long-term trends, etc.
Final thoughts
This has been such a great experience for me, take something that works and it is been used by 500+ (number of downloads) Veeam enthusiasts out there, and make it slick and future-proof for cutting-edge like Flux and InfluxDB v2. Hope you like it, at the end, I made this for you all. thank you!


