

Introduction
Starting with Veeam Backup & Replication version 12.1, VBR events can be sent to external syslog servers. A list of events can be found here.
There are currently integrations for Splunk and Sophos MDR/XDR, which, among other things, provide better visibility to detect and stop threats targeting backup data. Further information can be found at the following URLs:
Note: The possibilities with Veeam Backup & Replication are described in this blog post. The options with Veeam ONE are being investigated and will be created and documented later if necessary.
Elastic Stack
The Elastic Stack, often referred to as ELK Stack, is a powerful set of open-source tools used for a variety of data analytics purposes, particularly for searching, analyzing, and visualizing large volumes of data in real-time. The stack began as a collection of three "open source" products:
- Elasticsearch is a distributed, RESTful search and analytics engine. It enables large amounts of data to be stored, searched, and analyzed quickly.
- Logstash is a server-side data processing pipeline that ingests data from multiple sources simultaneously, transforms it, and then sends it to a "stash" like Elasticsearch.
- Kibana provides visualization capabilities for the indexed content. Users can create bar, line, and scatter plots, and more.
The Elastic Stack is widely used for log analysis, real-time application monitoring, and clickstream analysis, among other use cases. It is known for its scalability, ease of use, and flexibility, making it popular among both small startups and large enterprises.
So why the quotation marks for "open source" above? In 2021, Elastic announced that the ELK Stack is no longer open source. But do not worry, you can still download the Elastic software and access both the OSS features and the free basic features of the solution at no cost to you.
Elastic Security
Elastic Security is a component of the Elastic Stack designed for threat detection, analysis, and response. It integrates with Elasticsearch, Kibana, and Logstash to provide security analytics and visibility into your environment. Further details can be found in the official documentation.
ELK Stack Deployment
For those who are already using the solution, the first steps to install and configure a development/test environment will not be interesting and may therefore go directly to the configuration steps. This documentation contains instructions for deploying Elastic on-premises.
Setup
For a quick deployment of an ELK stack, you can use the Elastic Container Project, which runs on Docker. The setup instructions can be found here.
After deploying the containers, you only need to provide an additional container with the Logstash service (see Logstash Configuration).
Also worth mentioning is the blog post, which provides further details on the setup and operation of the environment.
Elasticsearch & Kibana Configuration
Before data can be sent to Elasticsearch using Logstash, we need to prepare the environment for analyzing the VBR syslog data.
Data View and Dashboards
In Kibana, a Data View refers to a visual representation of data that has been indexed in Elasticsearch. It typically involves defining an index pattern and specifying a time field for your data. Here is what you need to know about data views in Kibana:
- An Index Pattern allows Kibana to retrieve and visualize data from the specified indices.
- When creating an Index Pattern, you also specify a time field. This field identifies the timestamp in your documents that Kibana uses for time-based filtering and visualization.
- Using the index pattern and time field, Kibana enables you to create several types of Visualizations, including charts, graphs, tables, and maps. These visualizations help you understand trends, patterns, and anomalies in your data.
- In Kibana, Saved Objects like Saved Searches, Visualizations, and Dashboards are representations of data views:
-
- Saved Searches: Queries that you save for reuse.
- Visualizations: Charts, graphs, and other visual displays based on aggregations and queries.
- Dashboards: Collections of visualizations and saved searches arranged to provide an overview of your data.
Import Data View and Dashboards
The following steps describe how to download and import the Data View and two Dashboards for Veeam Backup and Replication.
Download
Download the Data View and two Dashboards from this GitHub Repository.
Access the Elastic Web Console
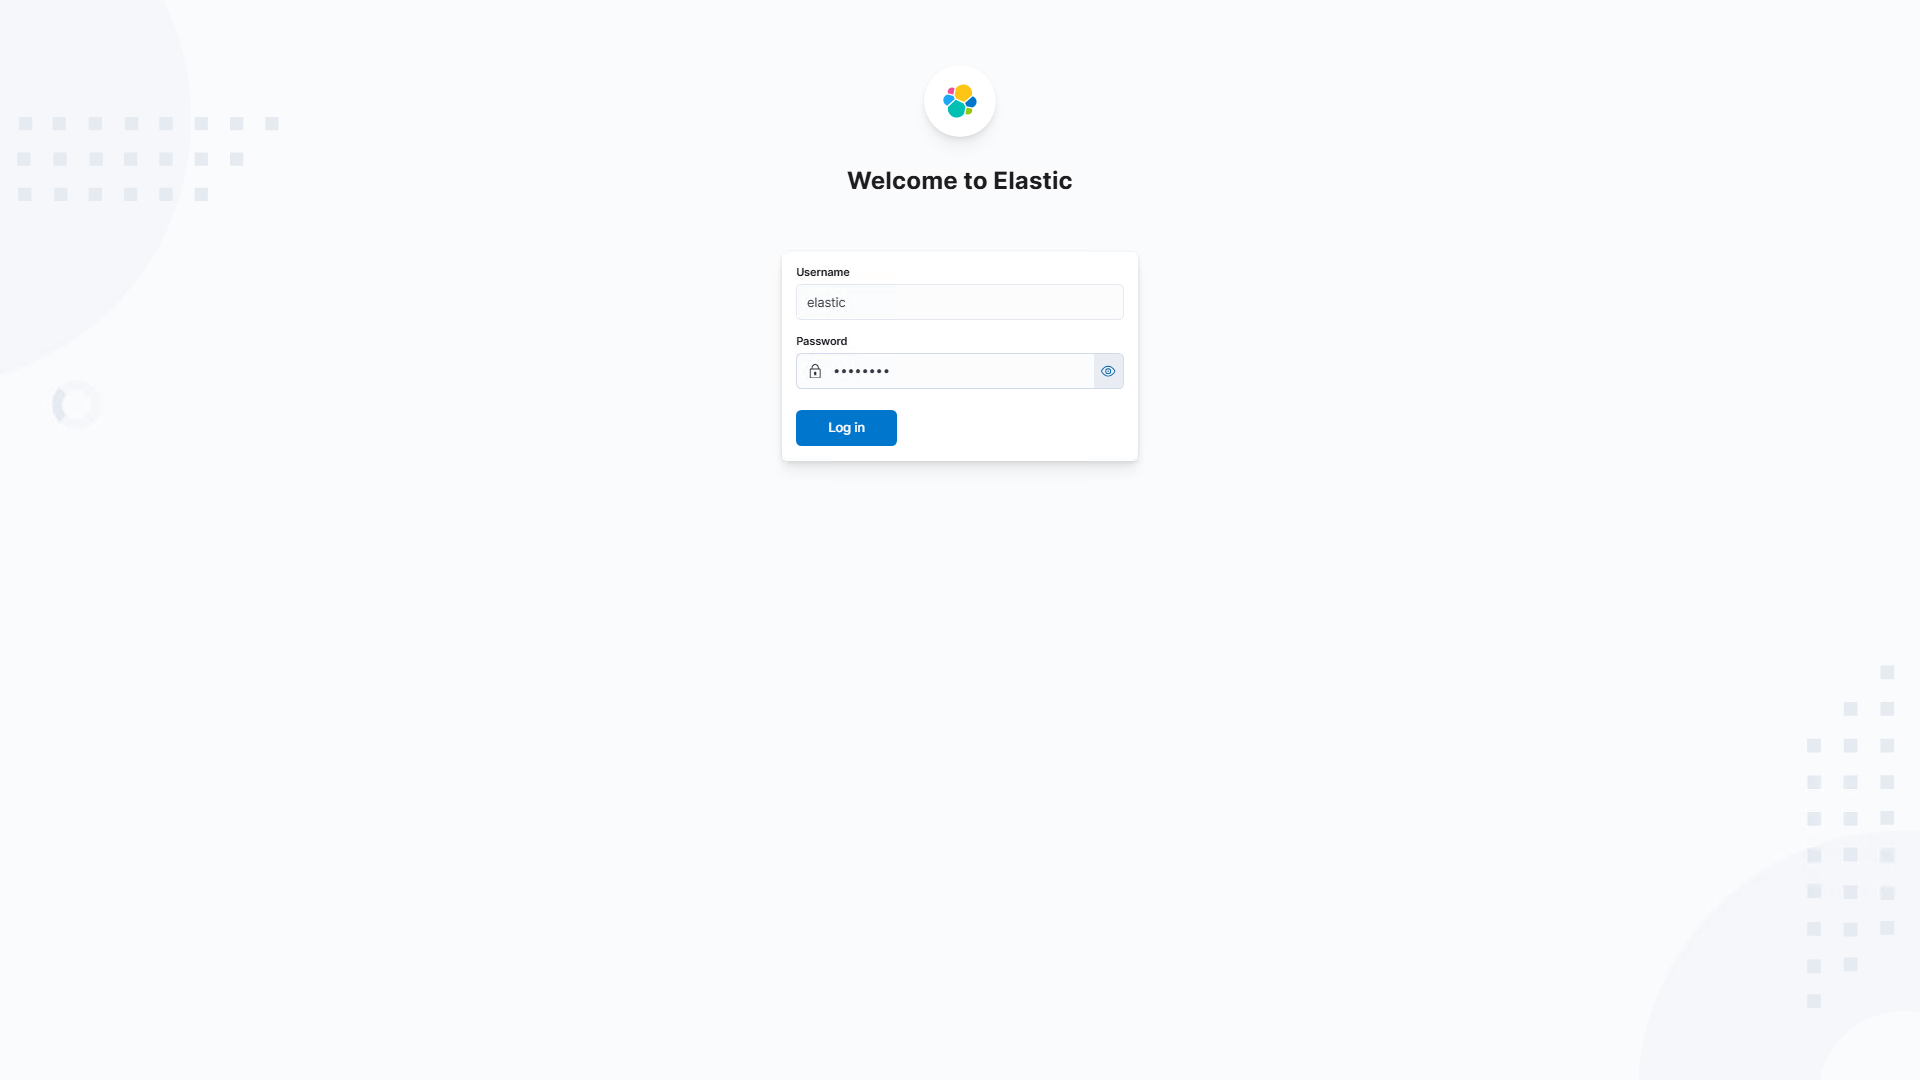
After the deployment of the ELK stack, log in to the Elastic website.
- Access the web console by navigating to https://<your server>:5601. The username is elastic, and the password is the one defined in the .env file for the ELK stack deployment.
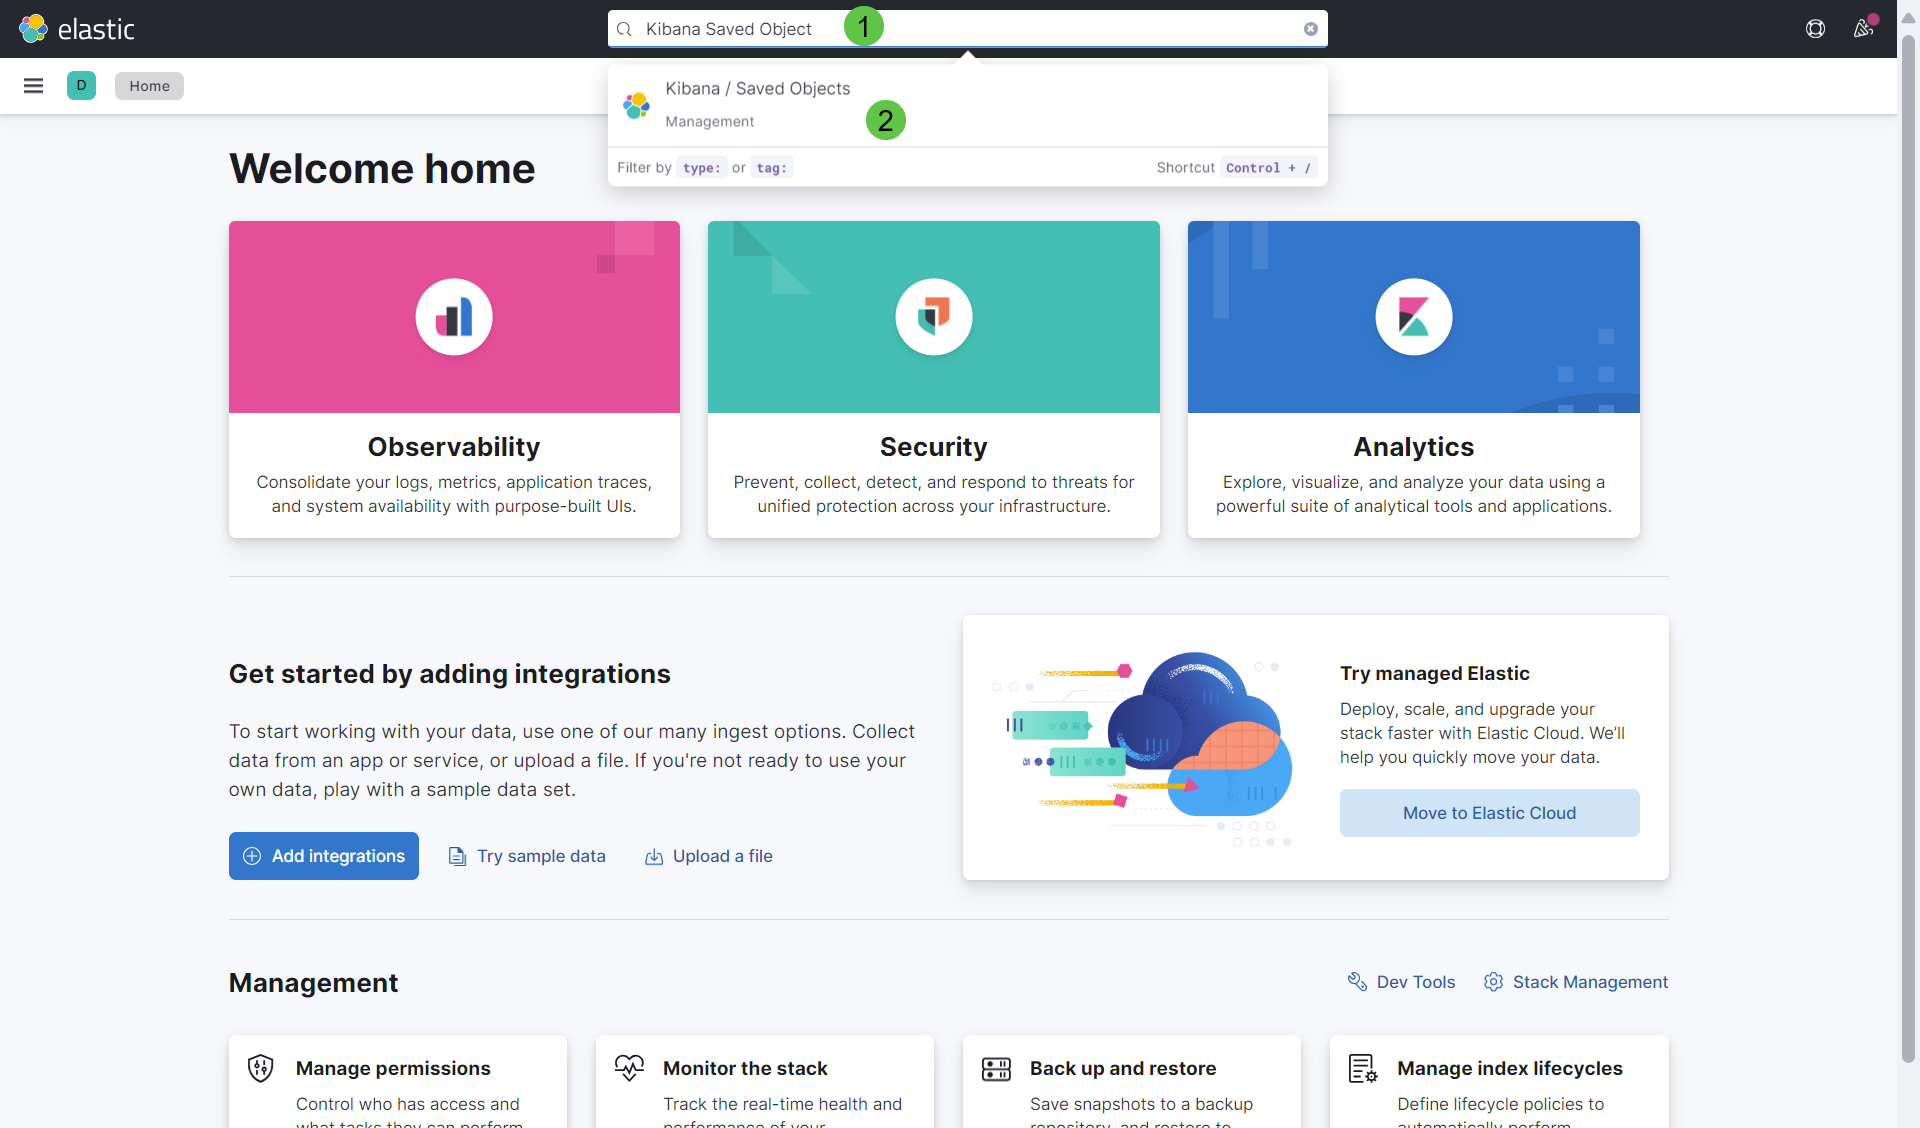
- Enter Kibana Saved Objects in the search field and click on Kibana / Saved Objects to open the Saved Objects administration pane.
- In the Saved Objects pane click on Import.
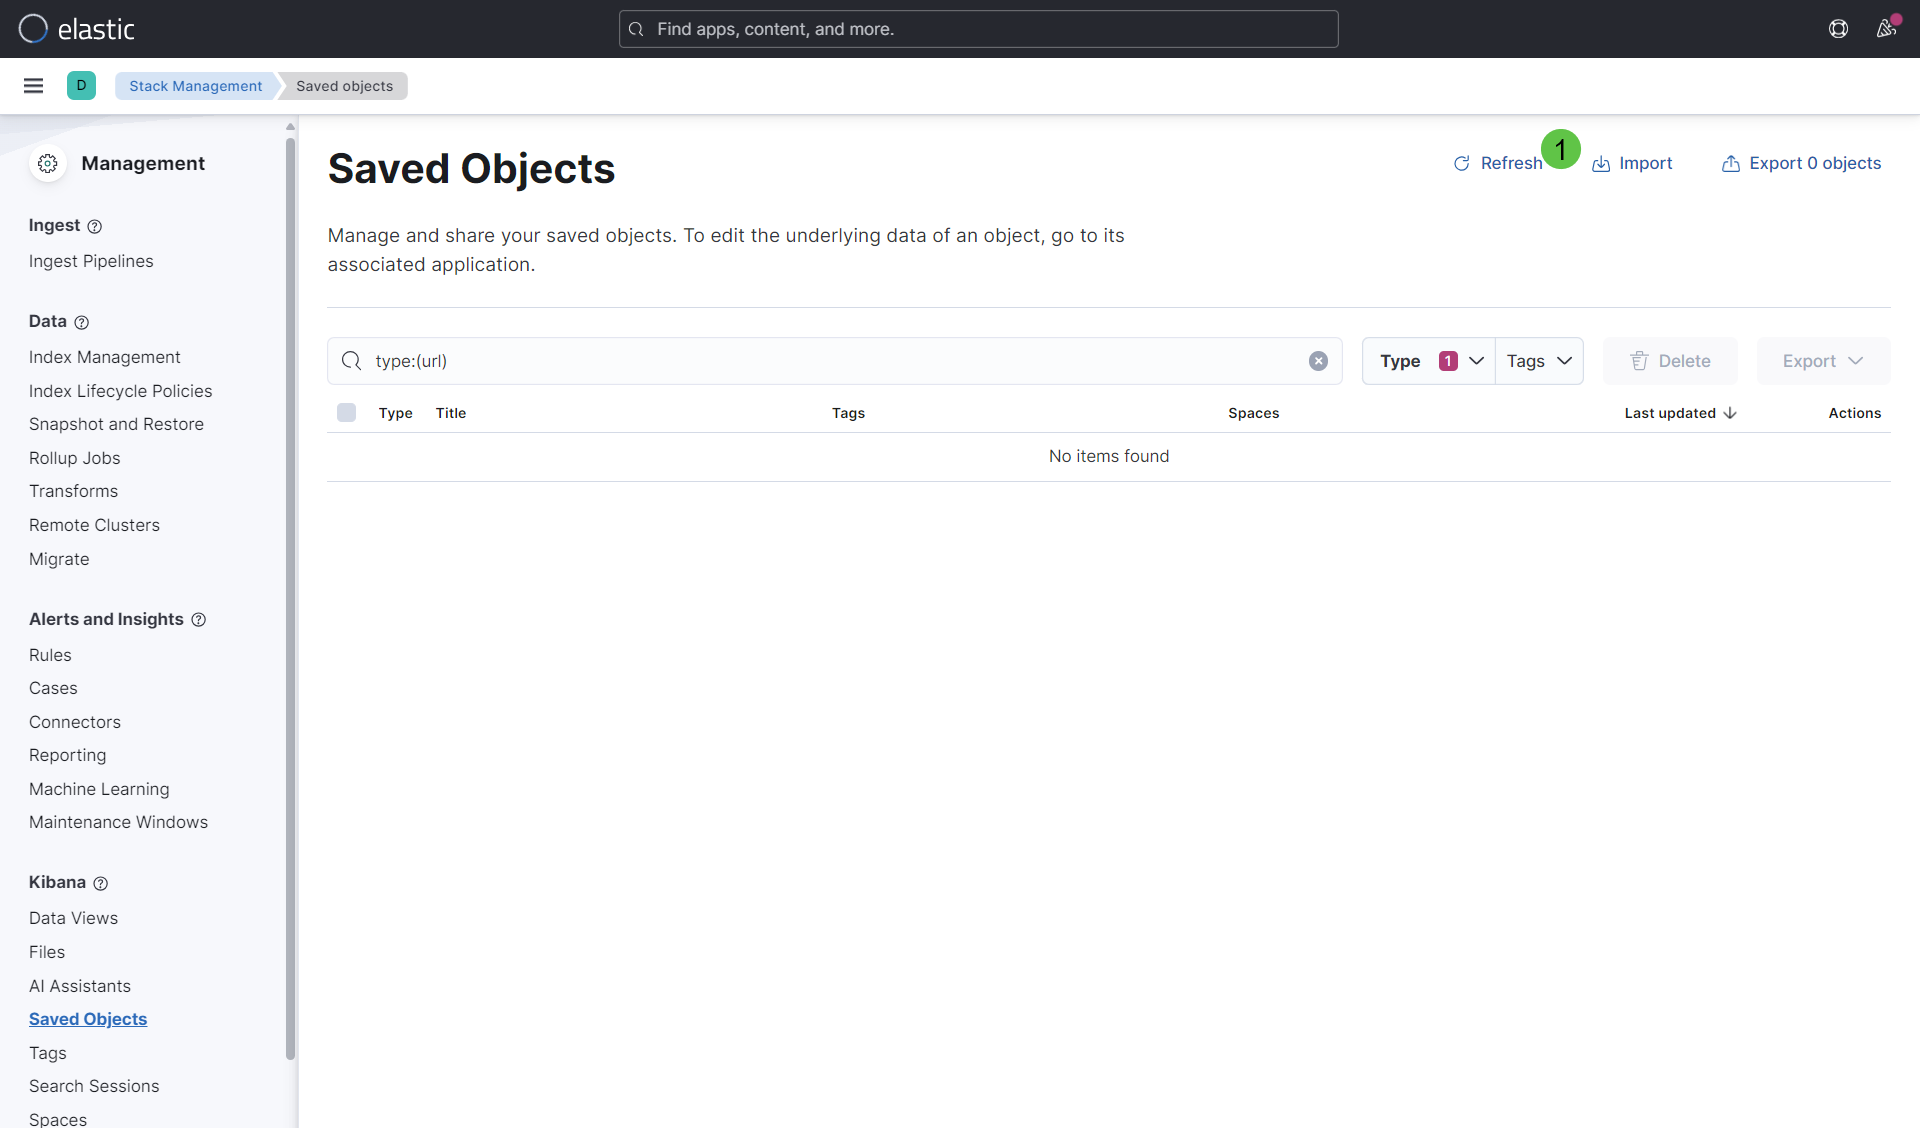
-
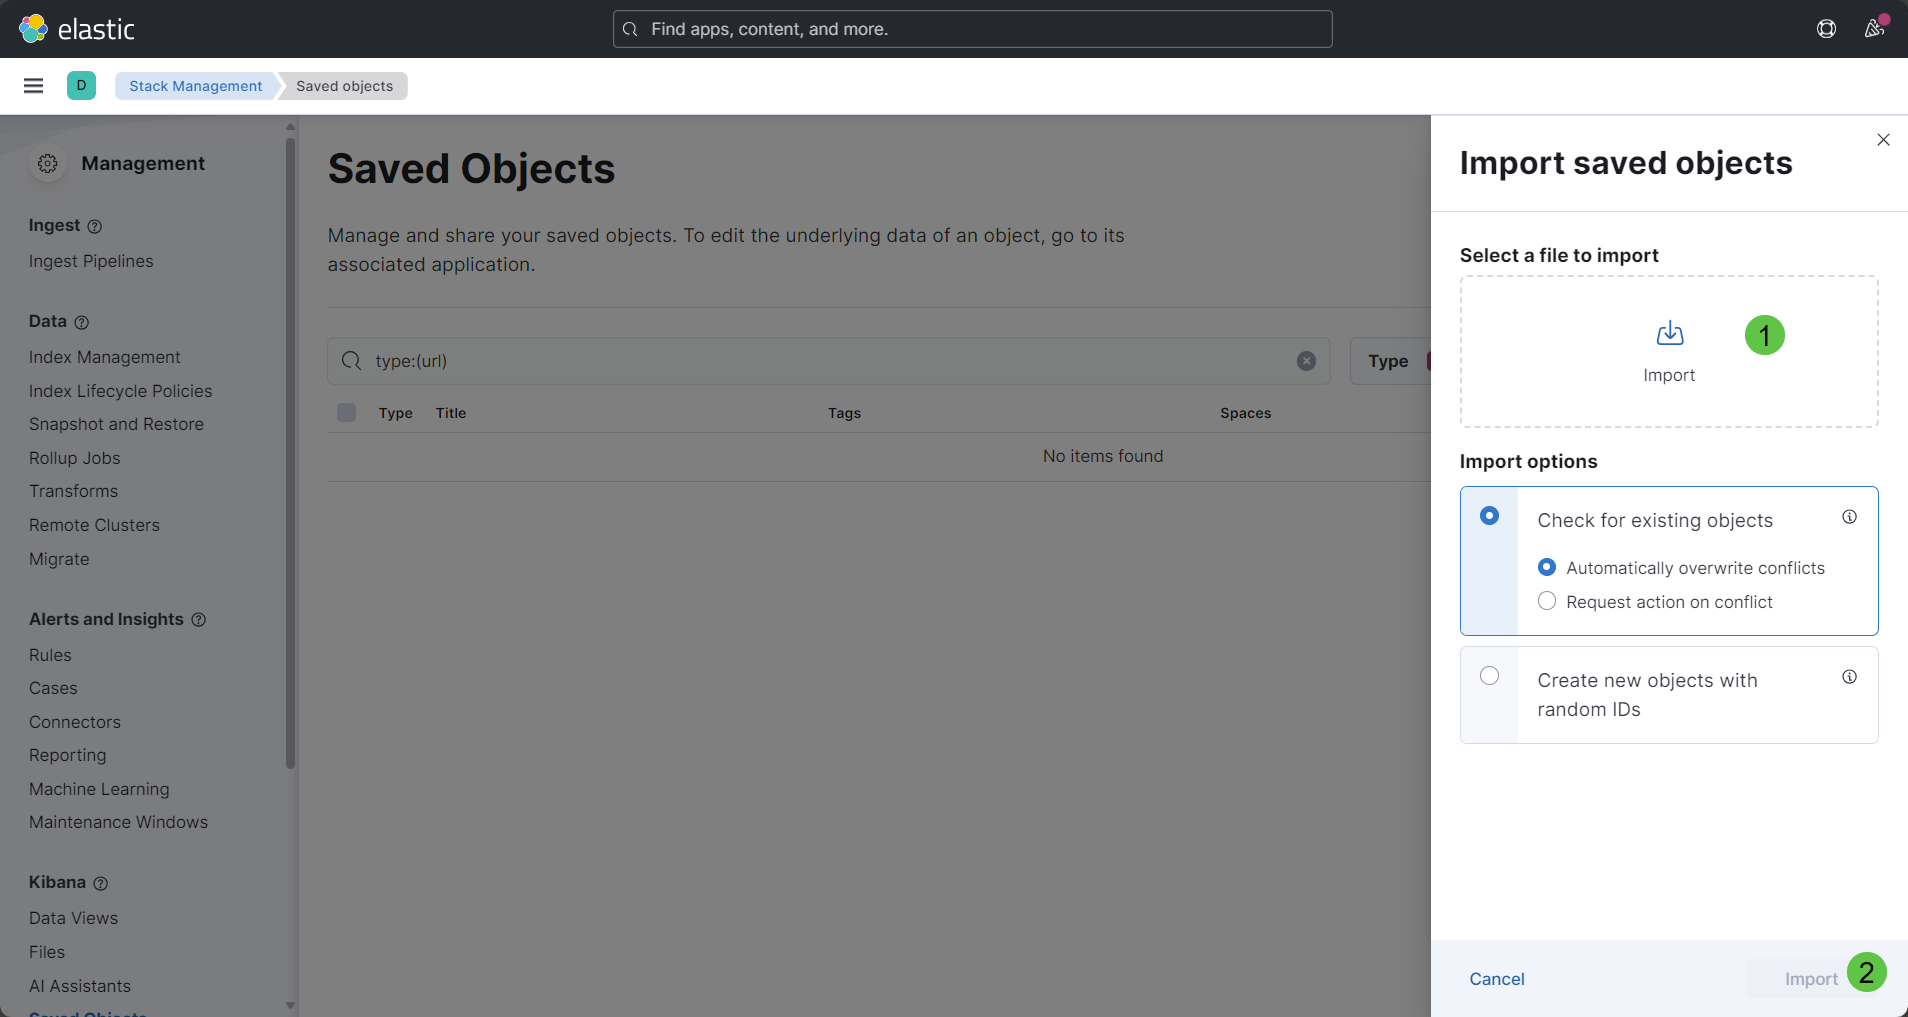
In the Import Saved Objects panel on the right-hand side, click Import again and point to the downloaded. ndjson file from the GitHub Repository. After the file was selected, click on the import link in the bottom right corner.
Elasticsearch Index Templates
Elasticsearch Index Templates are used to automatically apply settings, mappings, and aliases to new indices that match a specified pattern. They are essential for defining consistent configurations across multiple indices.
To configure an Elasticsearch index template for Veeam Backup & Replication using a curl command over SSH, follow these steps.
- SSH into the Elastic Stack Host
- Execute this Curl Command:
curl --insecure -u elastic -X PUT "https://localhost:9200/_index_template/veeam-vbr-template" \
-H 'Content-Type: application/json' \
-d '{
  "index_patterns": ["veeam-vbr-*"],
  "template": {
    "settings": {
      "number_of_replicas": 0
    },
    "mappings": {
      "properties": {
        "vbr_data": {
          "properties": {
            "TransferredGb": {
              "type": "integer"
            }
          }
        }
      }
    }
  }
}'
The command asks for the elastic user's password.
Note: The mapping configuration is still a work in progress and may be adjusted over time.
Logstash Configuration
Now we have the Elastic environment ready to send data from Logstash. We now only need to provide the Logstash service. All necessary configurations are included in a Docker image to ensure rapid deployment as well. The instructions in the GitHub repository describe how the container can be deployed.
The setup assumes that the container is also located on the same system on which the Elasticsearch container is running.
The logstash configuration file takes into account the changes to syslog introduced with version 12.1.2 (See KB4510).
Note: The provided Logstash configuration (logstash-veeam-syslog.conf) is still a work in progress and will be adjusted over time. It listens for incoming messages on TCP port 5514. A future version of the container with the possibility of Syslog via TLS is in progress.
Configure Veeam Backup & Replication
And last but not least, we need to configure Event Forwarding in Veeam Backup & Replication. Follow these steps to add a Syslog server:
- From the main menu, select Options > Event Forwarding.
- In the Syslog servers window, click the Add… button.
- In the Server field, specify the FQDN or IPv4 address of the system where Logstash is listening.
- In the Transport field, specify the transport protocol: TCP/Port 5514.
- Click the OK button twice.
Check the Setup and Dashboard
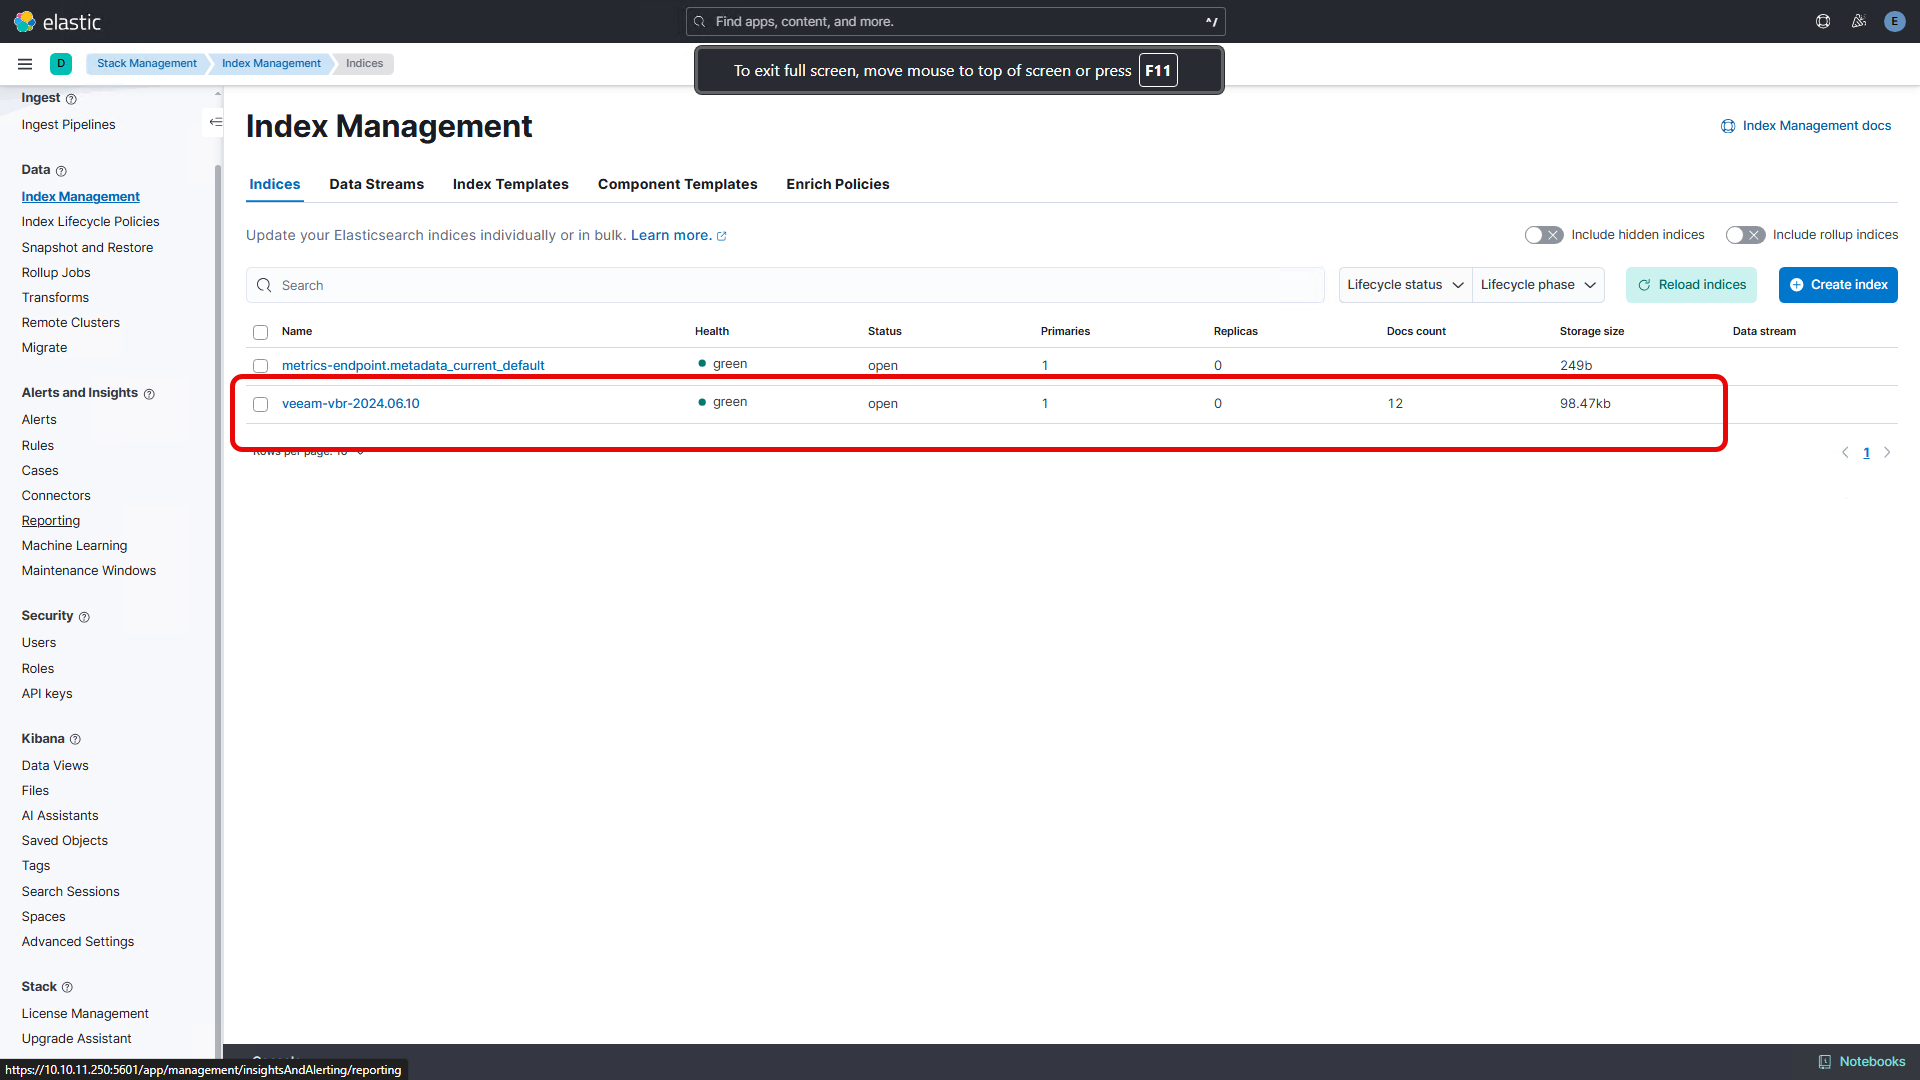
Now you can check on the Elastic Web Console whether the first data has been written into the index. To do this, type Index Management into the search field and click on Data / Index Management to open the Saved Objects administration pane.
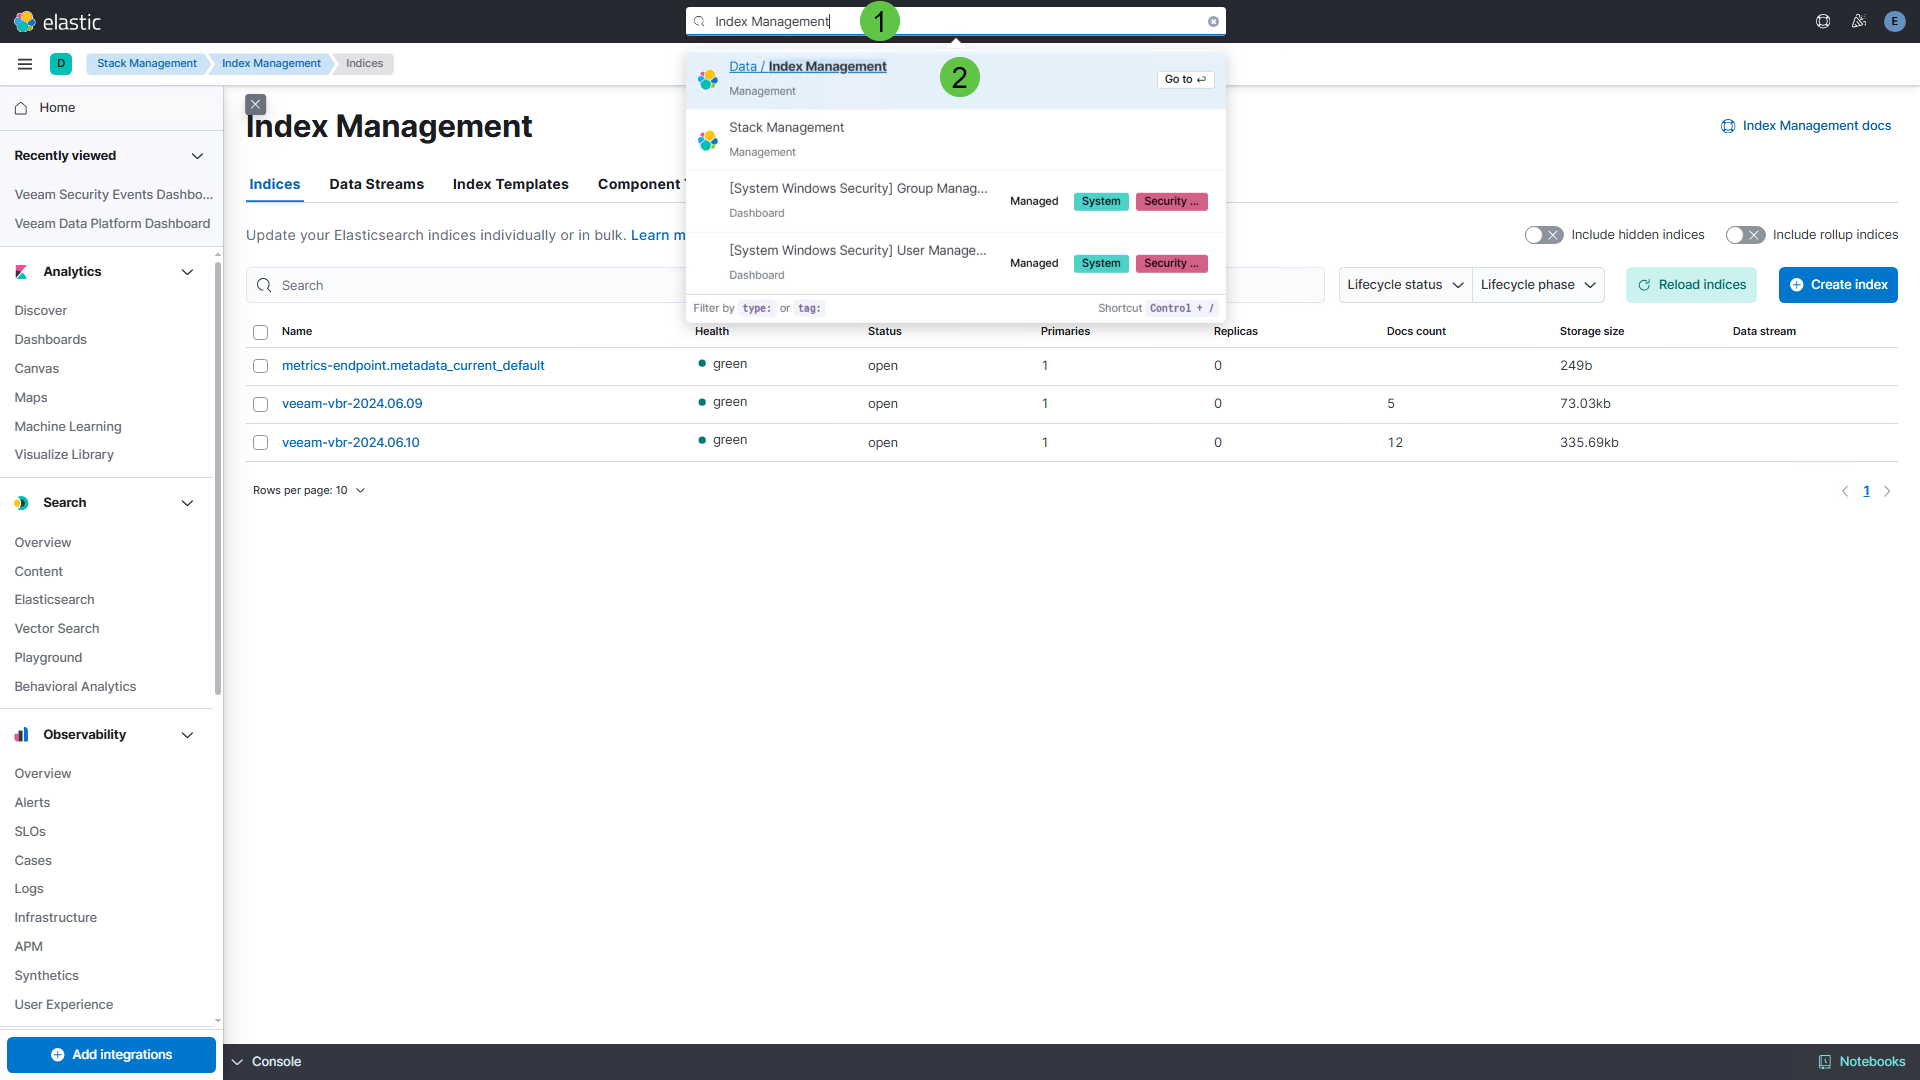
As soon as the first Syslog messages arrive, an index gets created according to the following scheme (veeam-vbr-YYYY.MM.DD). The Docs count column shows the number of syslog messages received.
Dashboards
The following two Dashboards provide different information about your Veeam Backup & Replication Servers that send Syslog data. The Dashboards allow filtering by specific Veeam Backup & Replication server(s).
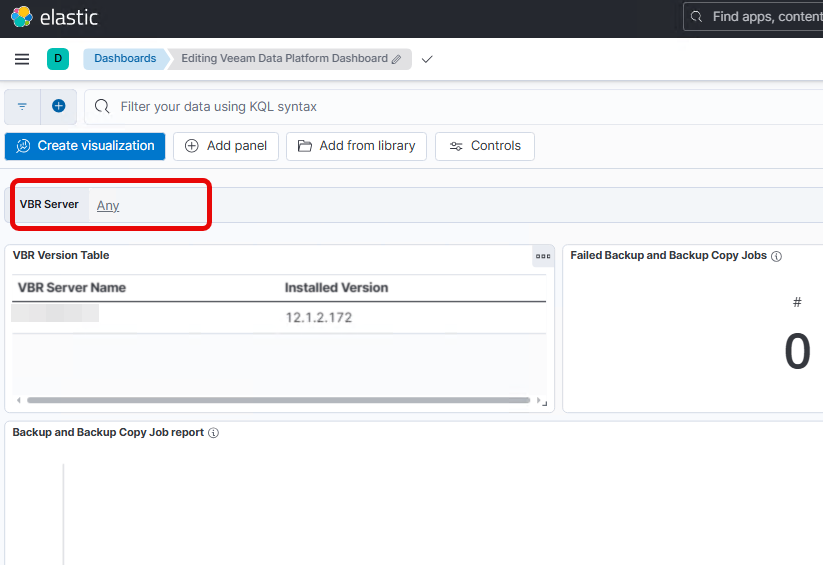
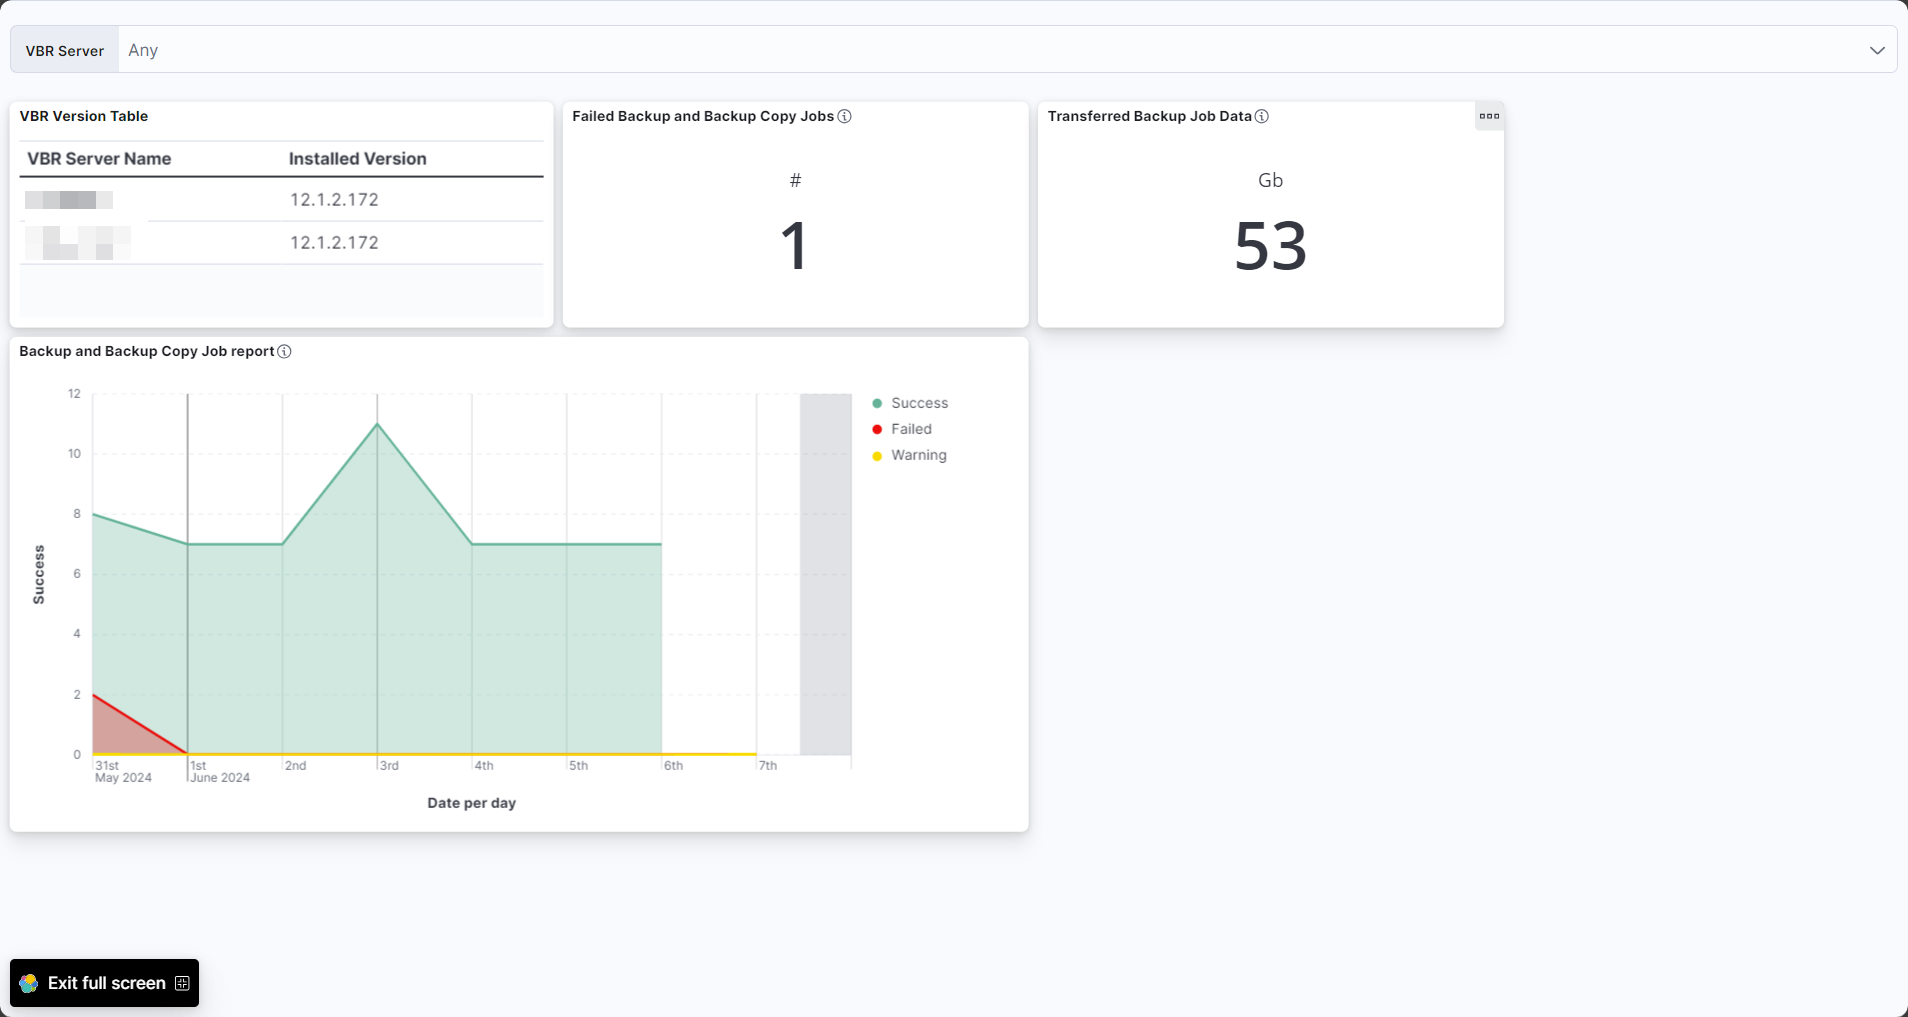
Veeam Data Platform Dashboard
The Veeam Data Platform Monitoring dashboard displays aggregated information about jobs run on your Veeam Backup & Replication servers. It contains the following visualizations:
- VBR Version Table: Installed Veeam Backup & Replication version
- Failed Backup and Backup Copy Jobs: The total amount of backup and backup copy jobs finished with the Failed status.
- Transferred Backup Job Data: The total amount of transferred data (Backup Jobs).
- Backup and Backup Copy Job Report: A colored graph displaying daily statistics on finished backup and backup copy jobs.
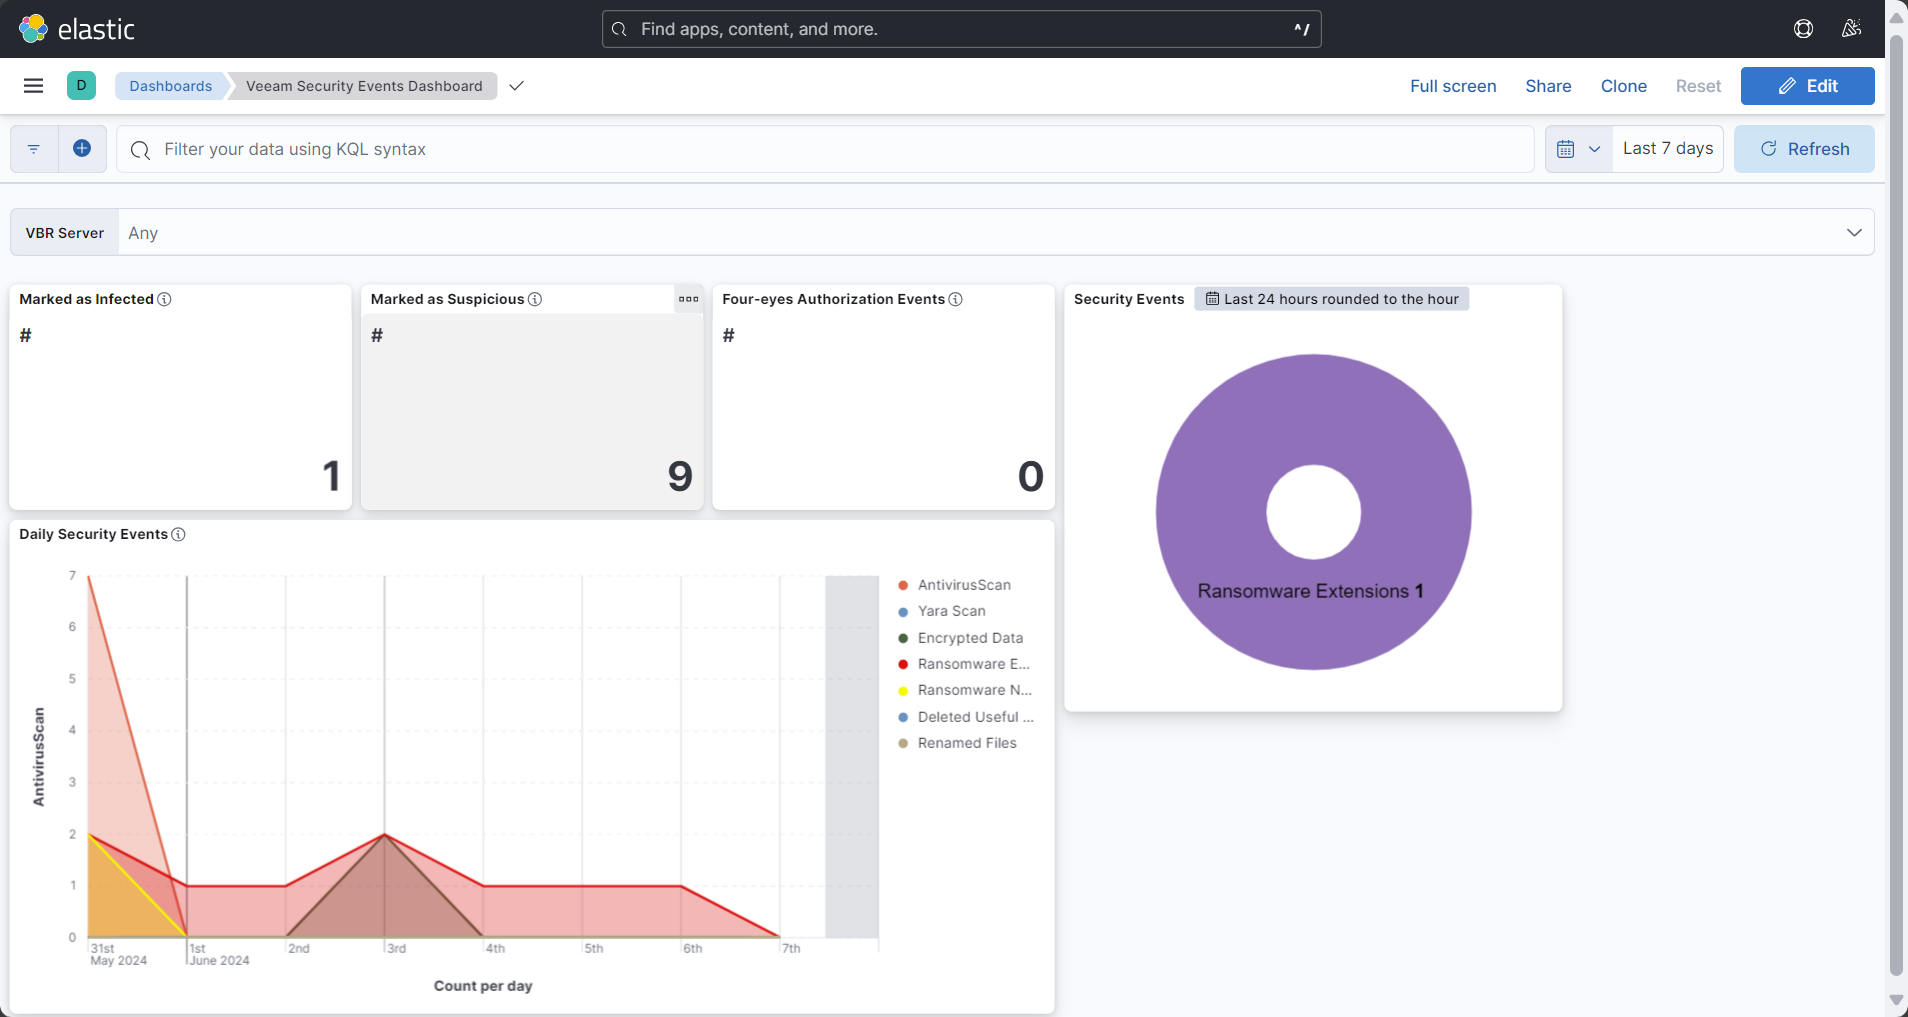
Veeam Security Events Dashboard
The Veeam Security Events Dashboard displays infrastructure security state and aggregated information about security events triggered on your Veeam Backup & Replication servers. The Dashboard contains the following visualizations:
- Marked as Infected: The total amount of objects marked as Infected.
- Marked as Suspicious: The total amount of objects marked as Suspicious.
- Four-eyes Authorization Events: The total amount of four-eyes authorization events.
- Security Events during the past 24 hours
- Daily Security Events: Daily statistics on security events by type.
Outlook
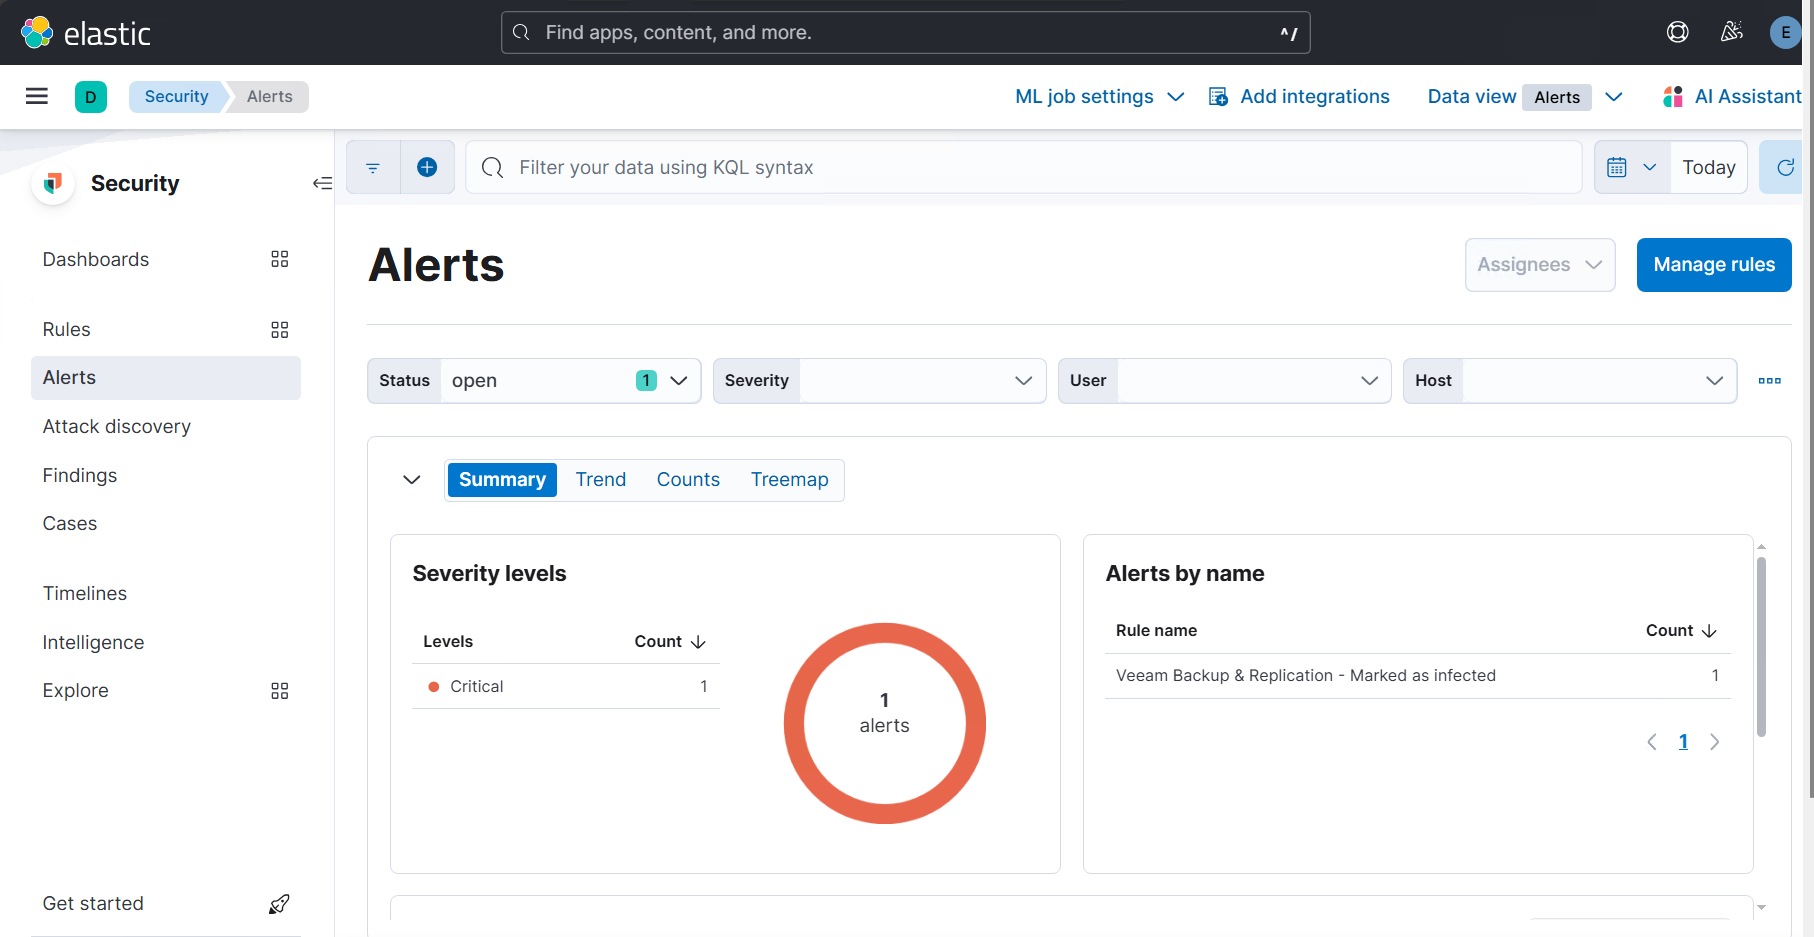
As already mentioned, the whole project is still under development, and for the time being should give an insight into what is possible. For example, the possibility of providing Detection Rules in Elastic Security is currently being reviewed.
The possibility of dashboards in the Elasticsearch alternative OpenSearch is also being looked at. And as always: Feedback welcome!
Cheers,
Steve💖
Edit 24.12.2024 🎄- Corrected URL to external GitHub page and updated Logstash documentation URL. Veeam ONE is now also included.
