

I would like to share with you my experience in achieving Enterprise Observability, and how I utilized Veeam ONE to enhance the visibility of my environment.
Quick intro
As you may know, achieving Enterprise Observability is not an easy task, especially with the abundance of monitoring tools out there, each with their own unique functionalities that may overlap with one another.
However, Veeam ONE stood out to me as one of the most efficient tools, offering over 340 native alarms to keep me on top of anything happening to my Virtual Infrastructure, Veeam Data Platform, and the status of its components.
What's more, Veeam ONE also offers great reporting capabilities, with over 150 reports that can be scheduled and sent in PDF format for better audit.
To take it up a notch, I combined the real-time alarms from Veeam ONE across the entire stack and sent it to my favorite Syslog tool, Grafana Loki. The best part is, you don't need to configure anything on vCenter, ESXi, VBRs, VB365, or VB Servers.
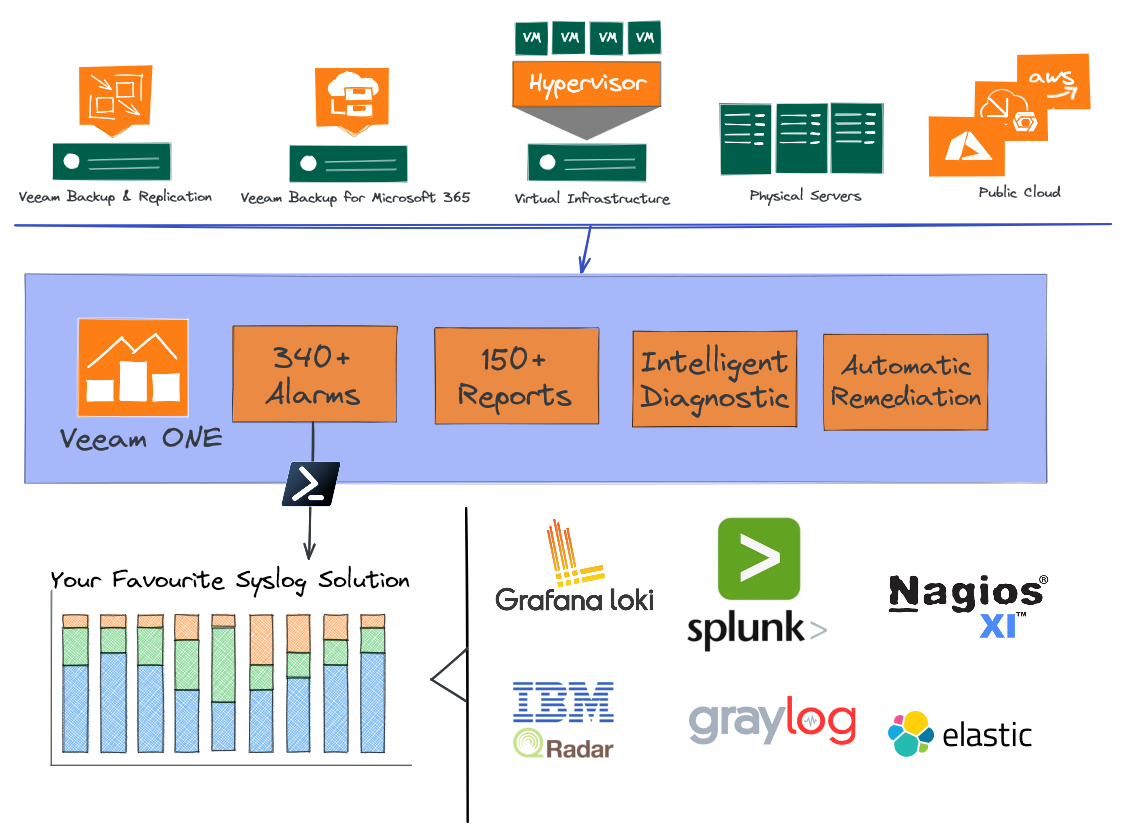
Quick diagram of the proposed solution
I will like to share with you a concept diagram of what we are trying to achieve here, nothing difficult, Veeam ONE as hub between metrics, data protection, and status, to your current/favourite Syslog tool:
Veeam ONE notifications attributes
To achieve this, we utilized Veeam ONE notifications attributes, which allow us to export the information of the alert into plain text, so we can parse this information and send it to our Syslog Server.
- %1 – Alarm name
- %2 – Affected object name
- %3 – Alarm summary
- %4 – Time
- %5 – Alarm status
- %6 – Previous alarm status
- %7 – Alarm ID
Particularly, and for this case, we will make sure just of %1 %2 %3 %4 %7. Let's jump to the small steps to have this ready.
#1 - How-to send Syslog with PowerShell Posh-SYSLOG
We need this very small PowerShell CMDlet called Posh-SYSLOG, on your Veeam ONE Server, open a PowerShell with Administrator rights and install it:
Install-Module -Name Posh-SYSLOGIf you face any problems during installation, you might need to change the execution policy. Run this command on your PowerShell to do so:
Set-ExecutionPolicy RemoteSignedWell, that's it! I mean it could not be simpler.
#2 - Small PowerShell script to handle the Alarm Status
If you are familiar with Syslog, you know that the only accepted level status are the next:
Emergency, Alert, Critical, Error, Warning, Notice, Informational, DebugBut Veeam ONE mark the resolved alarms as "Resolved", or "Informational", which we can not send directly to a Syslog, so the script changes them quick to "Notice", "Informational", you can adjust to your needs.
You can quickly download the file directly from GitHub. Save it to the folder you prefer, knowing the path as we will use on next step.
#3 - Define the alarms we want to send to Syslog
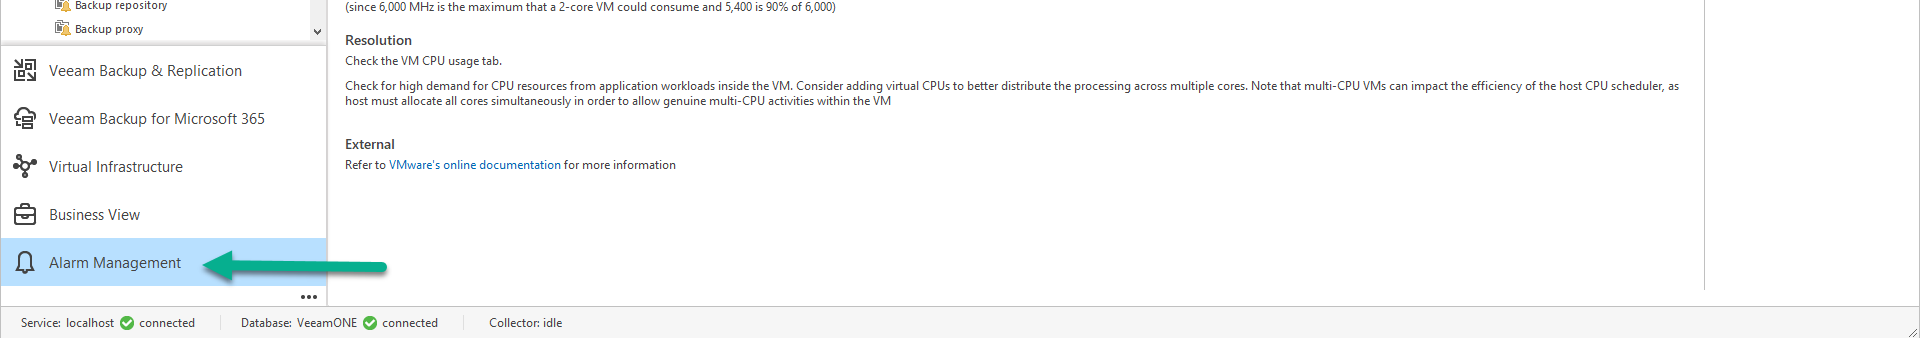
We are in the last part of the tutorial, now we will need to go to Veeam ONE Client, under the Alarm Management section:
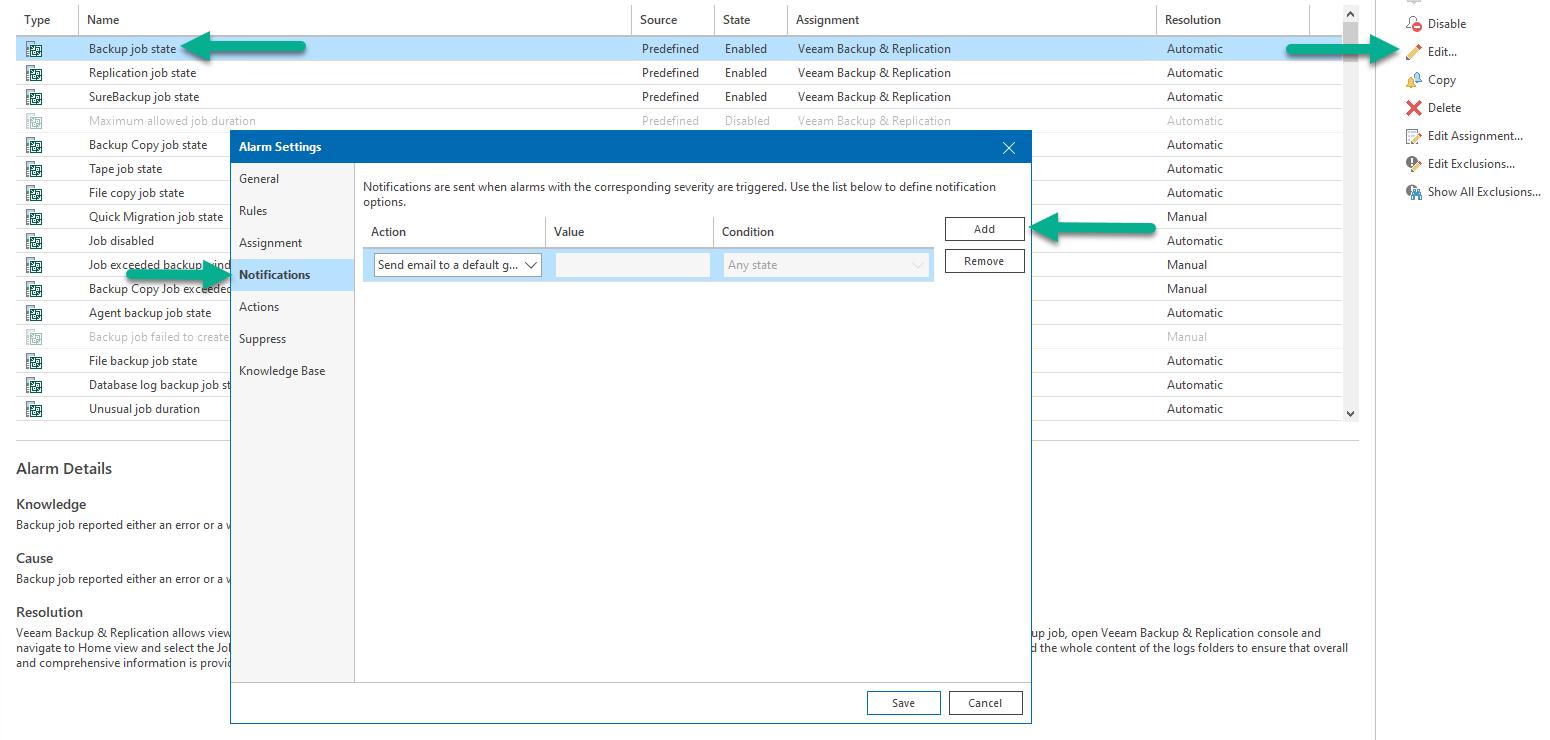
And pick the alarm, or alarms you want to send to syslog, for example the most common one is the Backup Job State, to get the details about our policies, let's open it, and go to Notifications tab, and click Add:
Select the Action called Run script, and inside it add the next (bearing in mind your Script name, and path). As you can see on the next parameter after the script path, that is the Syslog Server, it can be either a FQDN, or a simple IP as you can see:
powershell.exe "C:\VONE-Send-Syslog.ps1" '192.168.1.3' '%1' '%3' '%2' '%5' '%7'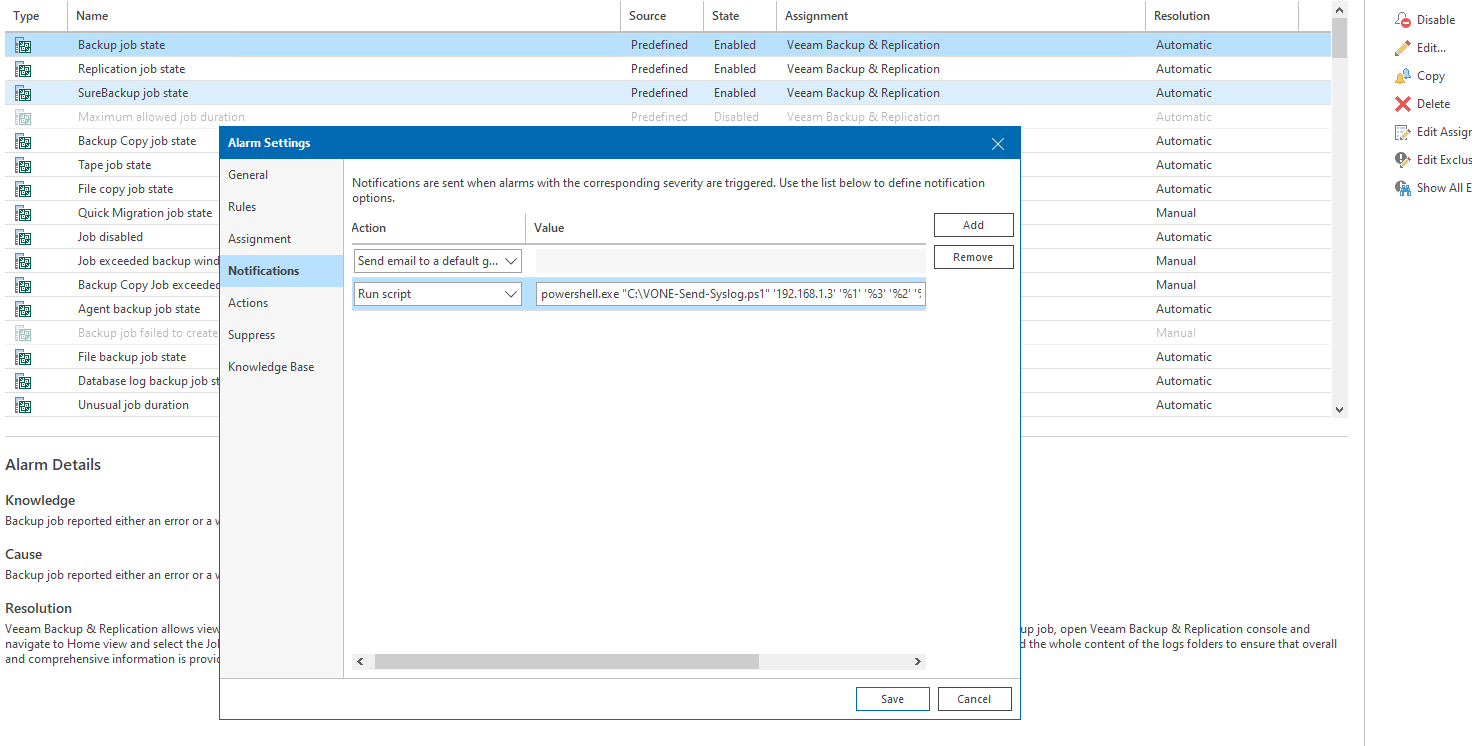
Congratulations! That's a great work done. After this, you just need to wait until the alarm triggers, whatever the alarm is, VM CPU Usage, VM CPU Ready, perhaps the great Unusual Job Duration, or the Possible Ransomware activity, etc. I think you could find something useful inside one of the 340+ alarms :)
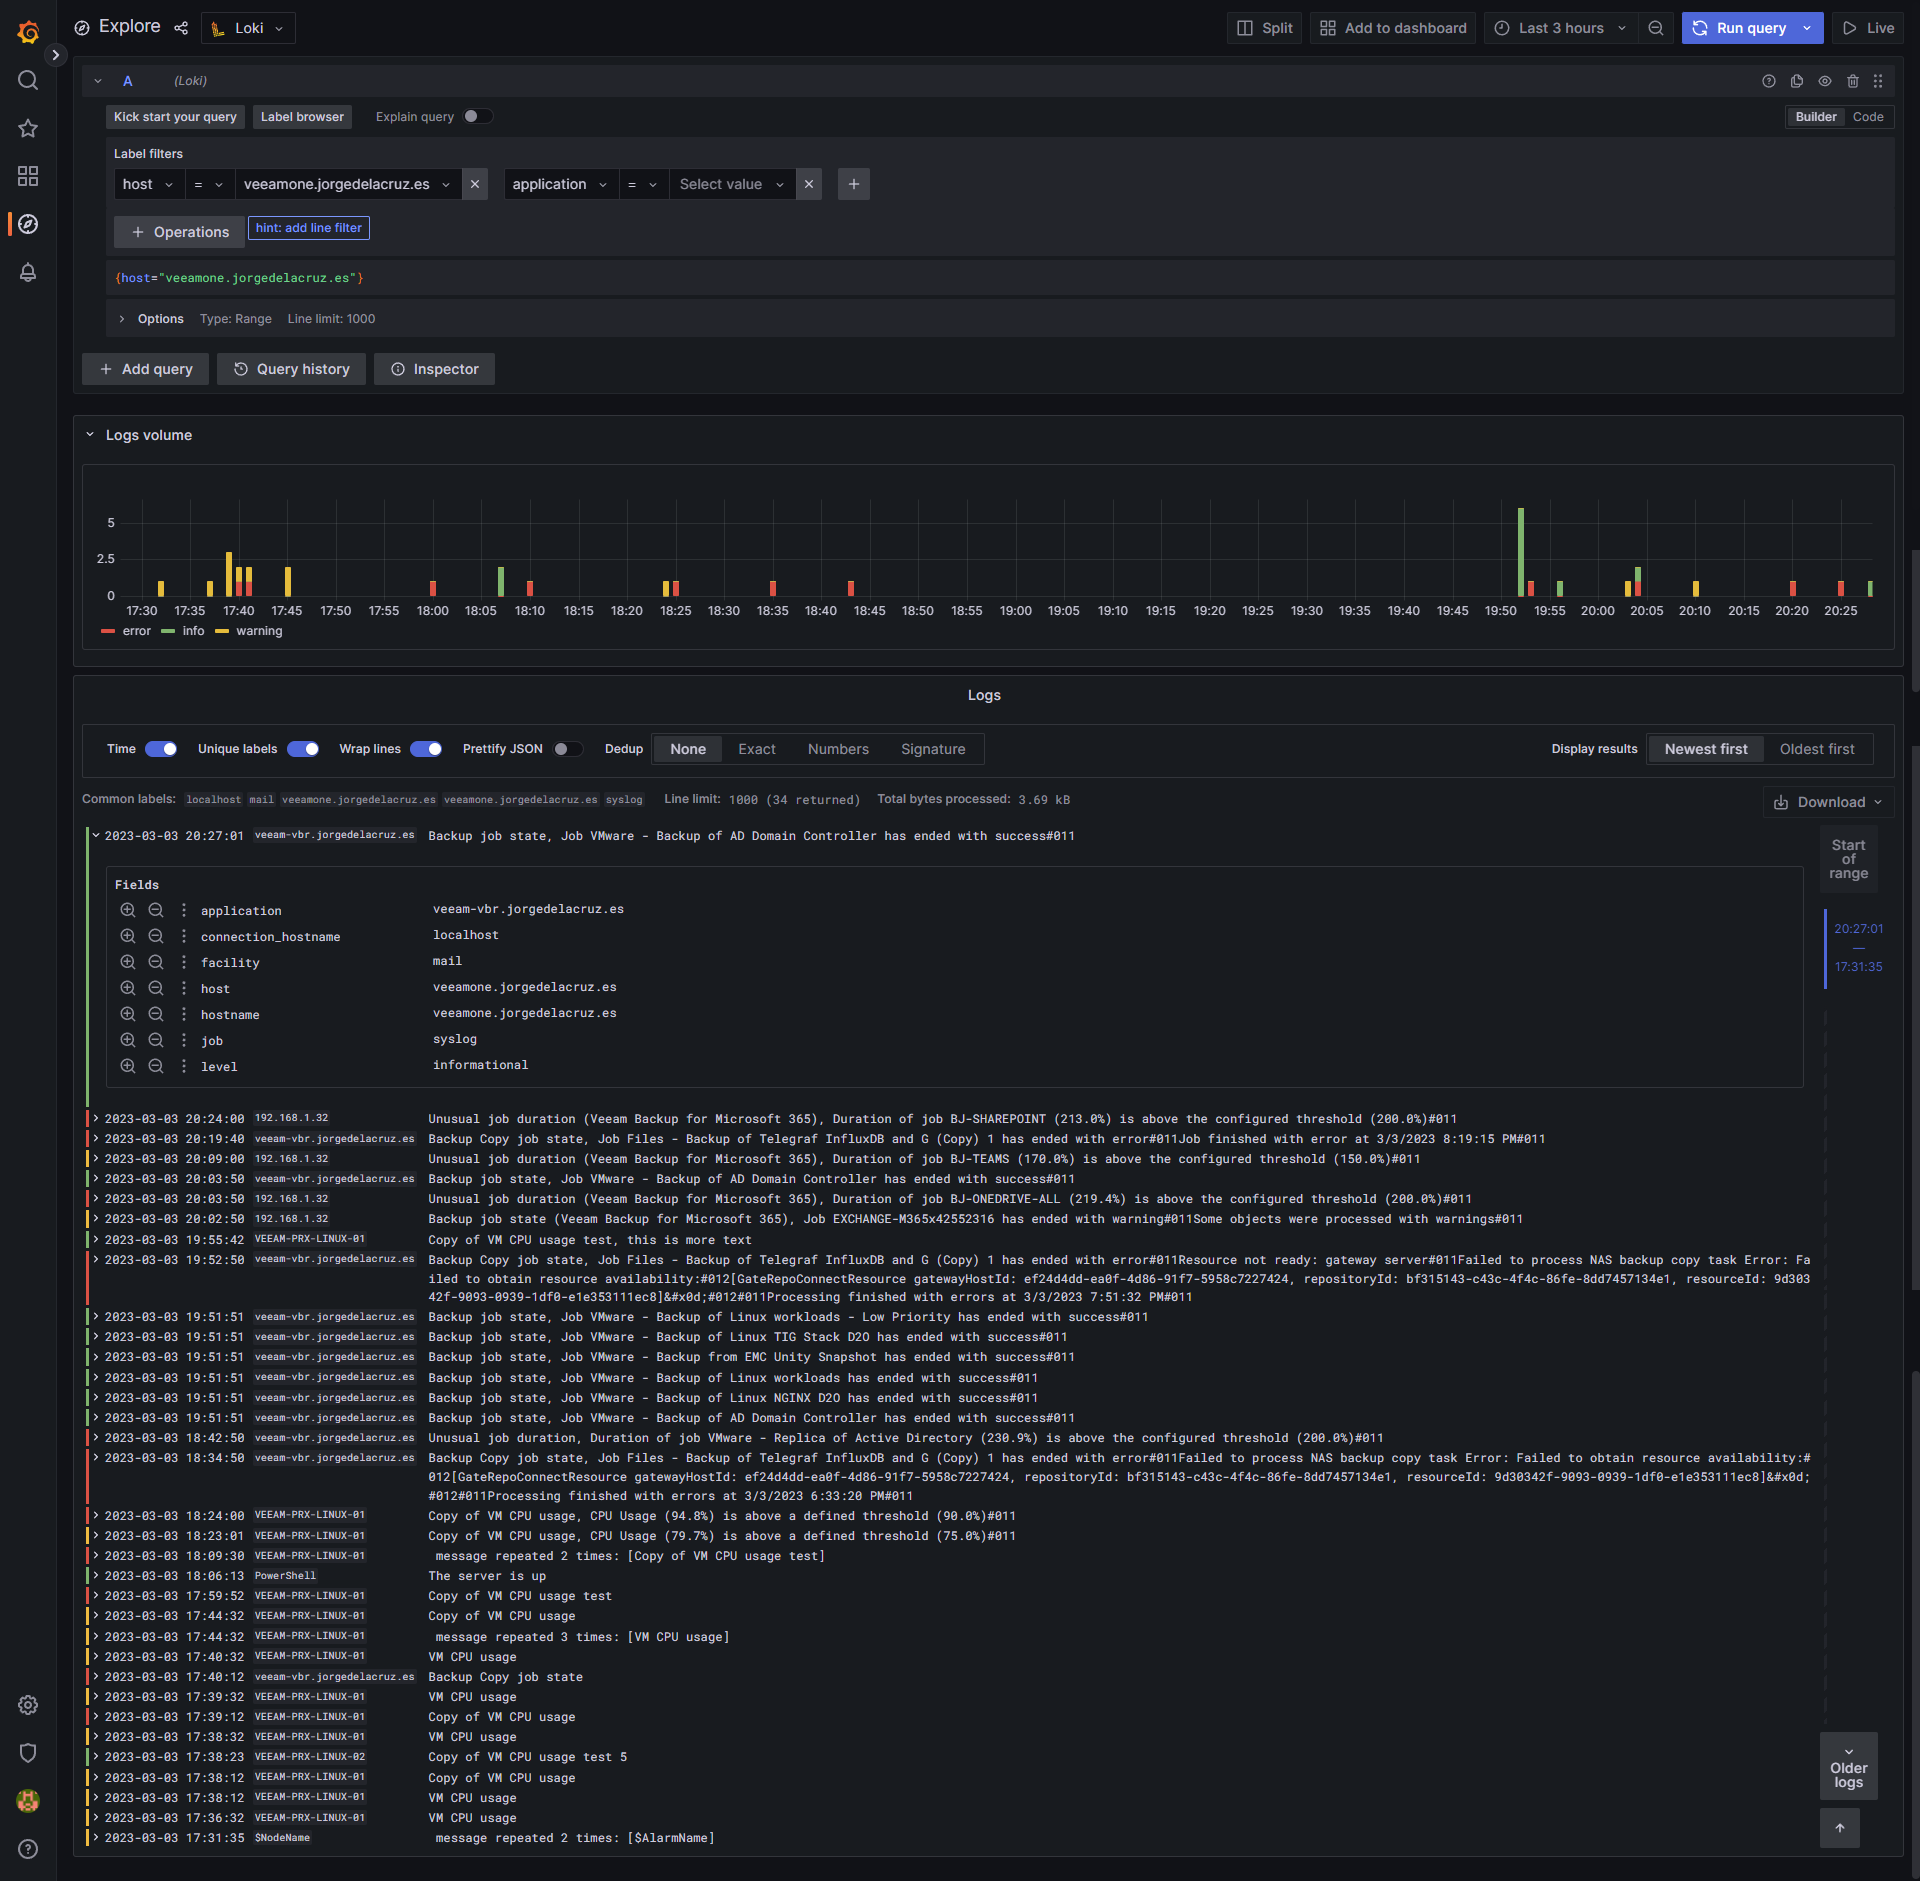
#4 - Quick Veeam ONE Syslog Overview with Grafana Loki
Now that we have an Enterprise Monitoring, Alarming, and Reporting tool like Veeam ONE, sending everything to my Grafana Loki syslog, how will this work?
Quite nicely, actually. On your Grafana Explorer, you can take a look and filter by your Veeam ONE Server and even by object name (Application on the syslog).
Knowing that most monitoring tools support Syslog, you can send this information to IBM QRadar, Splunk, Elastic, Graylog, Loki, or even Azure or other Cloud vendors that offer metrics services.
I hope this guide has been helpful to you, and I wish you all the best in achieving Enterprise Observability. Happy building!


