Introduction
As security operations centers (SOC) manage a daily flood of alerts and logs, the ability to effectively analyze and interpret this log data becomes an essential part of the cybersecurity workflow. Processing and investigating security incidents are the be-all and end-all of any SOC analyst. Before starting an investigation, we must have a common terminology to define attacks and security-related activities and a search that leads us to those activities.
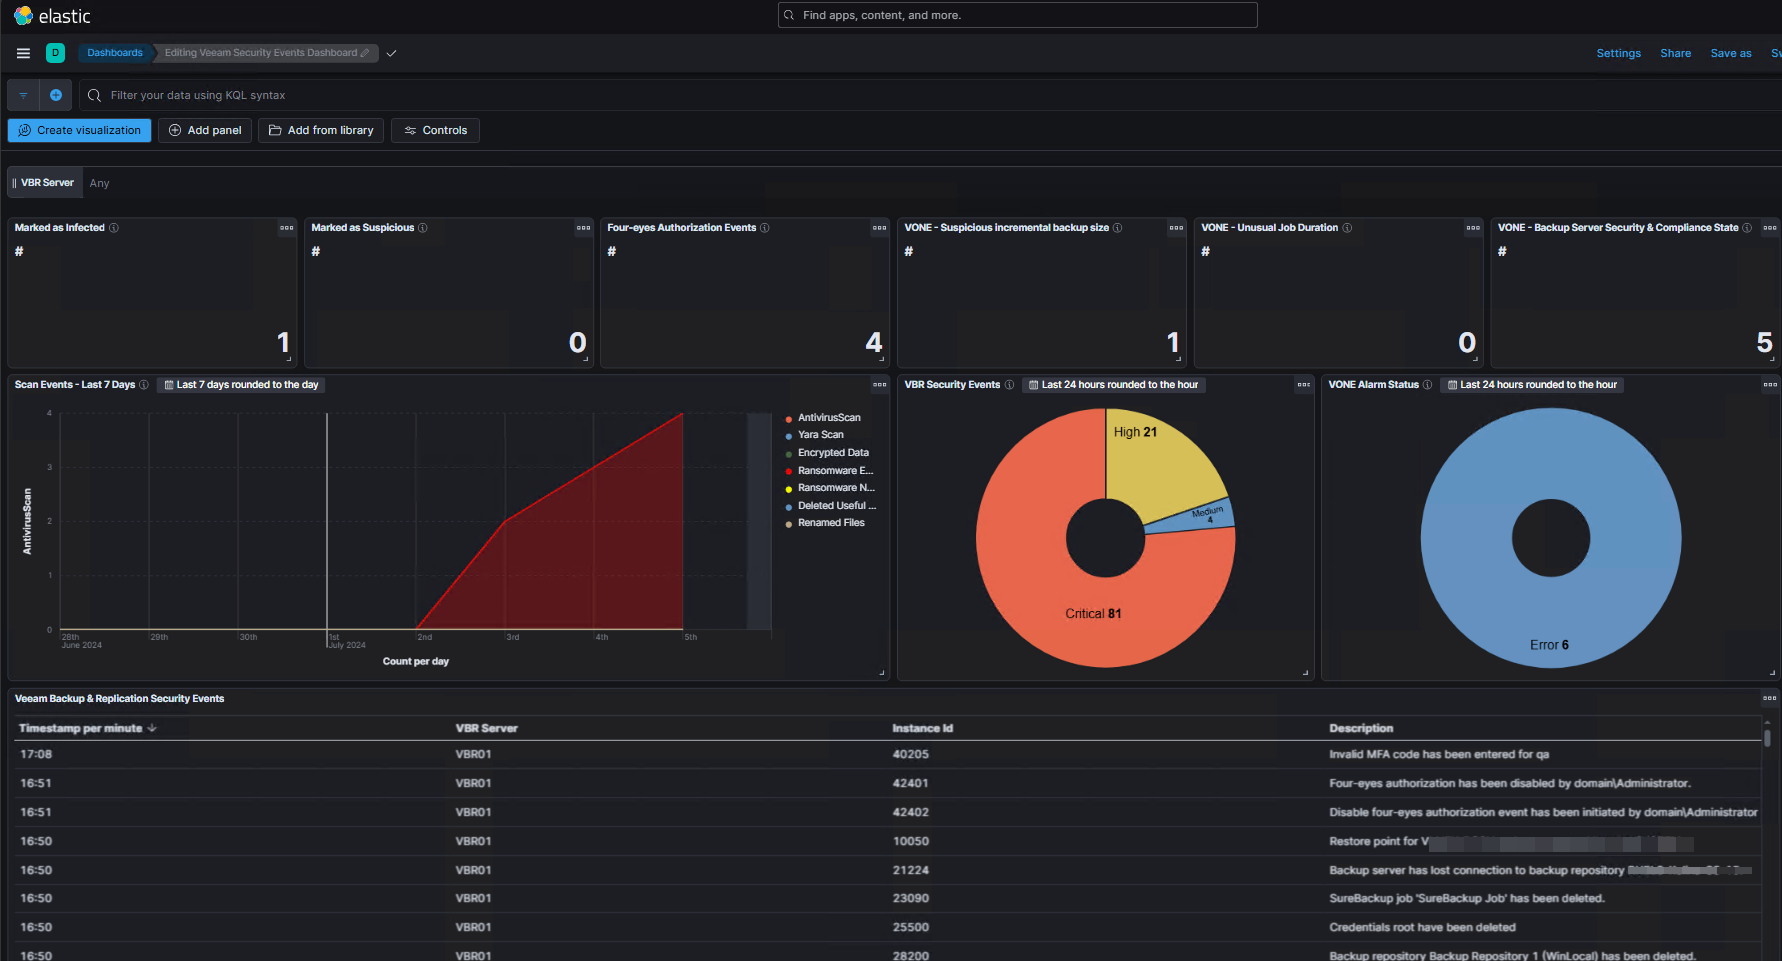
In my previous blog post, I demonstrated how log data from VBR can be sent to Elastic via Syslog for evaluation and visualization. Let us take a step back and start with the basics.
The Basics
Security Information and Event Management (SIEM) systems centralize the collection and analysis of log data across diverse sources, offering features like data aggregation, uniform formatting, pattern detection through correlation, secure log storage, in-depth analysis, and detailed reporting to ensure comprehensive security event management and response.
Practical Example
Consider a SOC analyst who gets the following Veeam Backup & Replication Syslog entry for a “Malware Activity Detected “ event and needs to extract specific details such as the event timestamp, the source host, and a descriptive summary of the alert:
<14>1 2024-06-24T06:41:52.559130+00:00 VBRSRV01 Veeam_MP - - [origin enterpriseId="31023"] [categoryId=0 instanceId=41600 DetectionTimeUTC="06/24/2024 06:41:29" OibID="672f4c07-add8-4c17-b08e-27e2520a37c4" ActivityType="RansomwareExtensions" UserName="WORKGROUP\SYSTEM" UserFullInfo="<ModifiedUserInfo fullName="WORKGROUP\SYSTEM" loginType="0" />" ObjectName="VM01" VbrVersion="12.1.2.172" Version="1" Description="Suspicious files can be found on the backup server VBRSRV01 at C:\ProgramData\Veeam\Backup\Malware_Detection_Logs\suspicious_files_24-06-24.log Potential malware activity detected: *.onion(Dharma): 182 *.kuiper(Kuiper Ransomware): 1 for OIB: 672f5c07-6fd1-ac1d-b18e-27e2520d37c4 (VM01), rule: RansomwareExtensions by user: WORKGROUP\SYSTEM."]First, let us break up this message into fields according to RFC5424.
| Fieldname | Value | Description |
| PRI | <14> | Priority Value 14. |
| VERSION | 1 | Version of the Syslog protocol specification |
| TIMESTAMP | 2024-06-24T06:41:52.559130+00:00 | The date and time when the message was generated |
| HOSTNAME | VBRSRV01 | The hostname or the IP address of the machine from which the message was sent |
| APP-NAME | Veeam_MP | The application that originated the message |
| PROCID | - | The process ID (no value given) |
| MSGID | - | The message ID (no value given) |
| STRUCTURED-DATA | [origin enterpriseId="31023"] [categoryId=0 instanceId=41600 ...] | Structured data containing multiple pieces of information, each within its own set of brackets |
| MSG | Message details. May not be sent if message details are included in the STRUCTURED-DATA field |
To decode the Priority value 14, divide the Priority by 8 to find the Facility and use the remainder to find the Severity.
Facility = 14 divided by 8 gives 1 (Each facility has 8 Severity levels, and 14 contains 1 set of 8).
Severity = The remainder of 14 after you divide by 8, which is 6. So, a Priority of 14 means the message comes from Facility 1 (user messages) and Severity 6 (informational).
Log Data Parsing
Log data parsing is the process of extracting information from log data. Structured or unstructured log data is translated for your log management system to read, index, and save this data. Regular expressions (regex) can be used to identify and extract key fields from the logs systematically. The following regular expression is an example of parsing a typical Veeam Backup & Replication Syslog message:
<(?<PRI>\d+)>(?<version>1)\s+(?<timestamp>\S+)\s+(?<hostname>\S+)\s+(?<app>\S+)(?:\s+-\s+-)?\s+(?<structured_data1>\[origin[^]]+\])(?:\s+(?<structured_data2>\[categoryId[^]]+\]))?(?:\s+)?(?<msg>.*)Note: Regex can vary in behavior depending on your application, so it is important to evaluate the regex against a range of log messages thoroughly. Online tools can be extremely helpful in crafting and debugging these complex expressions to ensure they work correctly with the log data you are parsing. (I use https://regex101.com/).
Many SIEM solutions have automated processes to parse and extract valuable fields and field information from the ingested Syslog data. This process typically involves:
- Data Normalization The automated process converts various log formats into a generic format. This includes extracting meaningful fields like timestamps, IP addresses, usernames, event types, etc.
- Field Extraction Advanced parsers or log processors can automatically identify and extract fields from the log data, sometimes using predefined patterns or machine learning techniques.
- Data Enrichment Additional context can be added to extracted data, such as geolocation information derived from IP addresses or threat intelligence lookups.
- Indexing After extraction, data is indexed to facilitate quick searches, allowing for more efficient and faster queries.
Automating these processes enables users to perform complex searches and queries without manually specifying each log entry's structure. Users can write more straightforward and more intuitive queries to search across the normalized data, as the underlying system understands the structure of the data it holds.
It is worth noting that while many systems have robust automatic parsing capabilities, some logs may require custom parsing rules to extract all relevant information accurately, which brings us to the following topic: Query Languages.
Query Languages
With the extracted and saved data, we can now query the data. Query languages allow SOC analysts to navigate the logs and identify threats. They play a key role in this process, providing an optimized way to query logs, set alerts, and perform forensic analysis. Mastering these languages means more efficient threat detection, faster incident response, and an overall improvement in the SOC's defense strategies.
As with other data query languages, such as good old SQL, there are diverse ways to send queries to the various SIEM solutions that return the same results. Solid searches, especially detection rules, follow some structure with specific query components. Some query languages you might come across when searching for or working with these solutions are:
- SPL Used in Splunk environments.
- KQL Kibana query language. Not to be confused with Kusto (see below).
- KQL Kusto query language. A favorite for querying in Azure data platforms.
- XQL Cortex Query Language used in Palo Alto products.
- LQL Enables log analysis in LogScale.
- LOL No query language. But I had to laugh when I searched for all the available languages.
What are we looking for?
When checking log data, it is important to focus on specific entries that can provide information about events or activities. Let's retake our example Syslog message. The second structured data element contains much information. The interesting information is marked in bold.
[categoryId=0 instanceId=41600 DetectionTimeUTC="06/24/2024 06:41:29" OibID="672f4c07-add8-4c17-b08e-27e2520a37c4" ActivityType="RansomwareExtensions" UserName="WORKGROUP\SYSTEM" UserFullInfo="<ModifiedUserInfo fullName="WORKGROUP\SYSTEM" loginType="0" />" ObjectName="VM01" VbrVersion="12.1.2.172" Version="1" Description="Suspicious files can be found on the backup server VBRSRV01 at C:\ProgramData\Veeam\Backup\Malware_Detection_Logs\suspicious_files_24-06-24.log Potential malware activity detected: *.onion(Dharma): 182 *.kuiper(Kuiper Ransomware): 1 for OIB: 672f5c07-6fd1-ac1d-b18e-27e2520d37c4 (VM01), rule: RansomwareExtensions by user: WORKGROUP\SYSTEM."]
The instanceId is one such entry that acts like a marker. It is the ID of an event created by Veeam Backup & Replication. The ID can be looked up in the Veeam Backup & Replication Event Reference.
For example, if a user exceeds the permitted number of attempts for multi-factor authentication, a Syslog entry with the instanceId 40206 is generated.
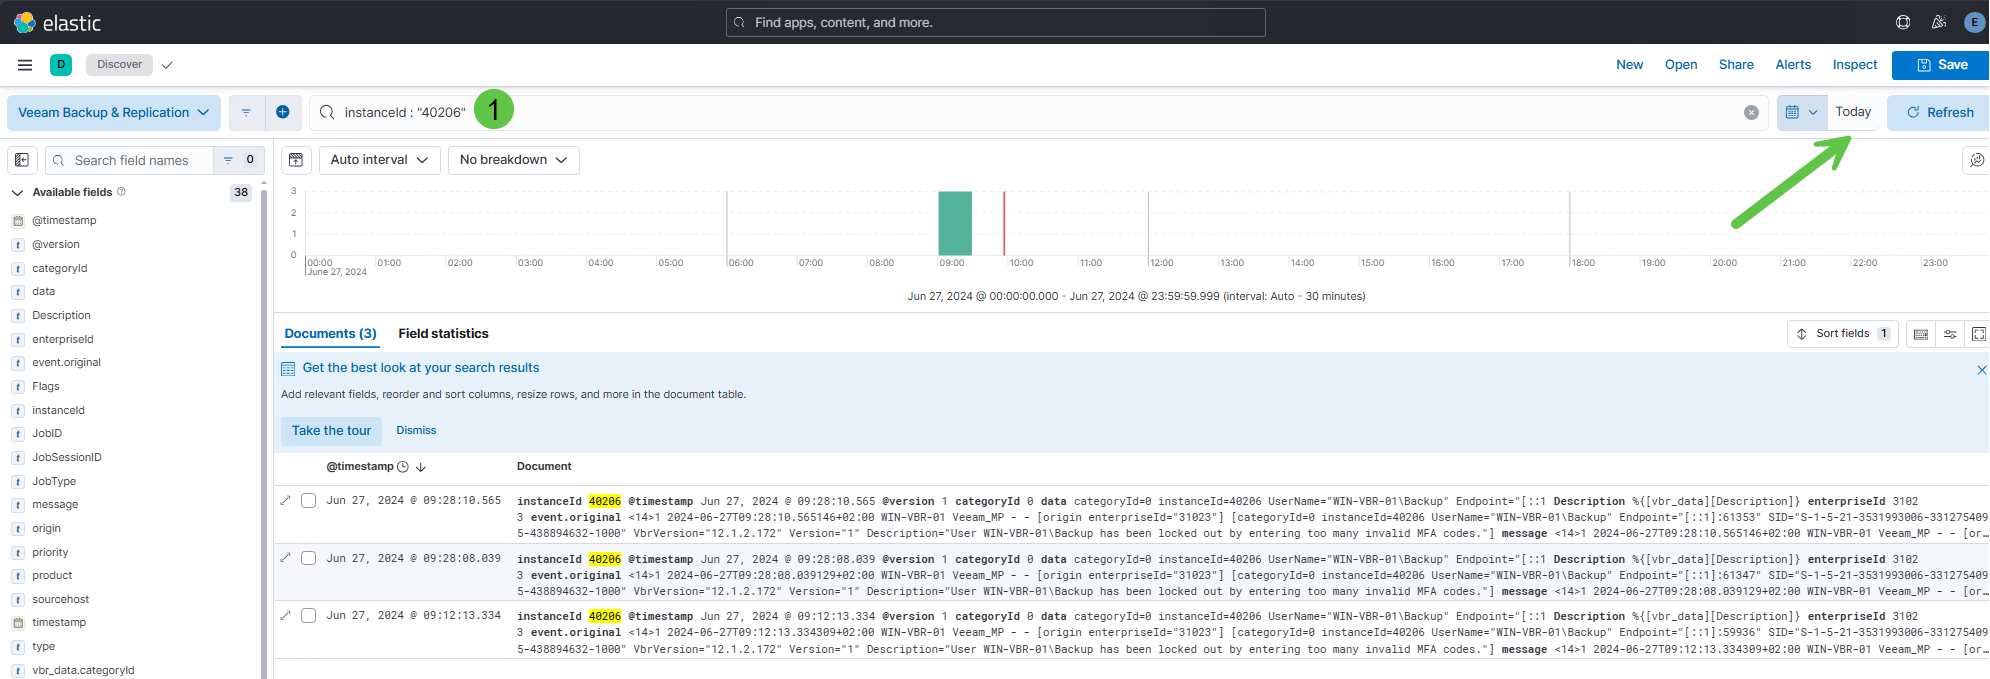
Let us look at what such a query would look like in Kibana.
Note: The information refers to the setup described in the first blog post.
- Access the web console by navigating to https://<your server>:5601. The username is elastic, and the password is defined in the .env file for the ELK stack deployment.
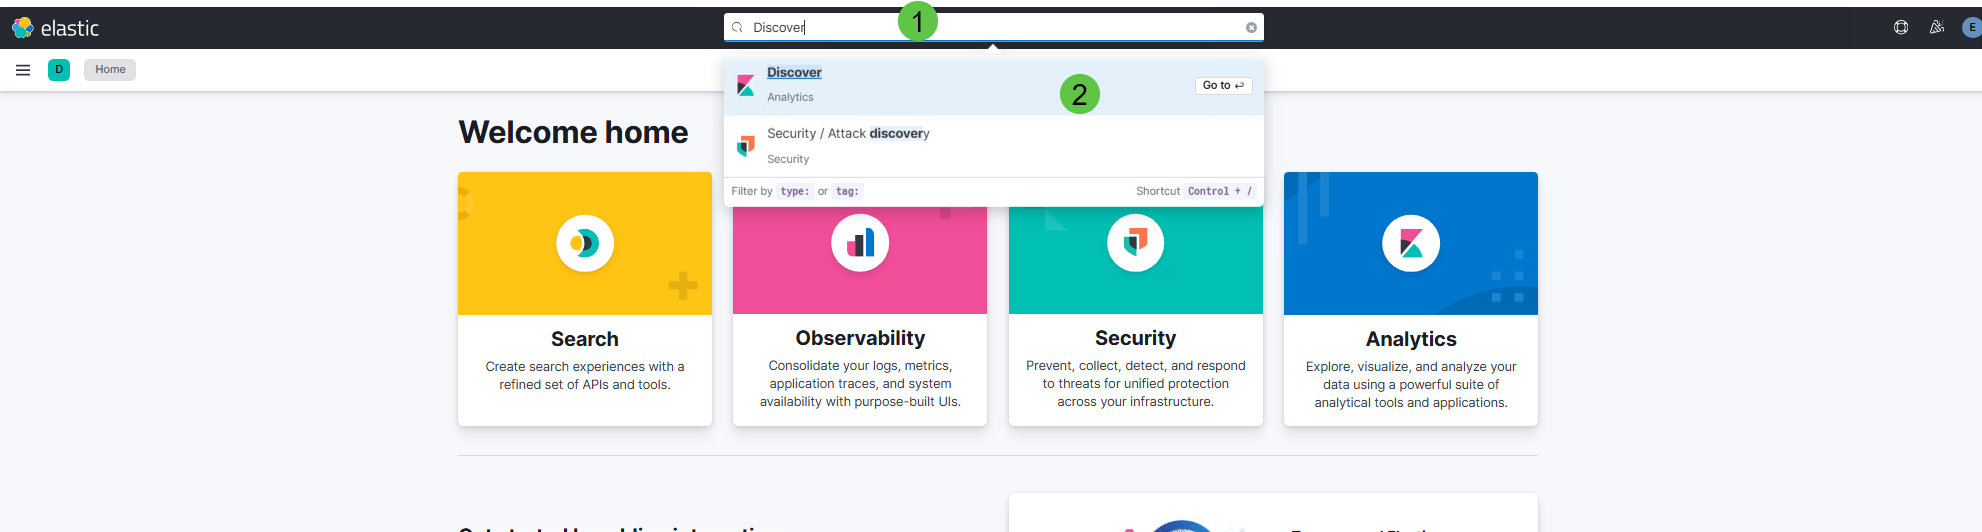
- Enter Discover in the search field and click on Discover / Analytics to open the Discover pane.
- To change the data view, click metrics-* in the upper left area and select Veeam Backup & Replication.
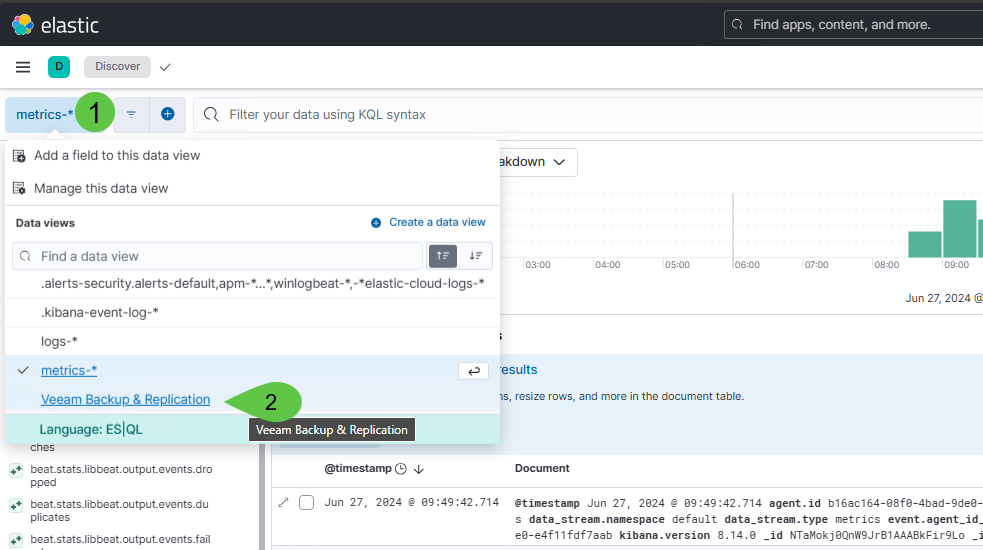
- All stored Syslog entries are displayed.
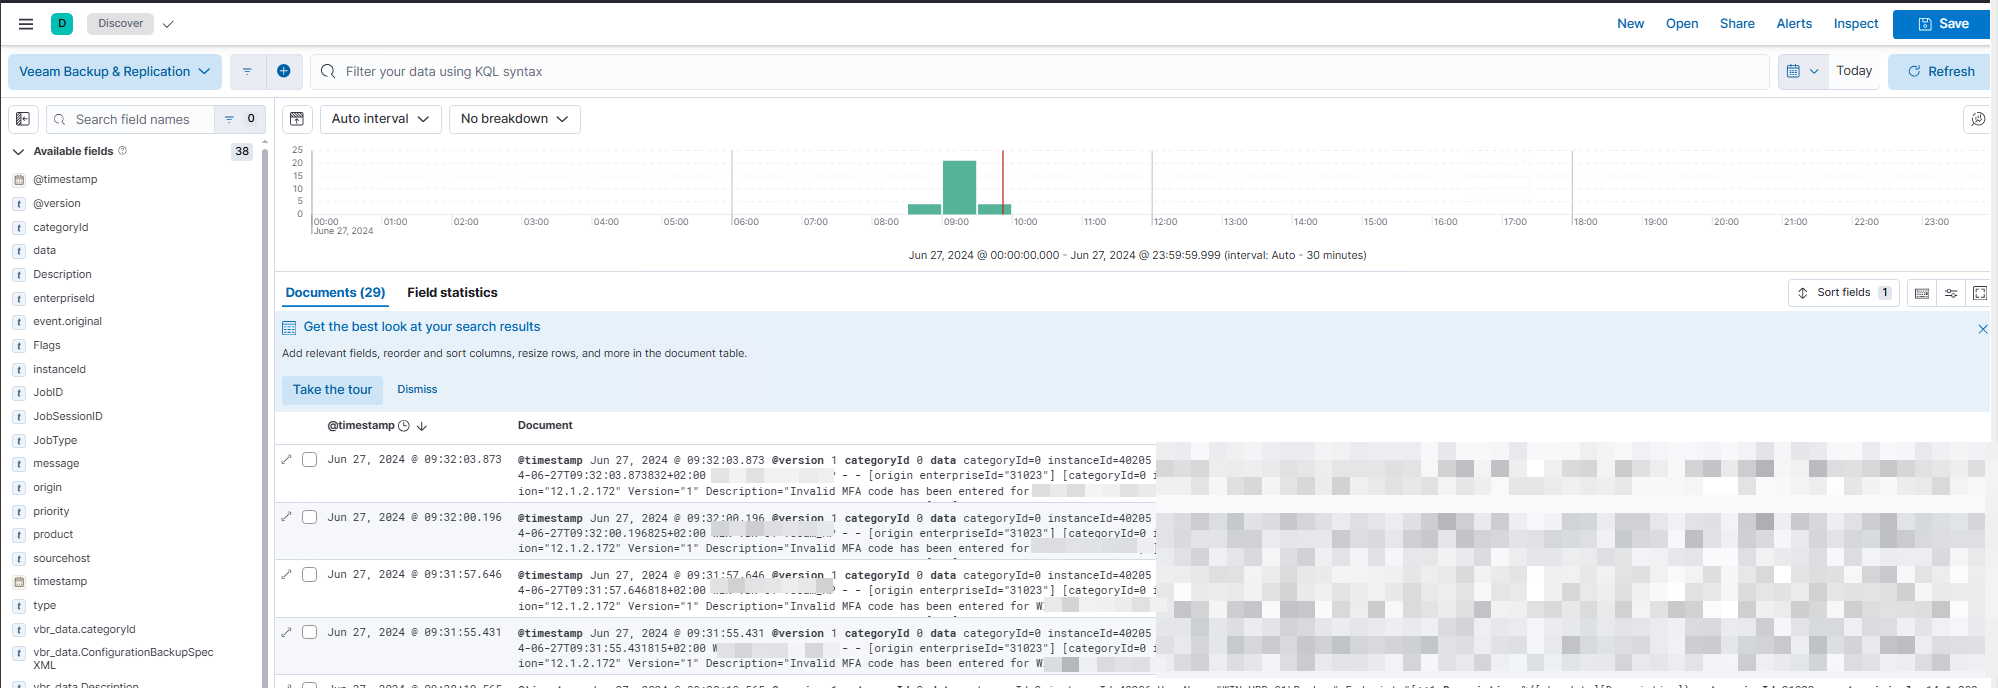
- Type instanceId : "40206" in the KQL query field. Adjust the time range if necessary (upper right area). All events with instanceID are displayed.
Of course, extended queries can also be carried out to perform complex searches. If you want to search for the instanceID 41600, Malware Activity, and the ActivityType "RansomwareNotes", we can use the following query:
vbr_data.instanceId : "41600" and vbr_data.ActivityType : "RansomwareNotes"Note: This Logstash configuration creates the vbr_data.<value> fields.
There are no limits to your imagination. If you want to search for all antivirus scan results for all hosts with the name APPSRV within the given time frame, the query will look like this:
vbr_data.instanceId : "41600" and vbr_data.ActivityType : "Antivirusscan" and vbr_data.ObjectName : APPSRV*From Theory to Practice
Now, we have the basic knowledge to put it into practice. Elastic Security offers us the option of creating detection rules that trigger an alarm in the event of a match. Let us create a rule for event ID 40205 - Invalid Code for Multi-Factor Authentication Entered – that raises an alert if the MFA code was entered incorrectly 3 times.
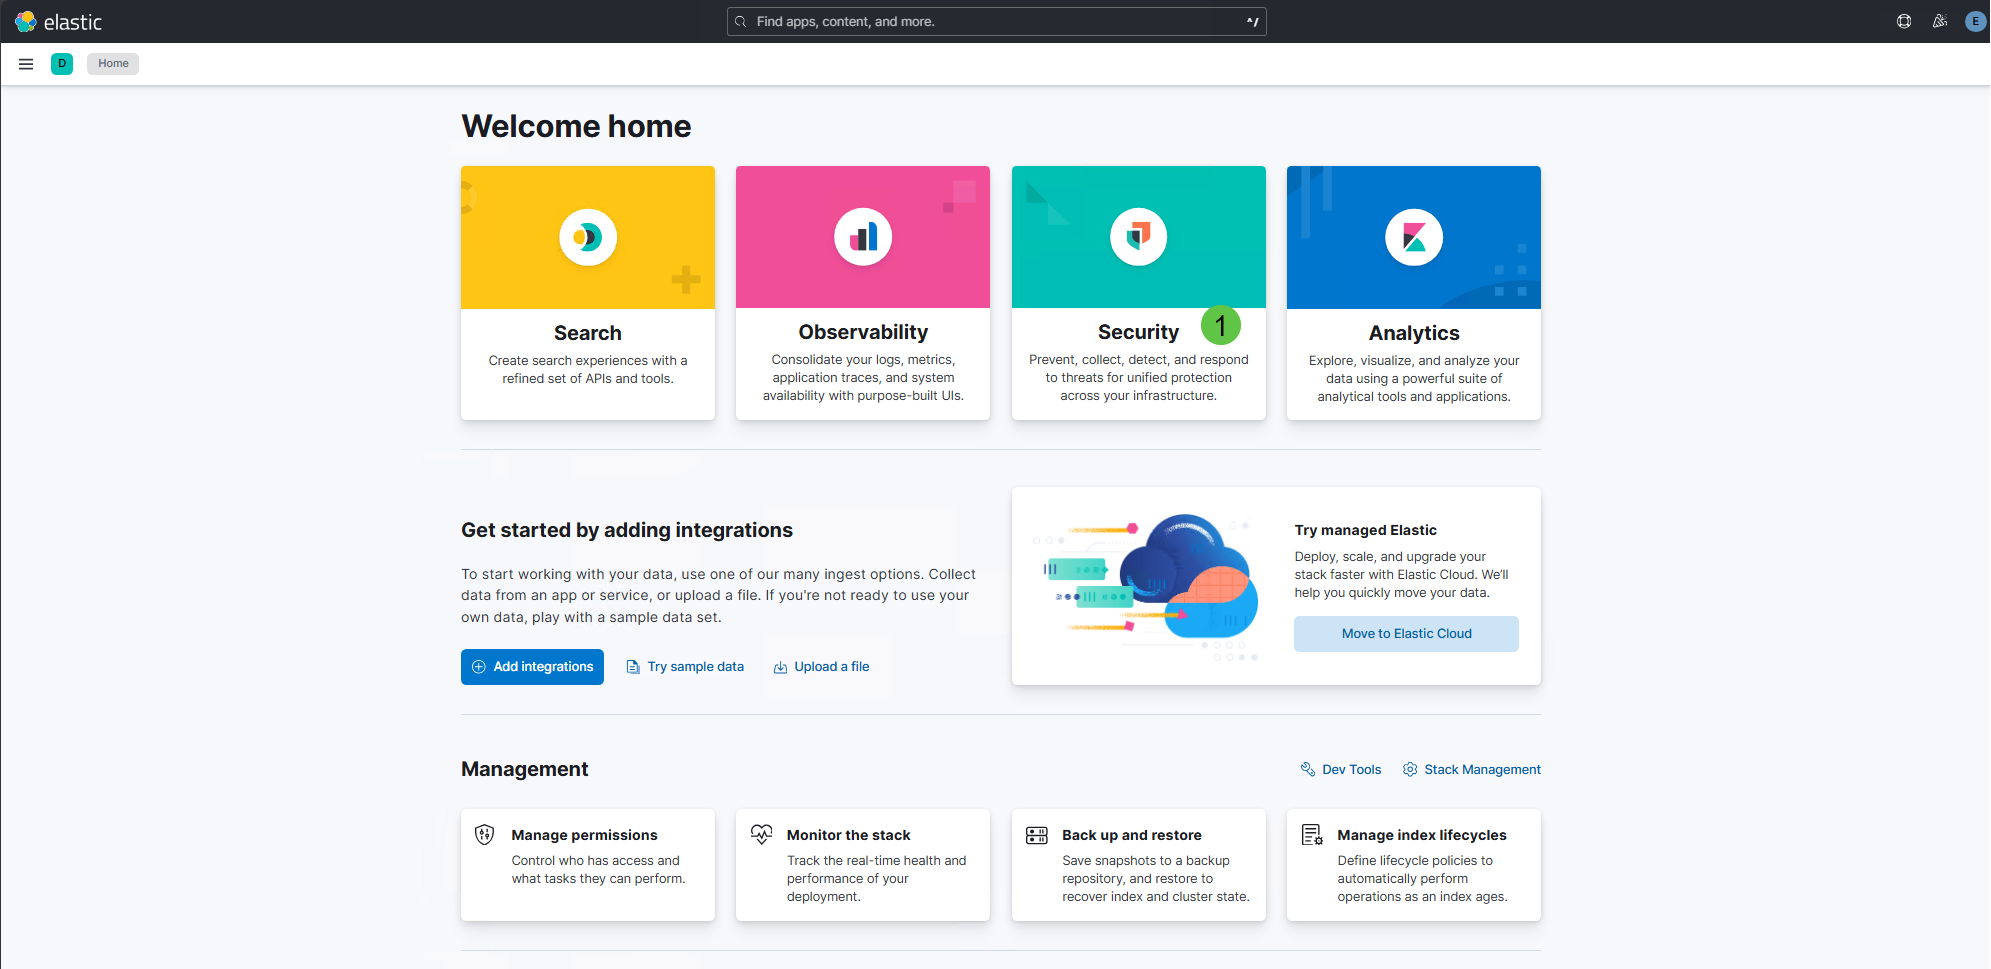
- Access the web console by navigating to https://<your server>:5601. The username is elastic, and the password is defined in the .env file for the ELK stack deployment.
- Select the Security panel on the home screen.
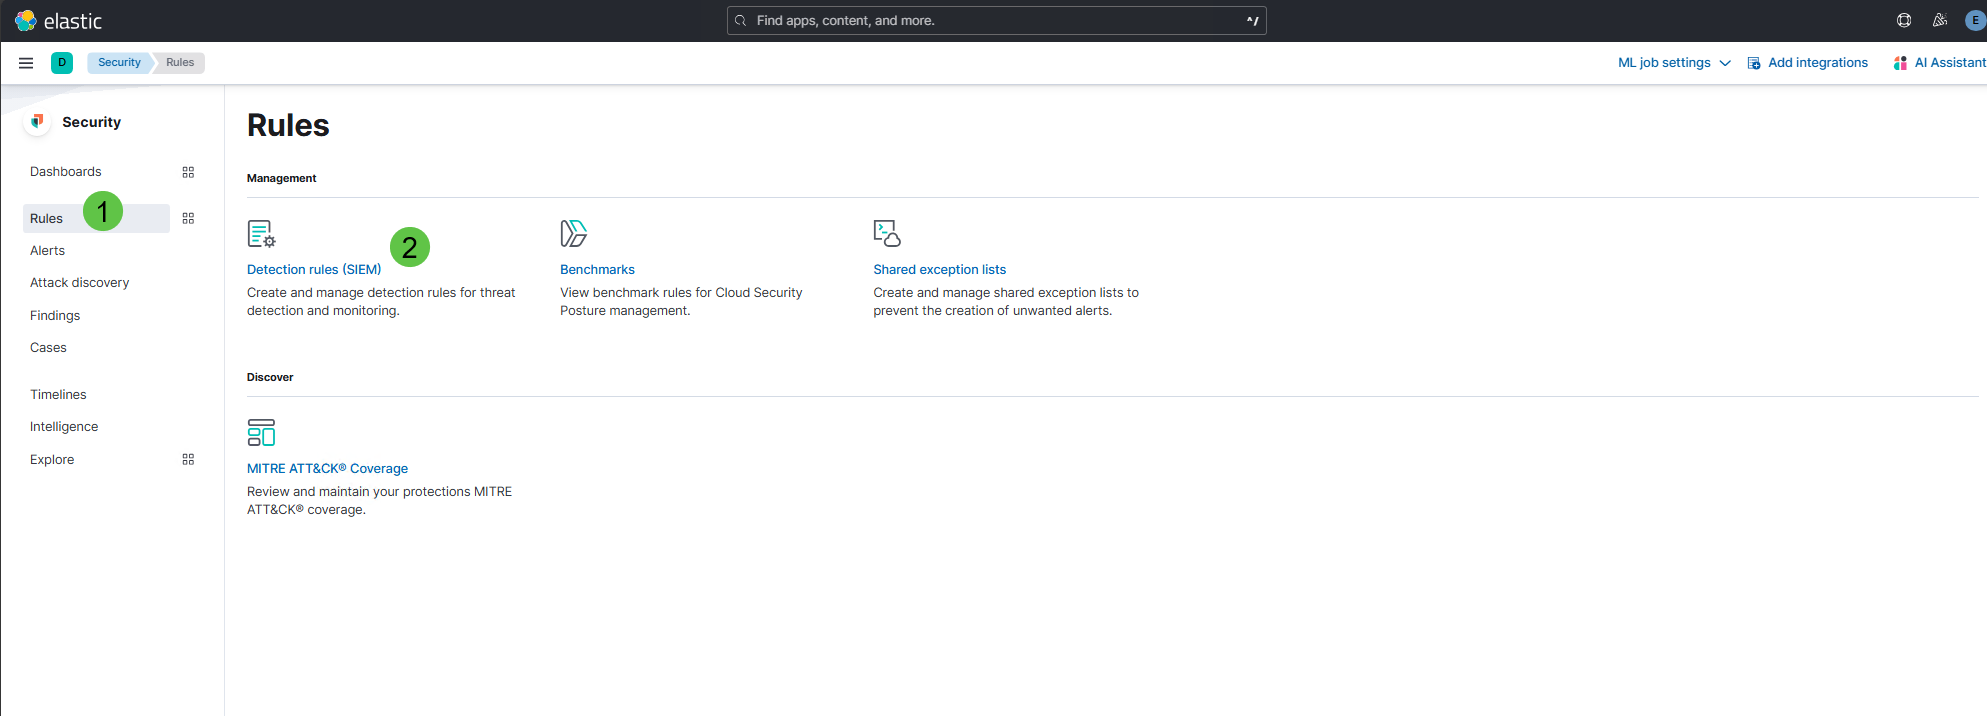
- Click Rules and select Detection rules (SIEM).
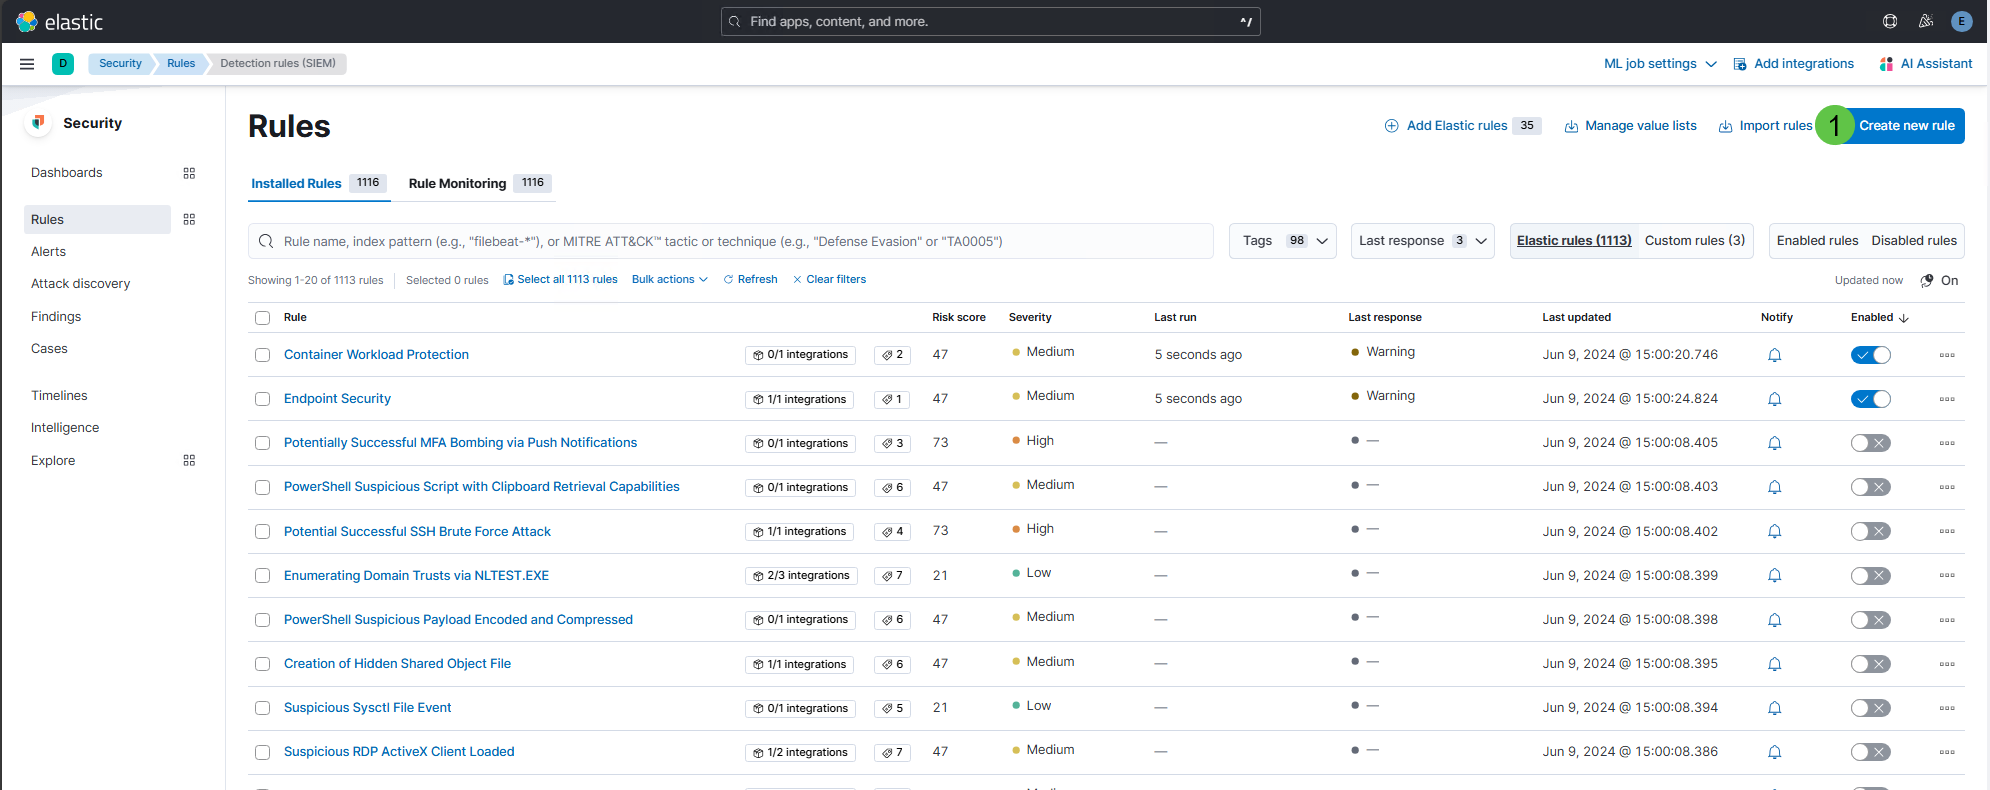
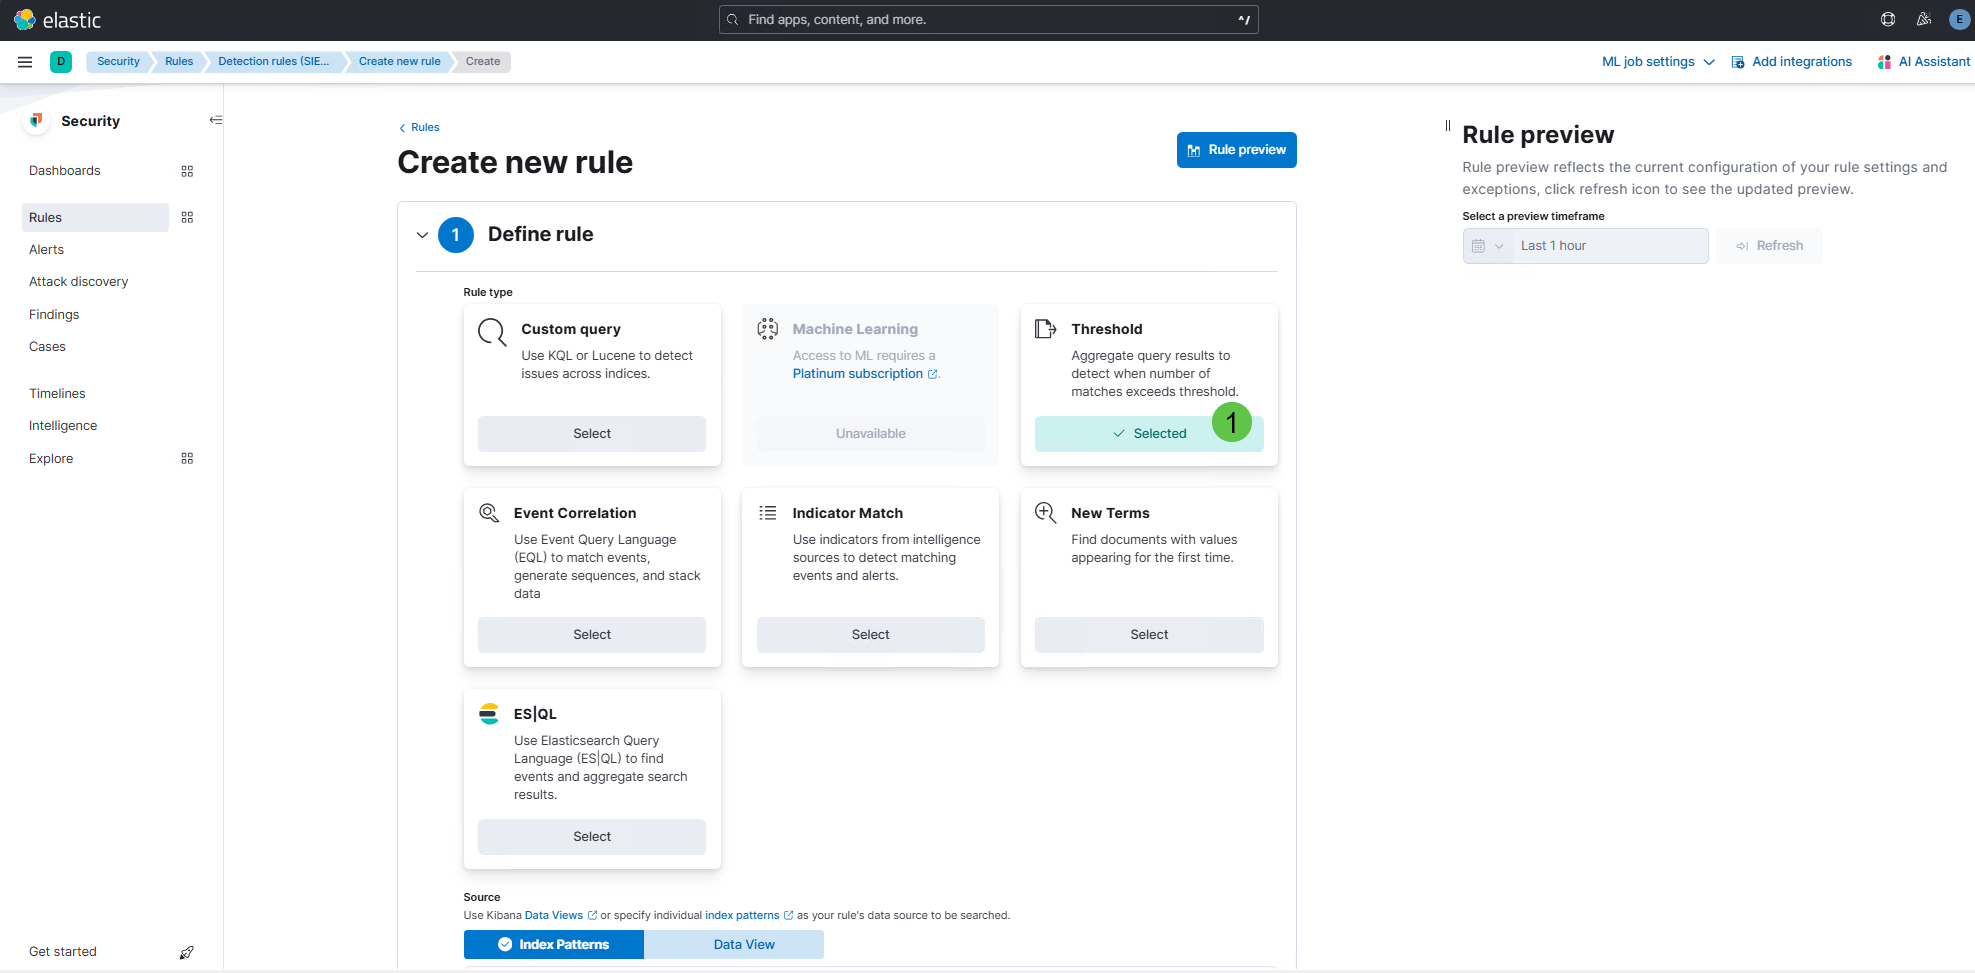
- Click the Create new rule button in the upper left area. The Create new rule page displays.
- Select the Threshold rule type.
- Scroll down the page and select Data View as the source.
Select veeam-vbr-* in the Data view field.
In the Custom query field type vbr_data.instanceId : ”40205”.
Enter sourcehost.keyword in Group by and set the Threshold value to 1.
Select @timestamp in Count and set the Unique values to 3.
Click on the Continue button.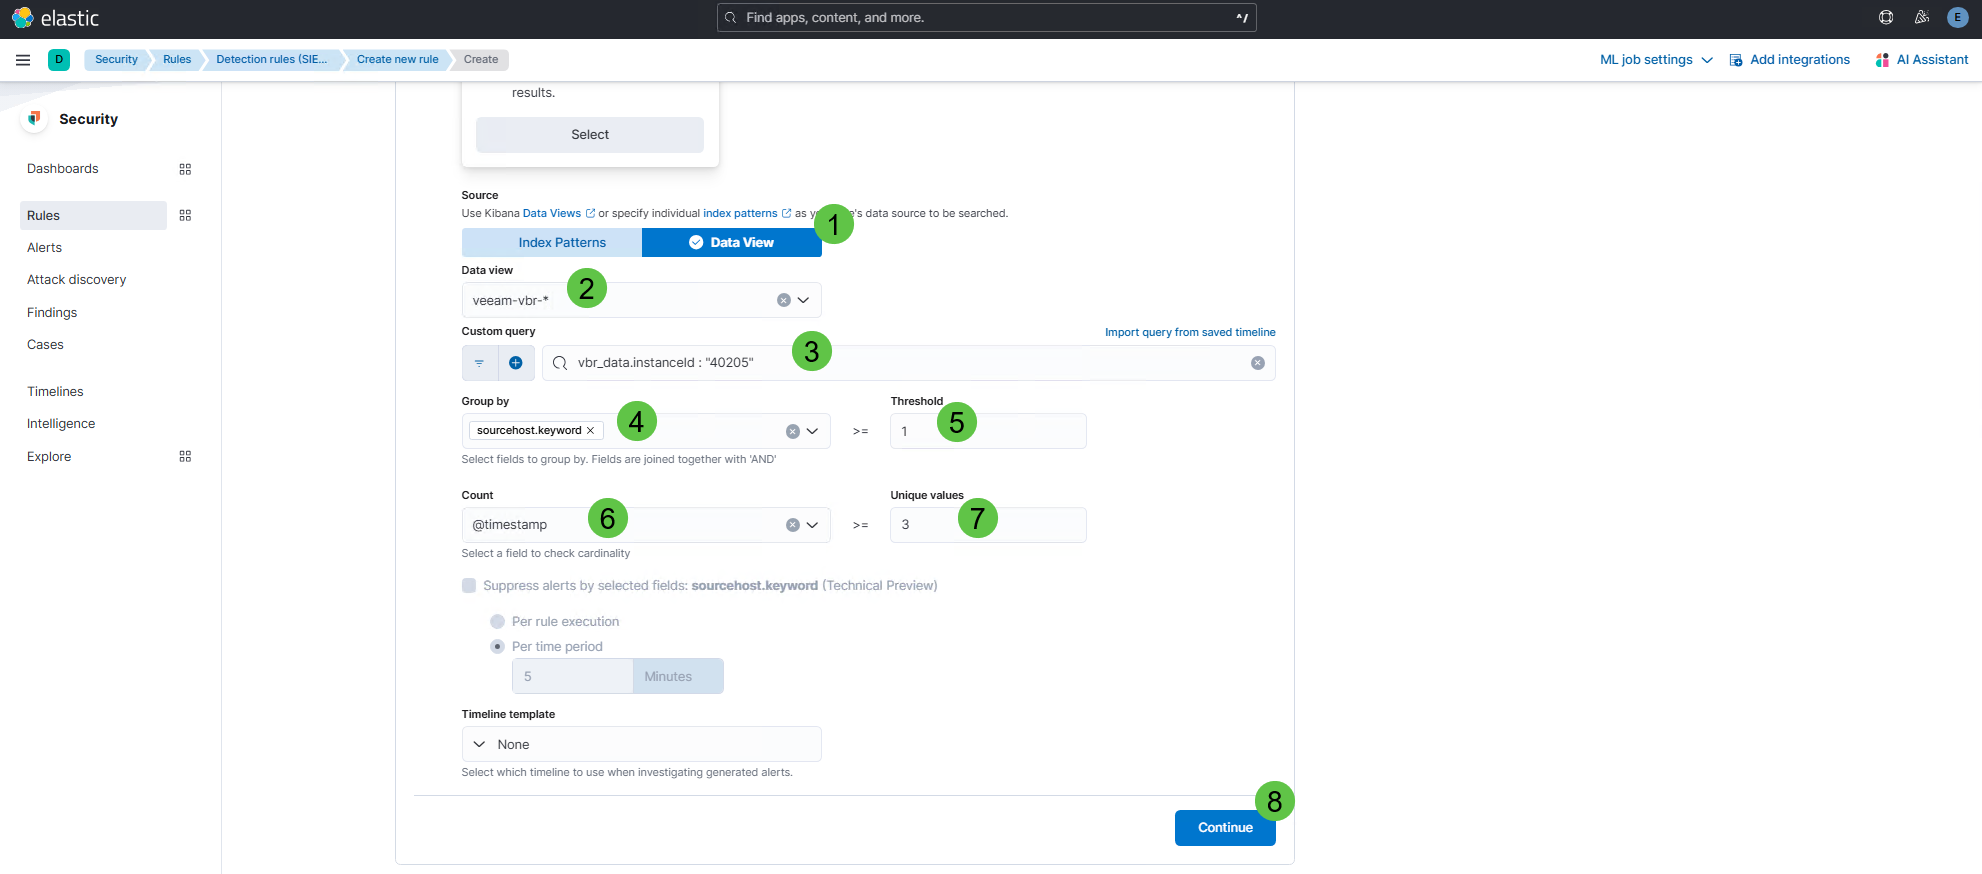
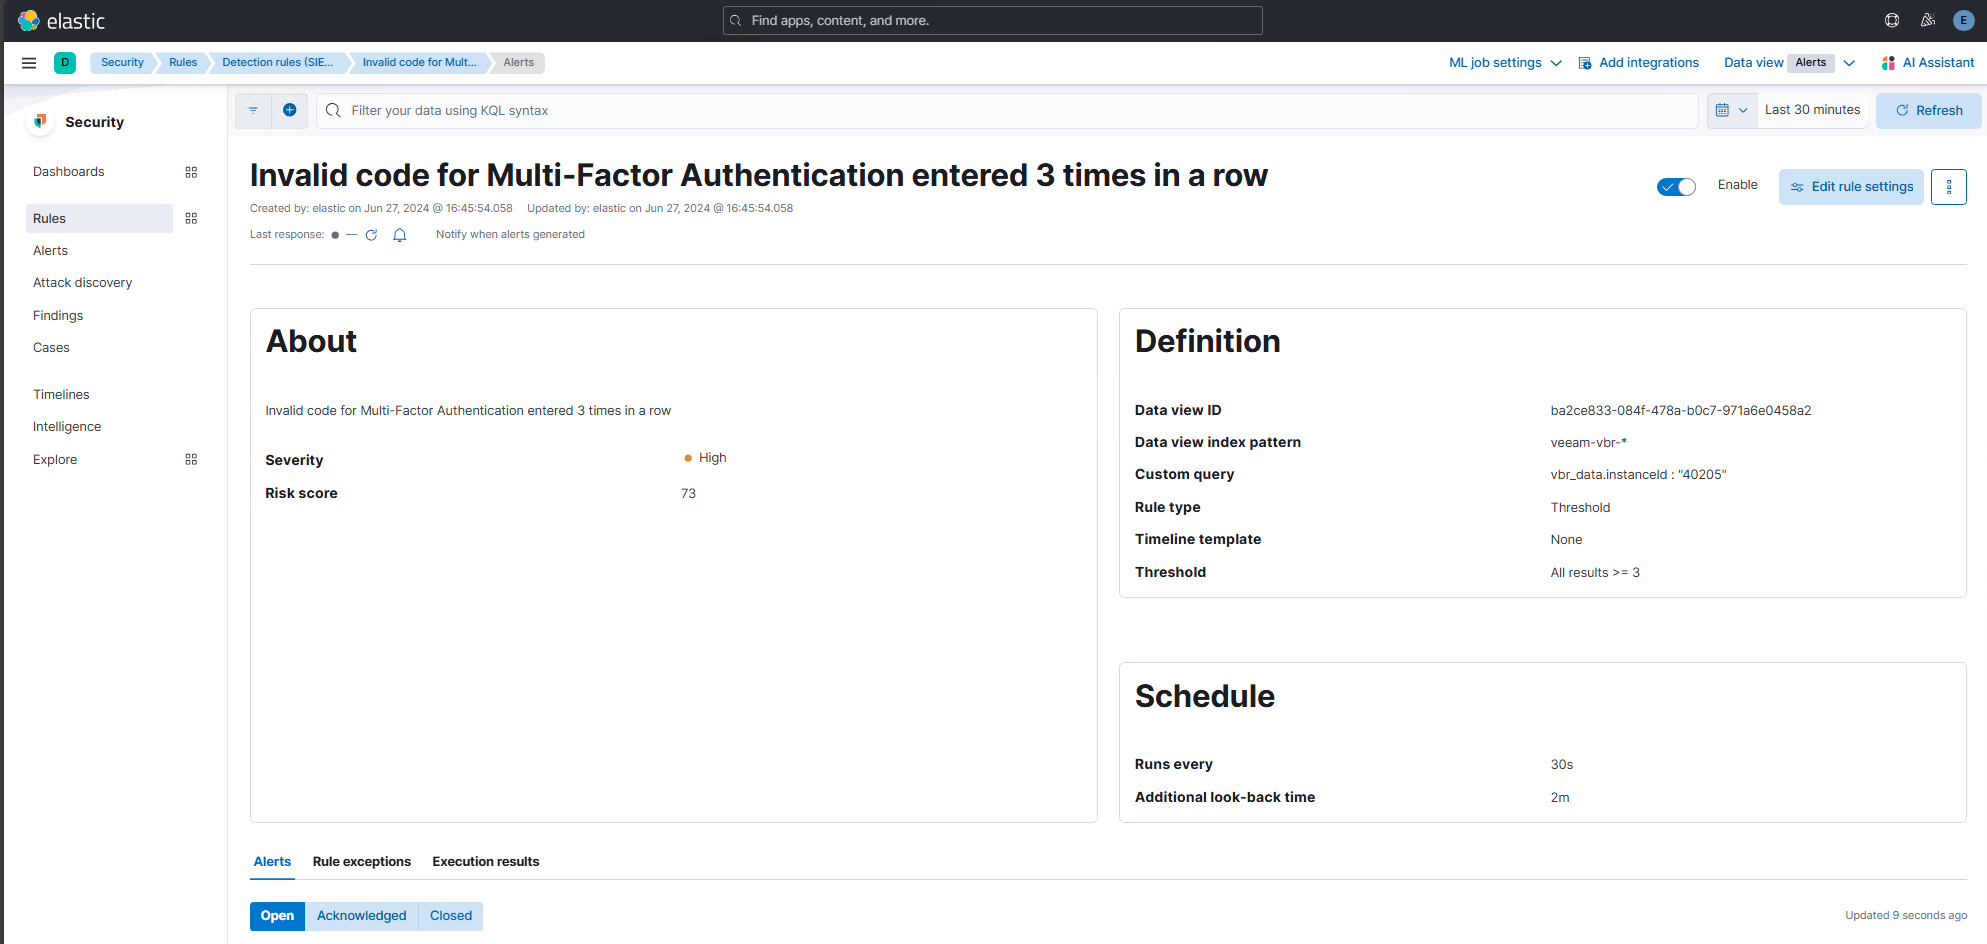
- On the About rule page, enter the entry Invalid Code for Multi-Factor Authentication entered 3 times in a row in the Name and Description field.
Select the Default Severity High and click on the Continue button.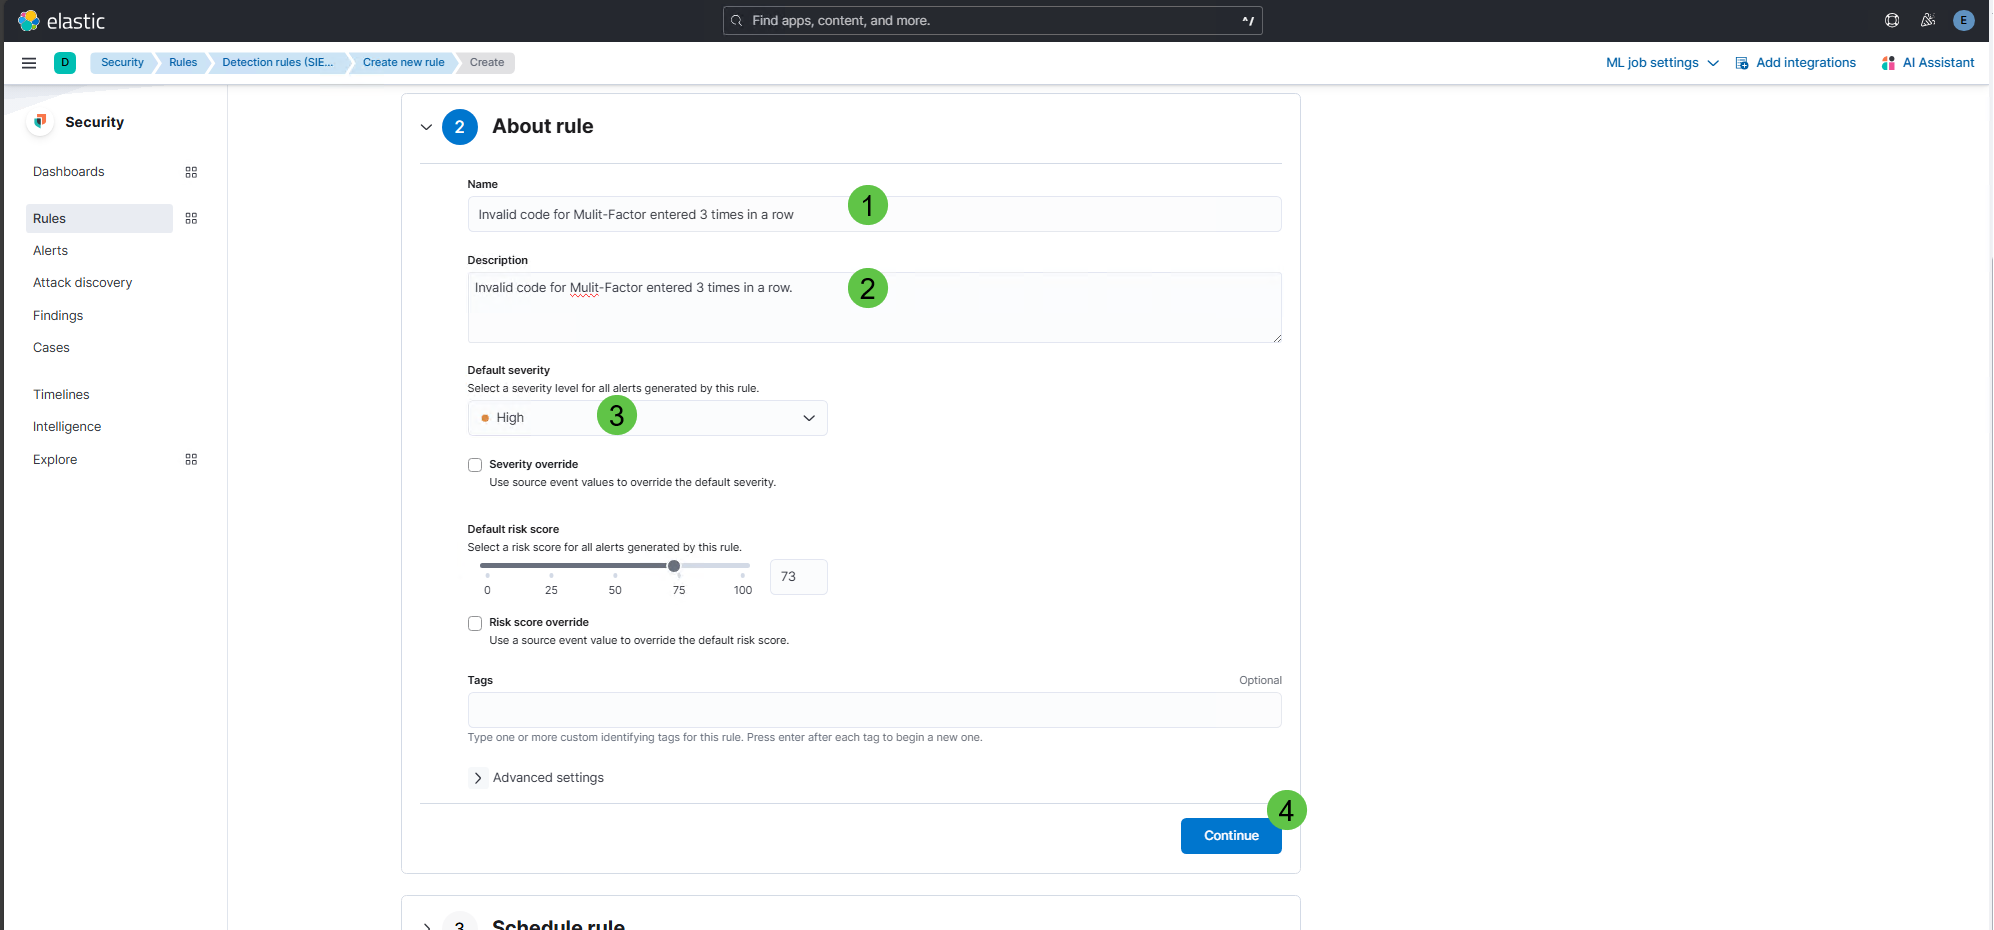
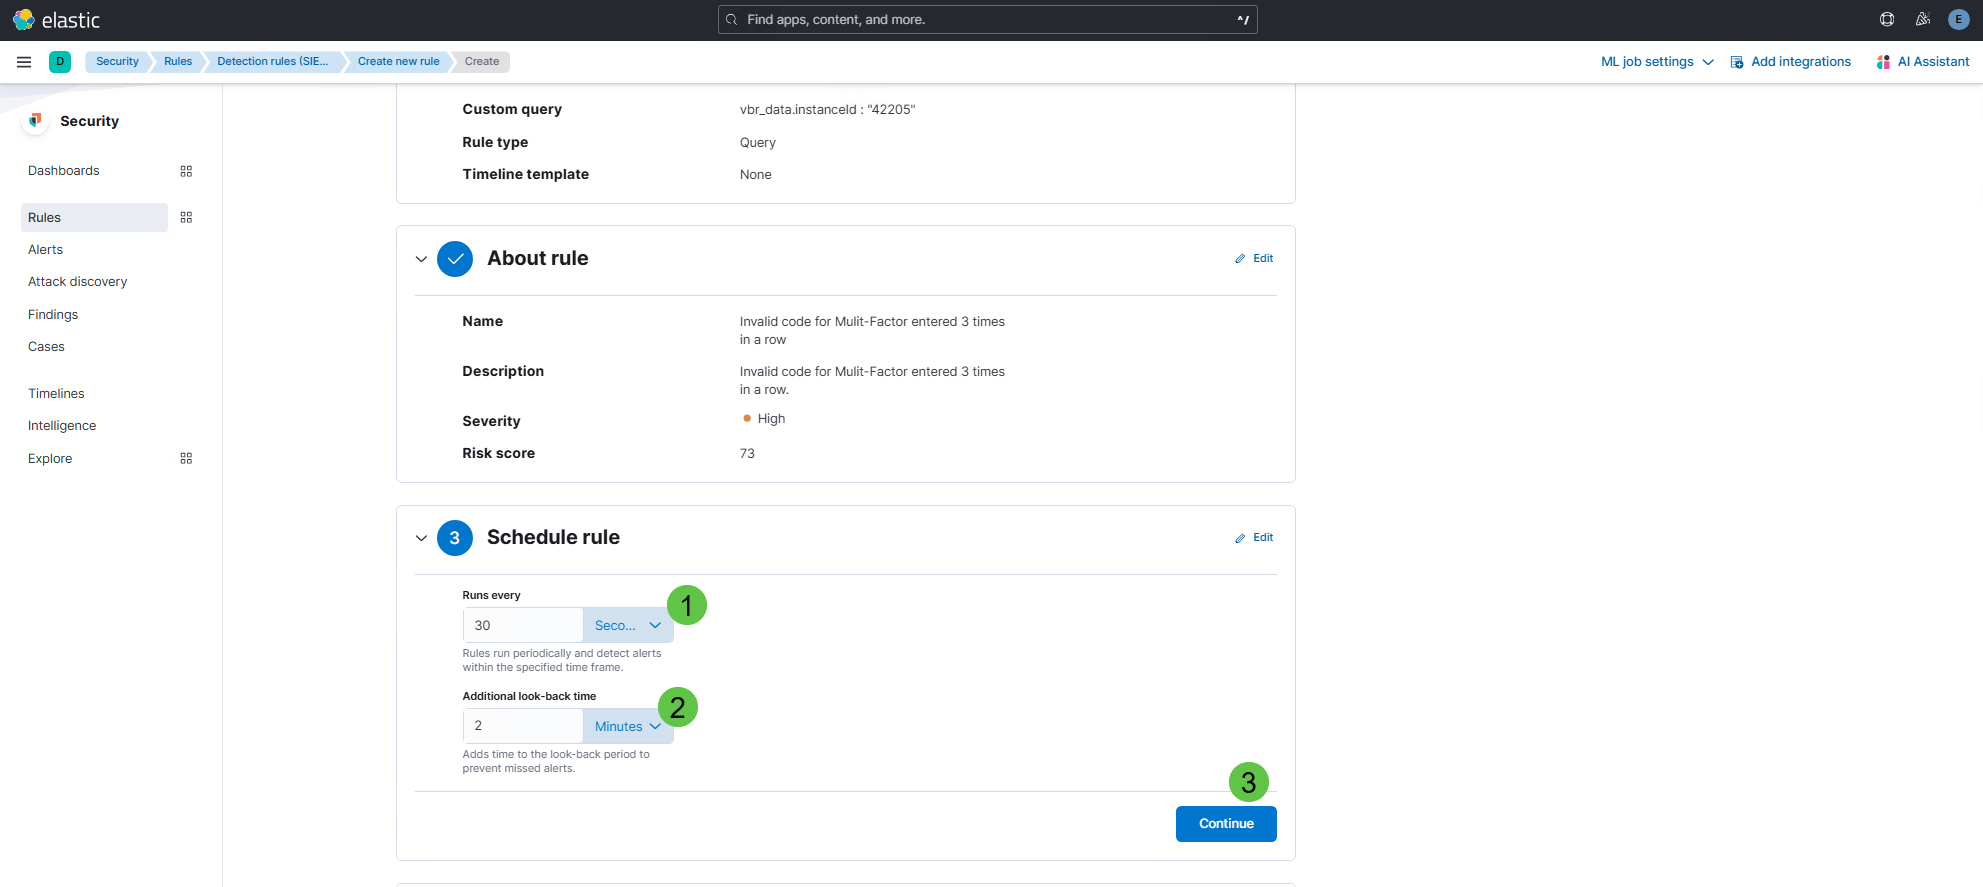
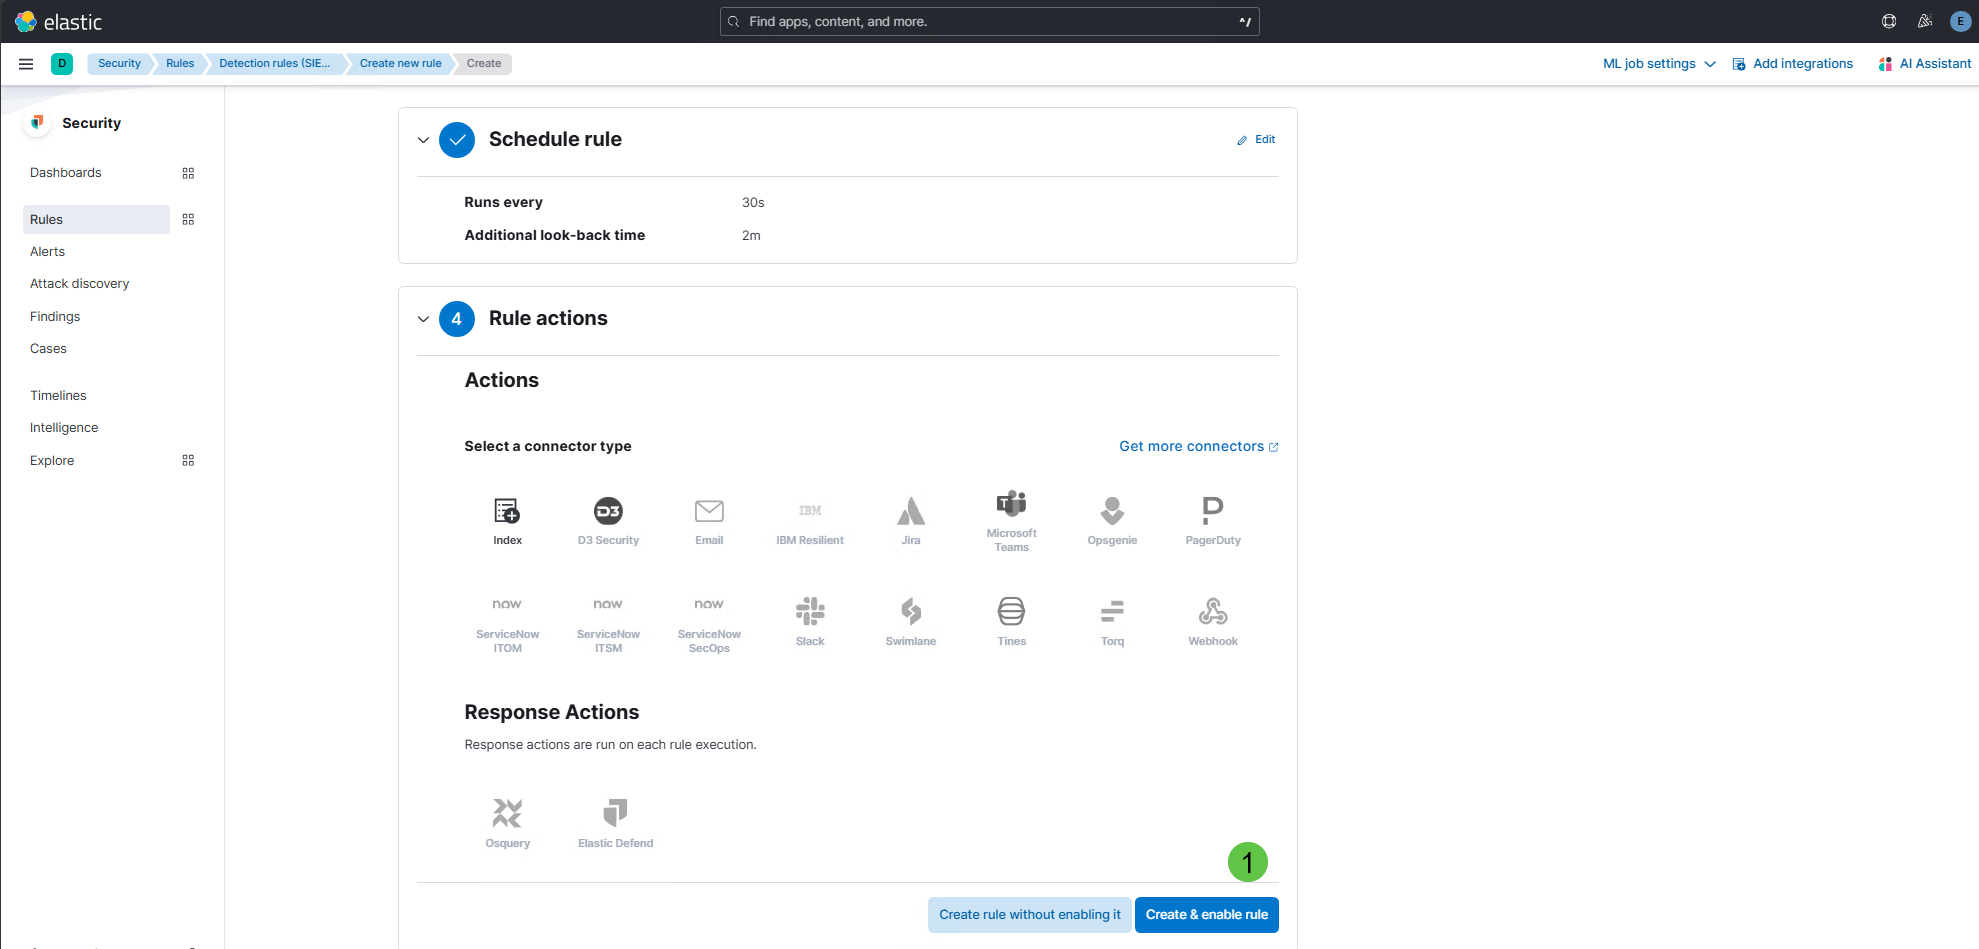
- Schedule the rule with the parameters Runs every 30 seconds and set the Additional look-back time to 2 minutes. Click on the Continue button.
- A licensed version can execute actions in various tools. We complete the process by clicking on the Create & enable rule button.
The rule gets displayed. There is a possibility of previewing the created rule.
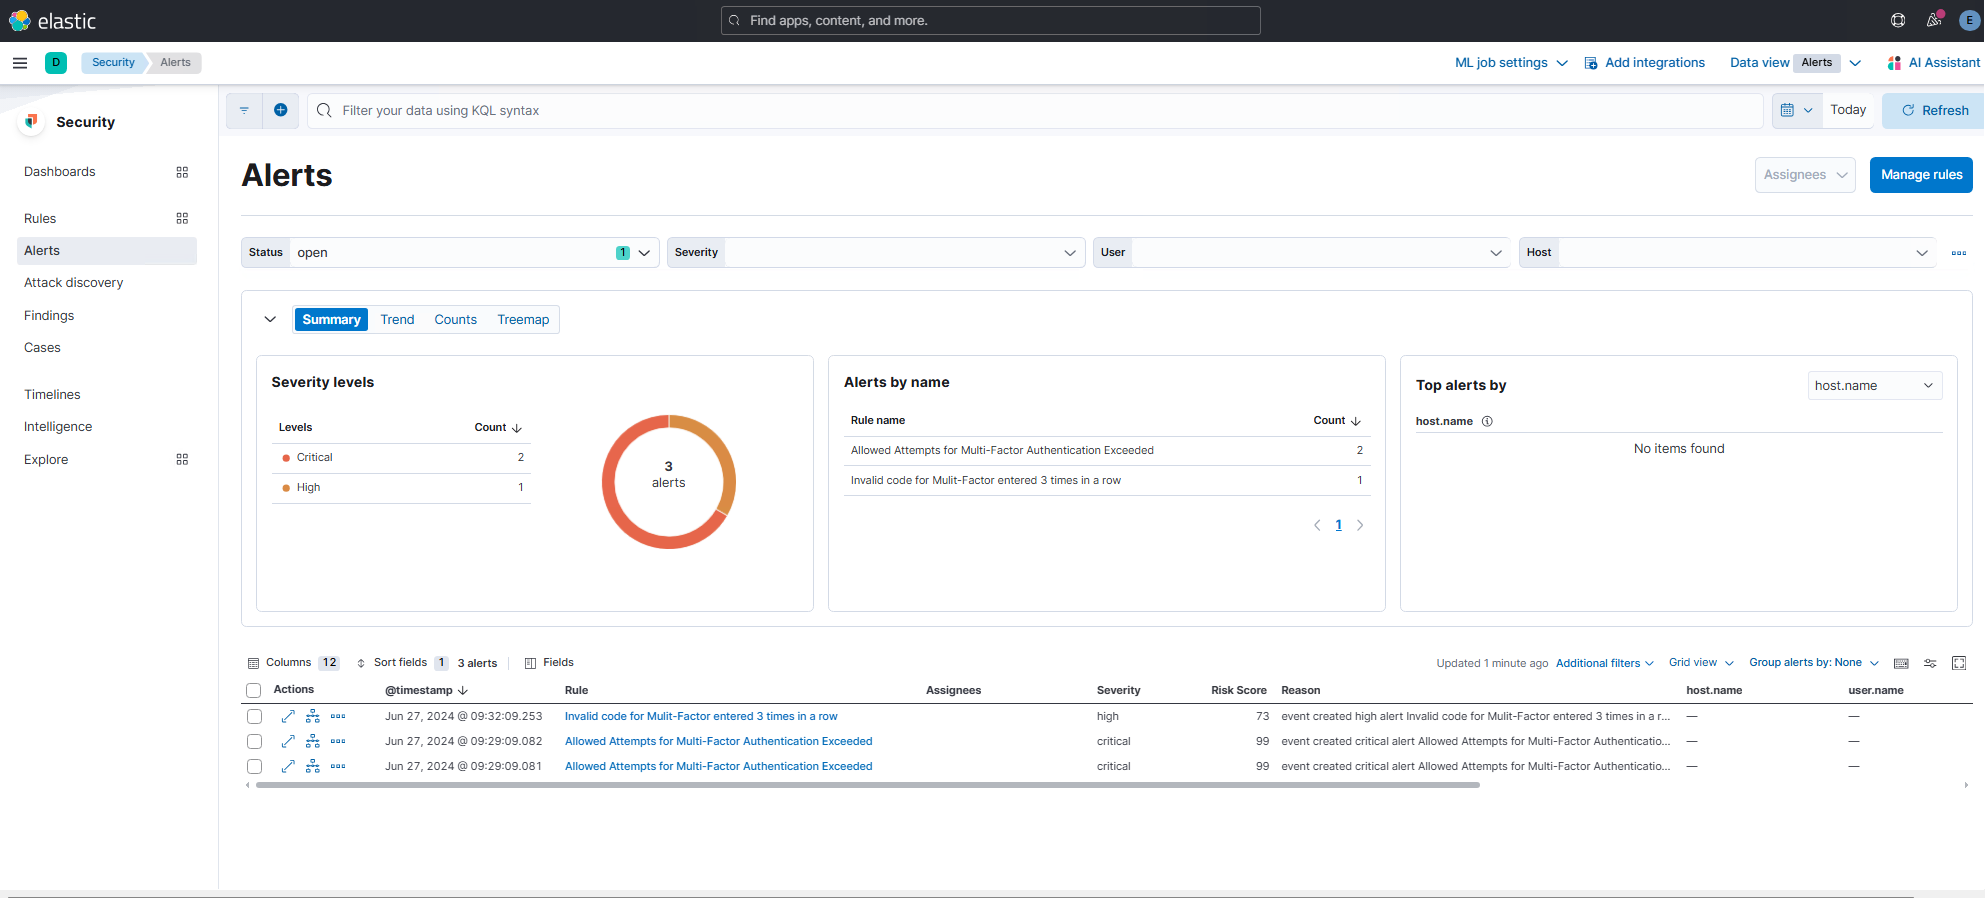
The Alerts page displays all detection Alerts. On the Alerts page, you can filter alerts, view trends for alerts, change their status, add alerts to cases, and start investigating and analyzing alerts.
Detection rules and updated Dashboards can be found here. The rules can be easily imported into Elastic.
What’s Next?
This topic offers many possibilities to write about in the future:
- Create more rules.
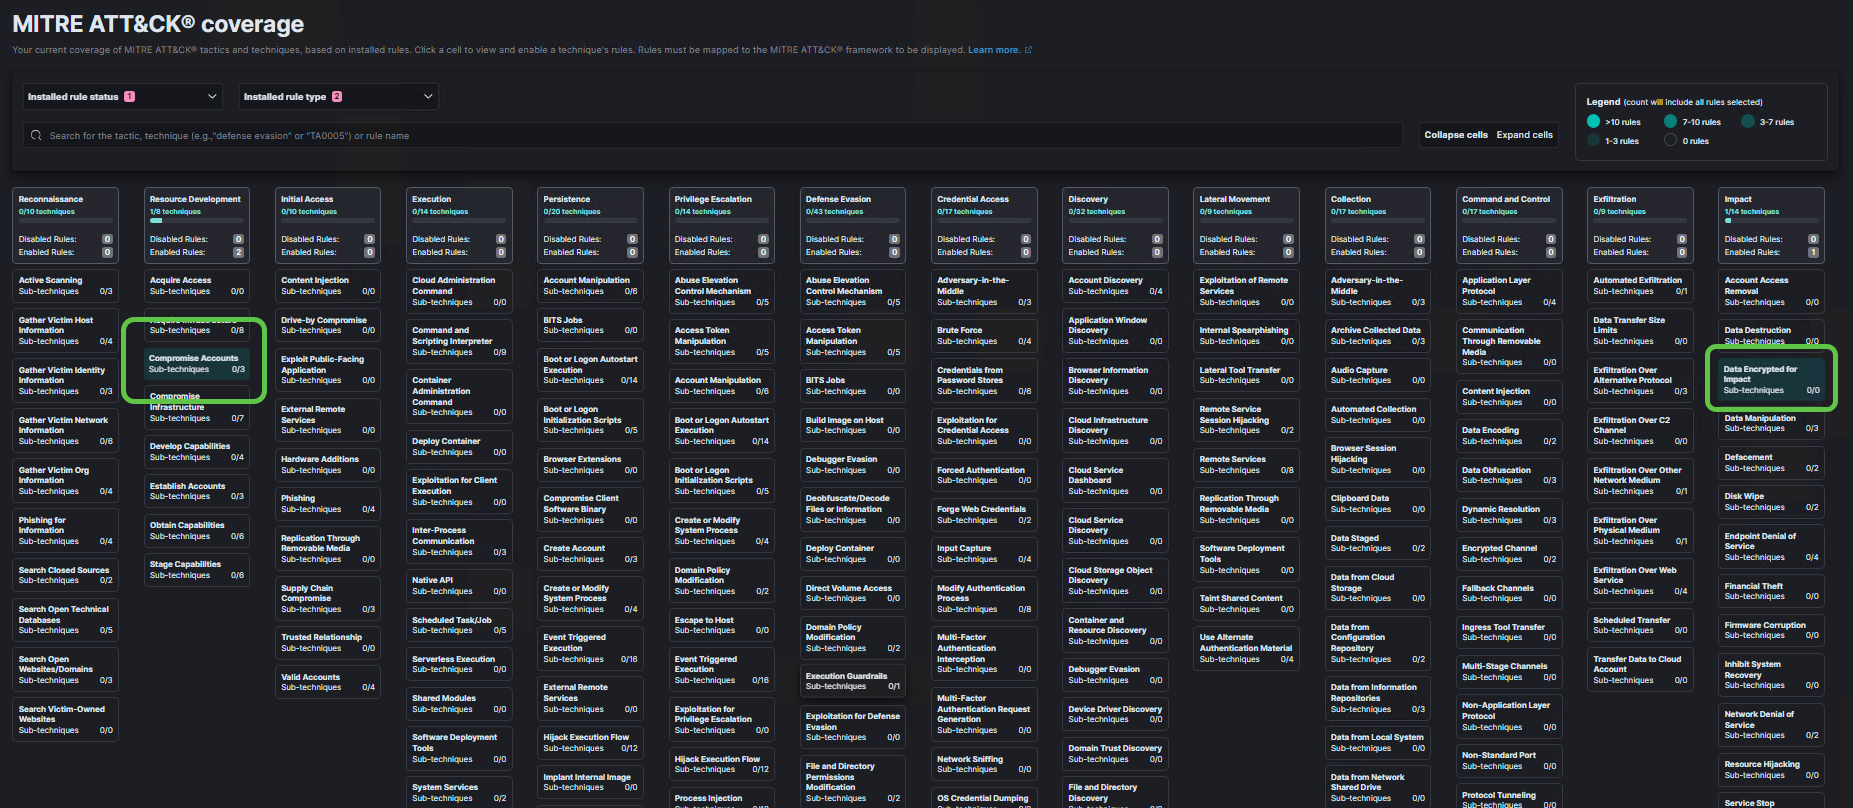
- Assign the rules to the MITRE ATT&CK coverage page.
- Start extracting & visualizing Veeam ONE Syslog messages.
- Bring in automation.
- Optimizations for the Logstash container configuration.
That’s all! As always, Feedback is welcome!
Cheers
Steve