Hello everyone &
I share with the community the guide to the installation of Splunk Enterprise 9.2.1 on the Windwos platform and the related installation and configuration of the powerful new Veeam Splunk App.
- Veeam App for Splunk key points
Strategic Convergence: combines veeam's backup solutions with the powerful Splunk data analysis tool, offering an integrated approach to data analysis.
Real-time Visibility: Allows users to monitor the status of jobs, provides real-time visibility into backup and restore operations.
Performance Optimization: Through in-depth analysis, help identify performance bottlenecks and areas for optimization in backup operations.
Enhanced Security: Includes advanced features of real-time alerts of critical events and audit capabilities to ensure compliance with current industry rules.
Empowered Business Continuity: It enables organizations to proactively identify possible risks, optimize pi resetting processes and reduce downtime is a catalyst for increasing and improving business continuity.
In a nutshell, Veeam App for Splunk combines the strengths of Veeam and Splunk to deliver optimized performance, visibility, security, improved business continuity of service for backup and recovery operations.
- If you don't have the Splunk infrastructure, first step get free trial Splunk Enterprise 9.2.1 for Windows version.
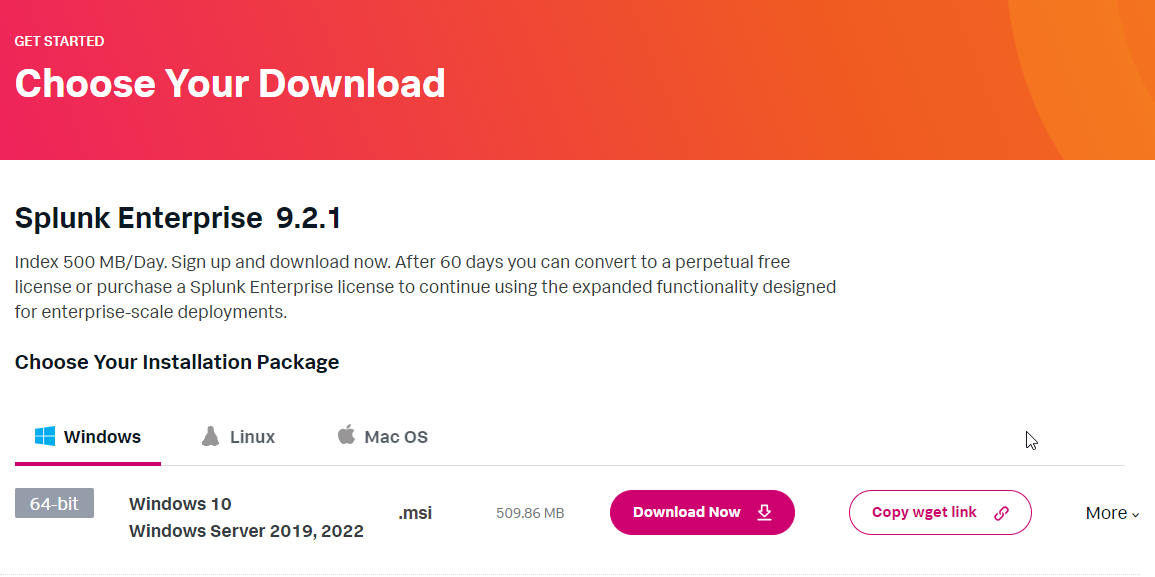
- Splunk reference guide
Deploy Splunk Enterprise on Windows - Splunk Documentation
Install on Windows - Splunk Documentation
- We proceed to install the Splunk Enterprise 9.2.1 product supported by the Veeam App for splunk version 1.0.

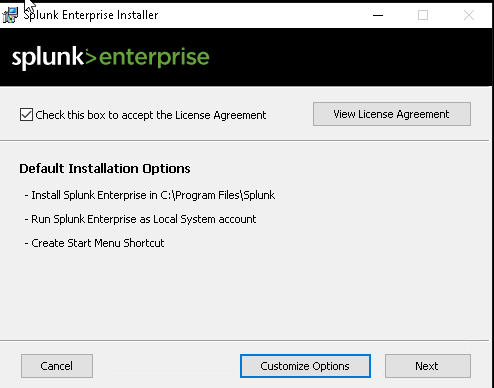
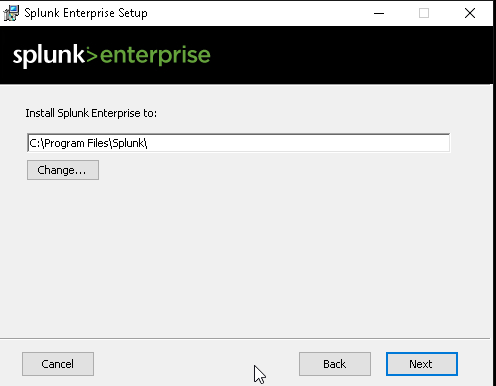
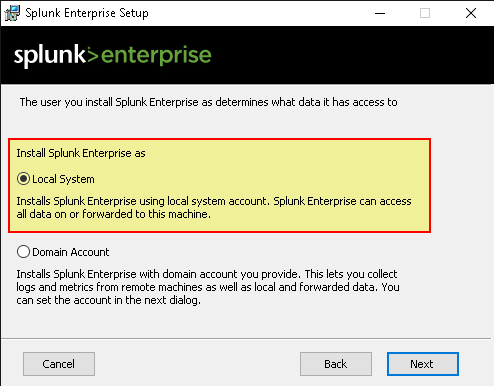
- It is possible to integrate Splunk also in Active Directory, for safety I recommend to untilize the “Local System”- mode.
- Generate a robust passphrase
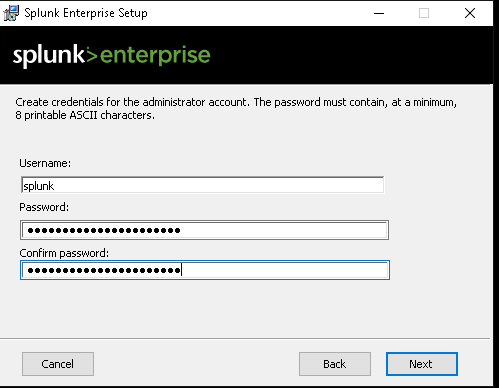
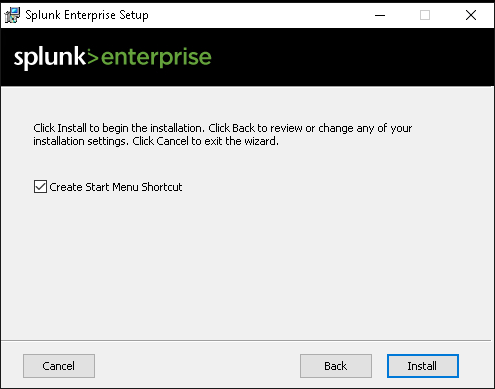
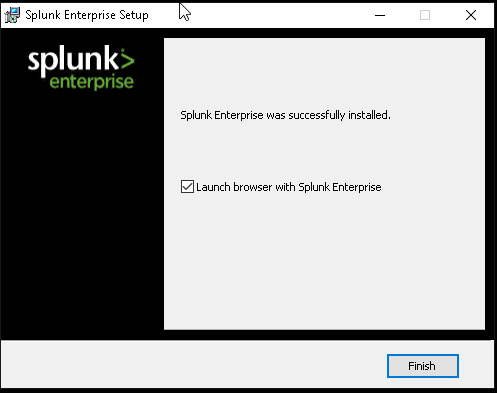
- We launch the Splunk Ent administrative web console

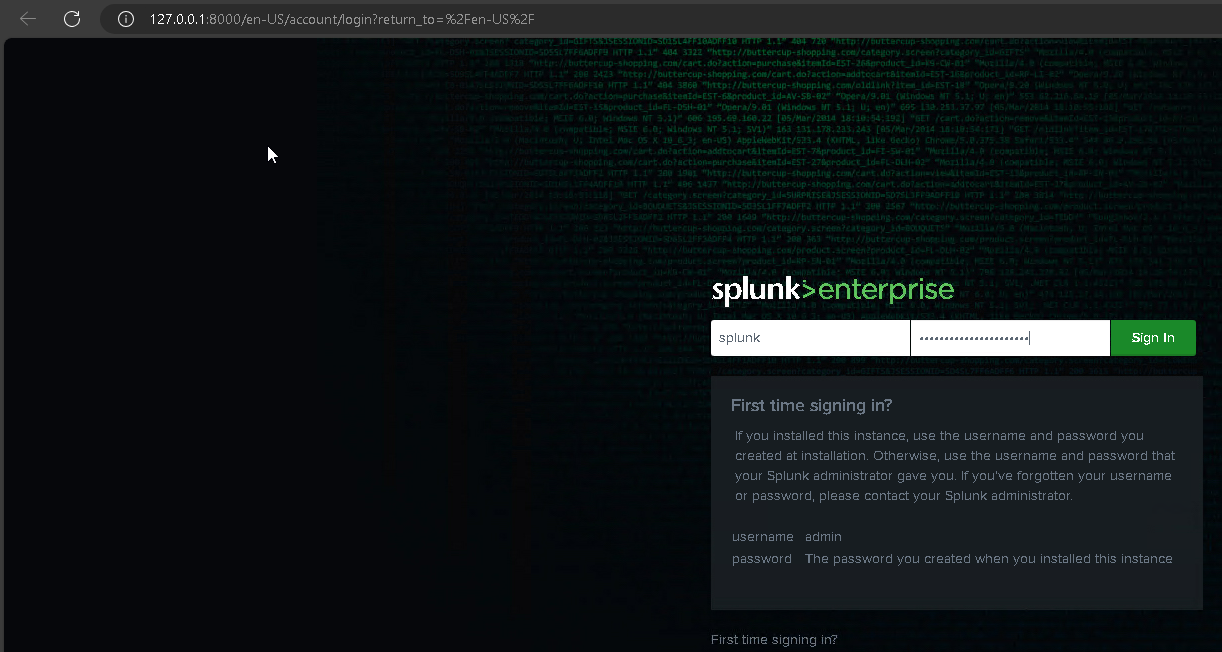
- Basic verification of installation
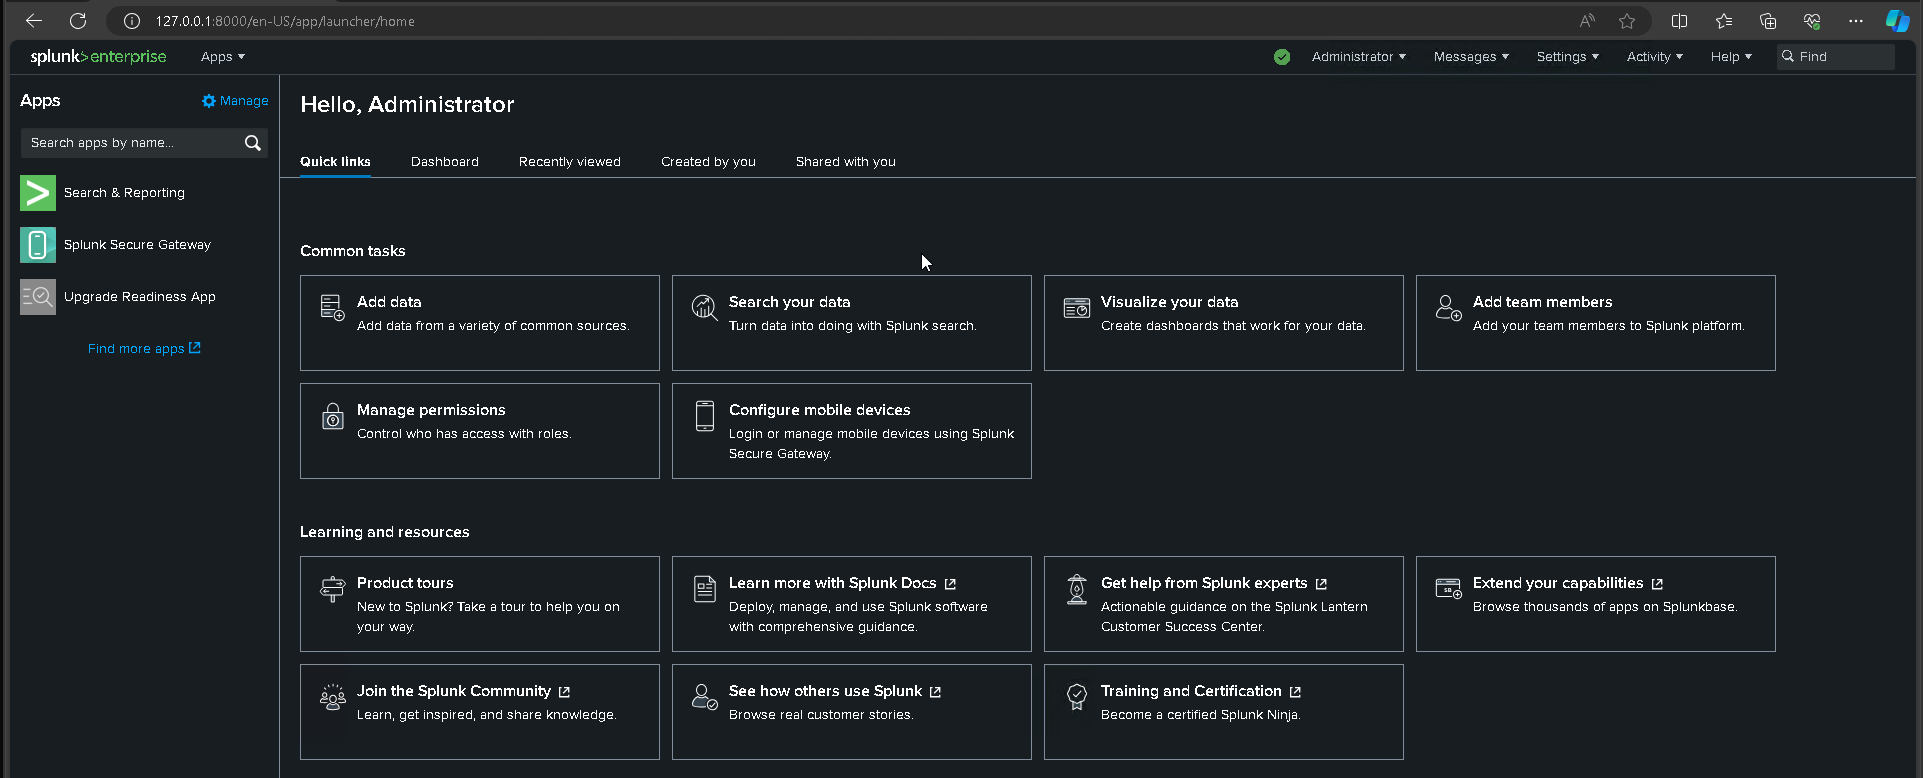
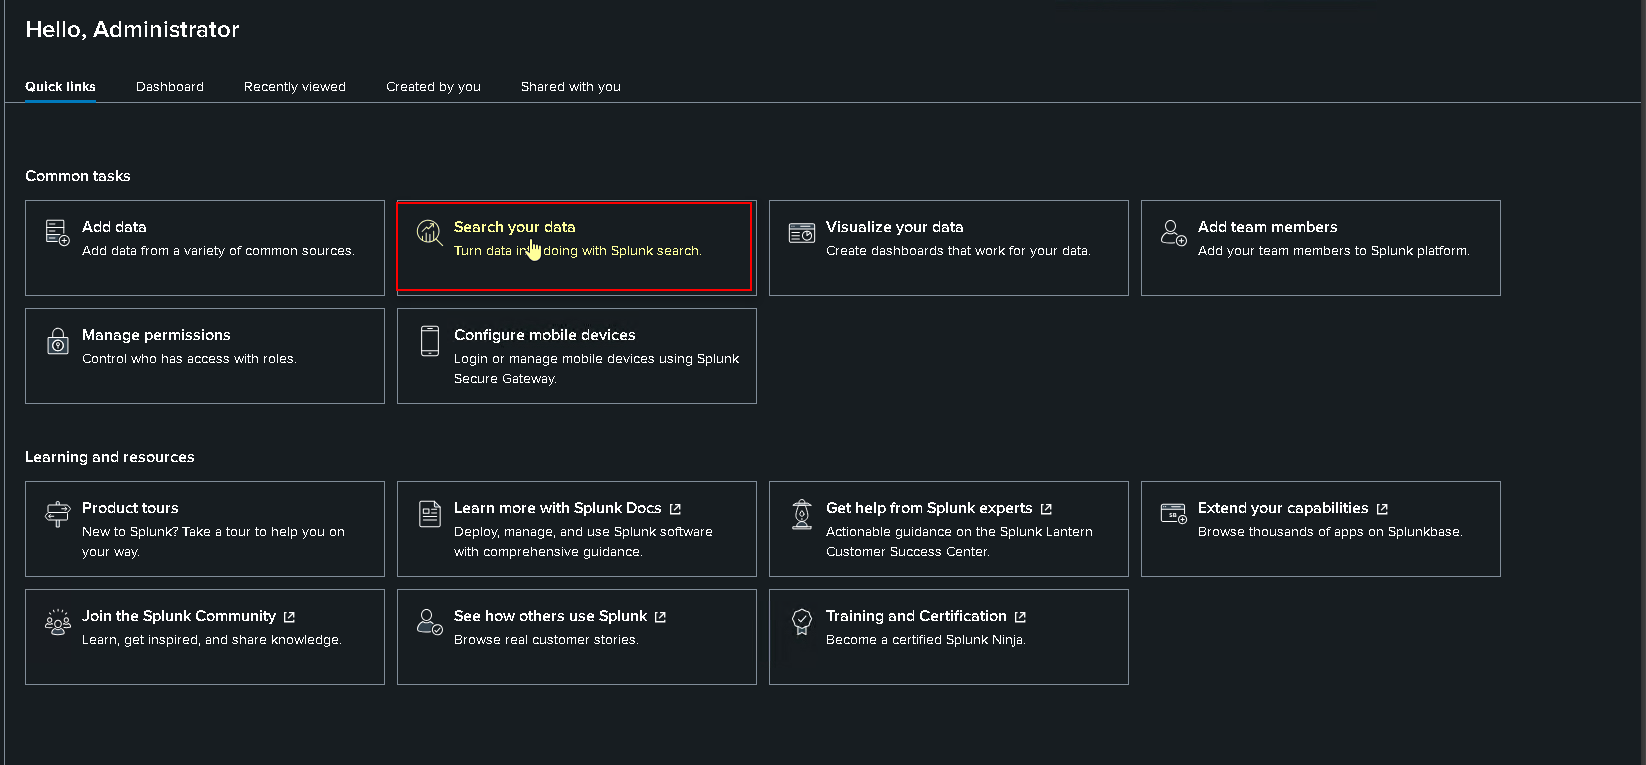
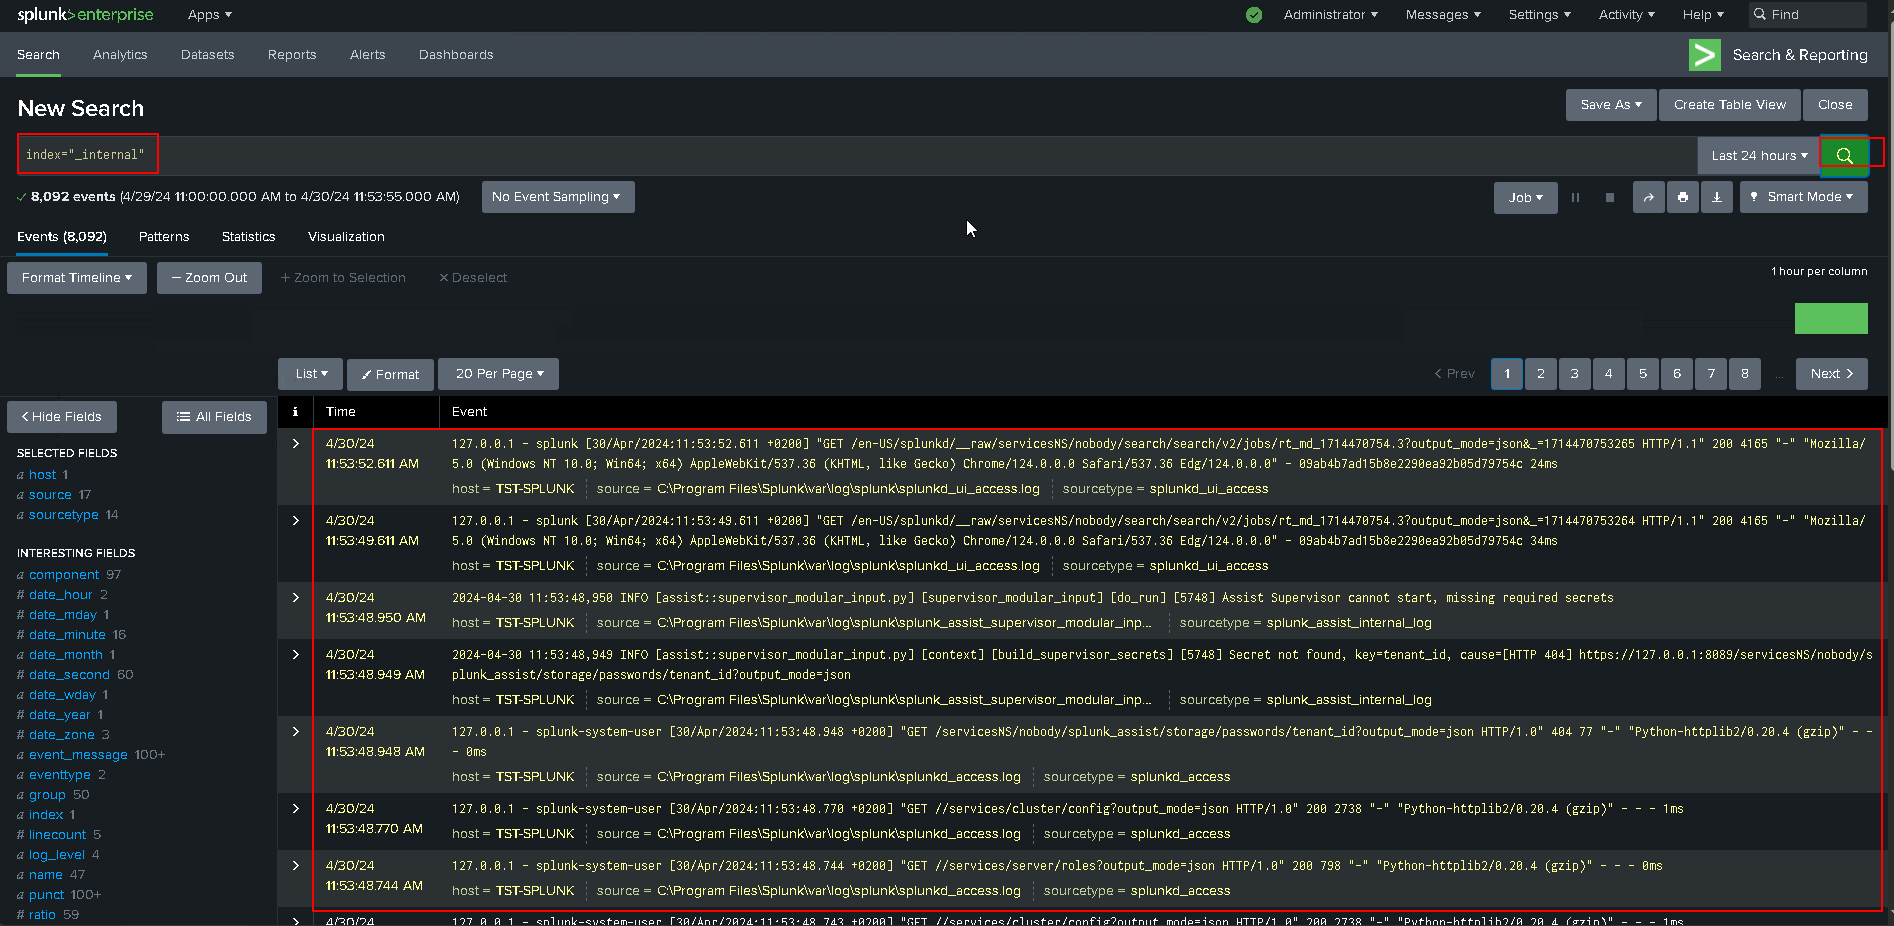
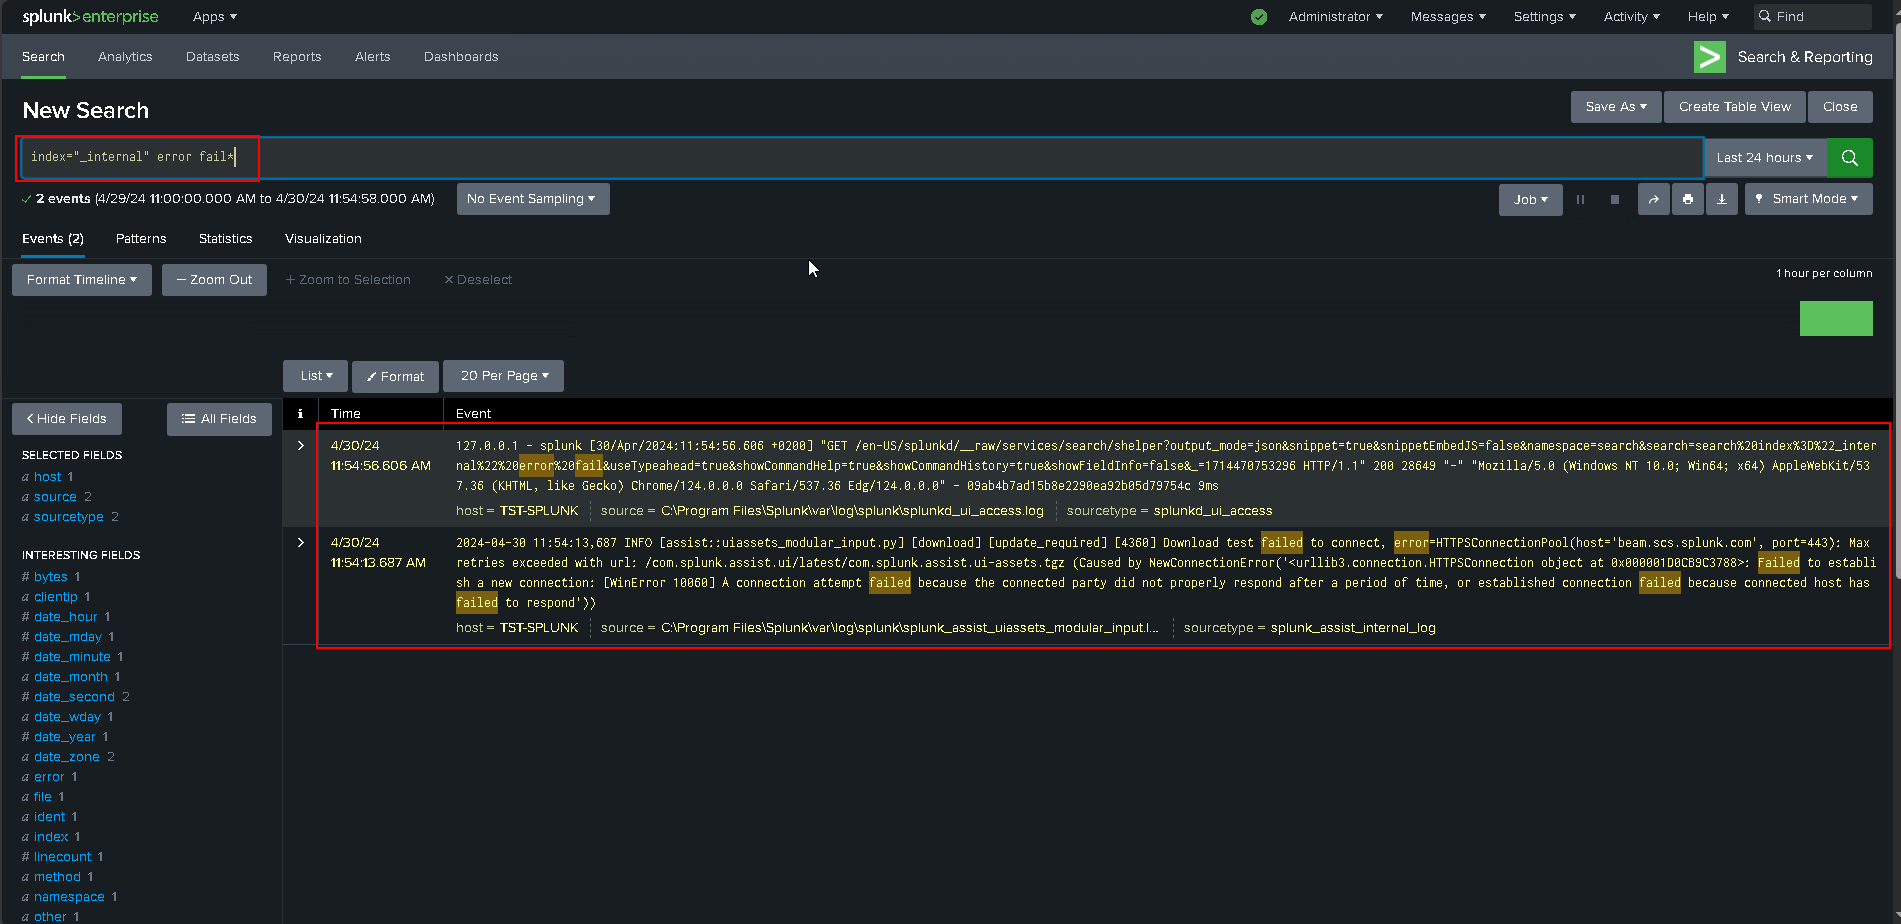
- Let's proceed with the installation of Veeam App for Splunk
About Veeam App for Splunk - Veeam App for Splunk
- About Veeam App for Splunk
Veeam App for Splunk is a Splunk extension that allows you to monitor the health and security status of your Veeam backup infrastructure.
- Built-in dashboards to monitor job statuses and security events on a daily basis
- Built-in reports and alerts
- Severity level management for events and alerts
- Multiple Veeam Backup & Replication servers support
- Multiple data source locations support
- Role-based permissions for locations
- App configuration backup
- Supported Platform
Supported Platforms - Veeam App for Splunk
Splunk Enterprise 9.1.0 and later
Splunk Cloud Platform 9.1.2308 and late
- Licensing
Licensing - Veeam App for Splunk
Veeam App for Splunk is provided free of charge. For Veeam Backup & Replication, you must have a Veeam Data Platform Advanced or Premium license that includes syslog event forwarding support.
- Installing App form file
Installing App from File - Veeam App for Splunk
- To install Veeam App for Splunk from a file, perform the following steps:
Go to Veeam App for Splunk | Splunkbase
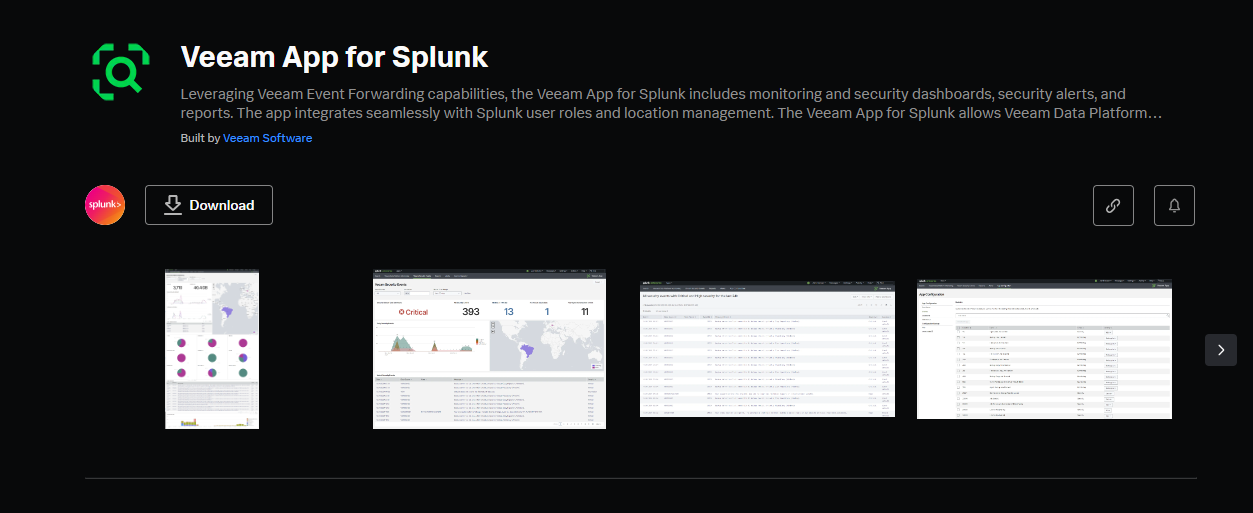
- Download the installation package from Splunkbase.

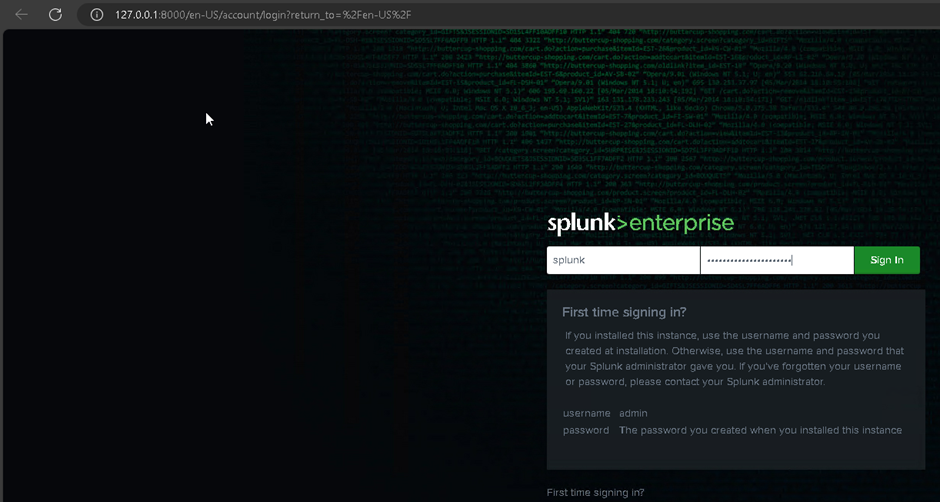
- Log in to Splunk Web.
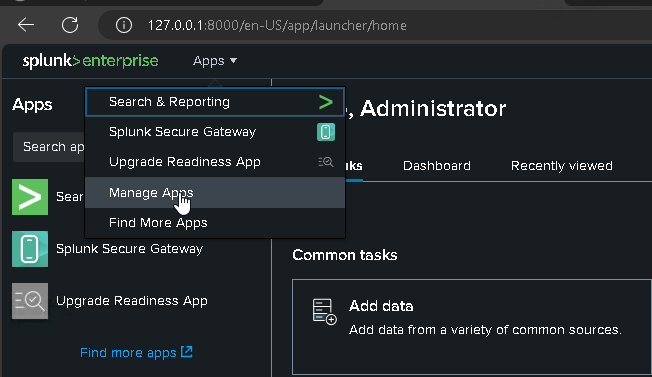
- In the Splunk bar, click Apps and select Manage Apps. If you use the Splunk home page, click Manage in the Apps column.
- For Splunk Enterprise, click Install app from file and select the installation package.

- Click Upload App
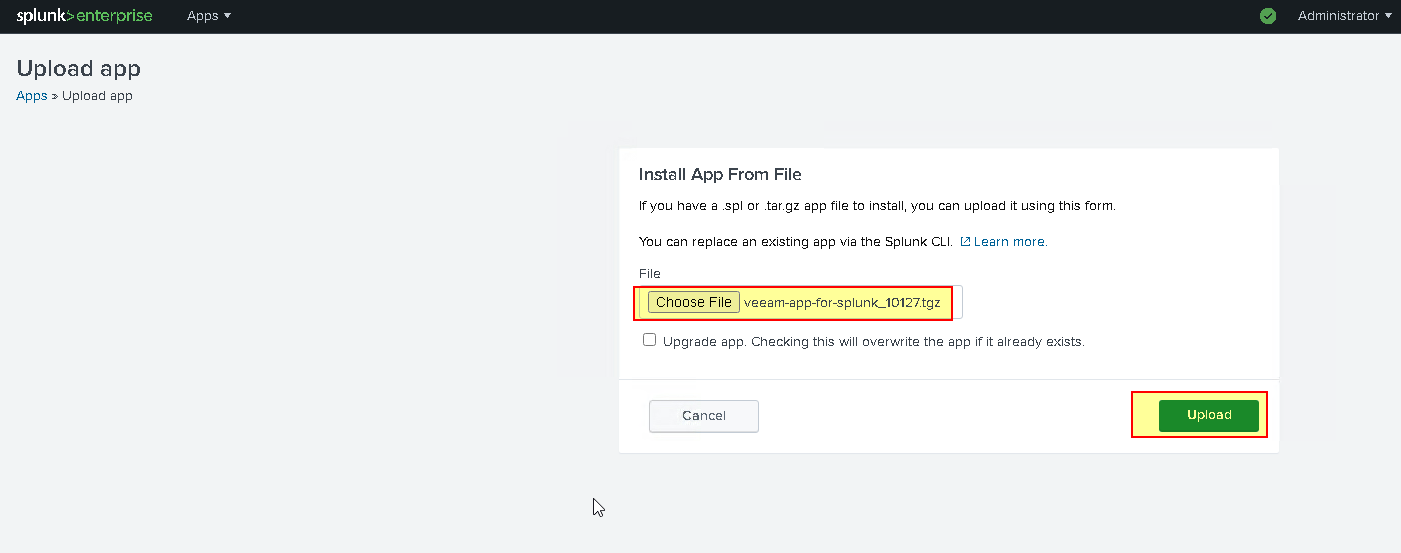

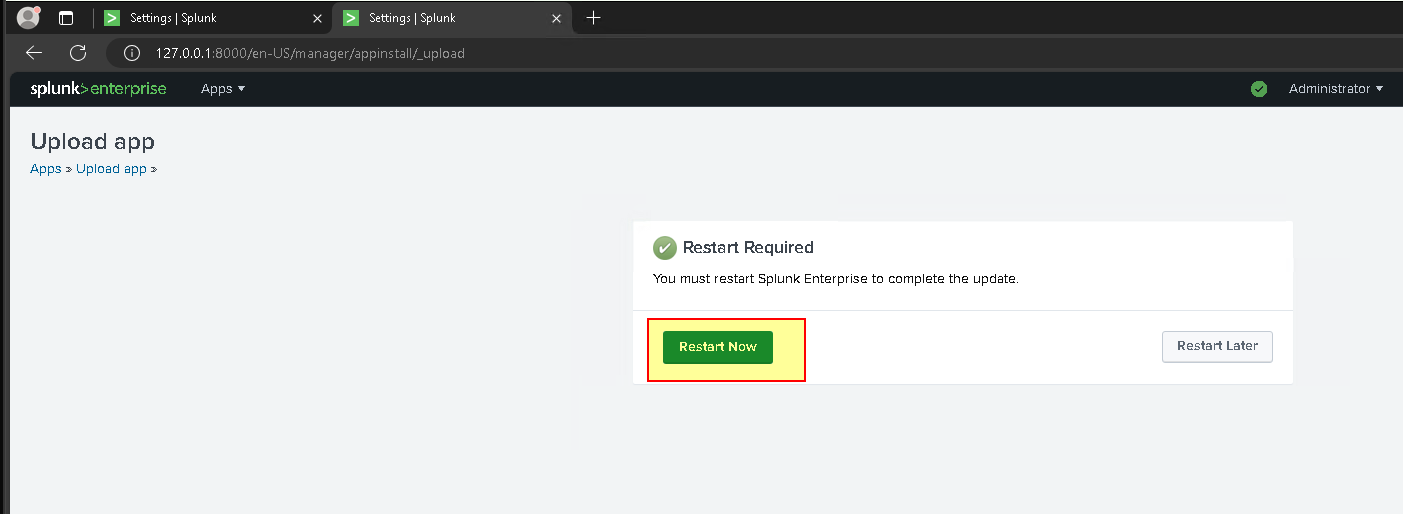
- Click Upload. After successful package upload, restart Splunk Web if required.

- To complete the installation, you need to configure data inputs. For more information, see Configuring Data Inputs.
- Configure Data Input
Configuring Data Inputs - Veeam App for Splunk
Supported configuration
- Splunk acts as a receiver — receives data from Veeam Backup & Replication through the forwarder installed on the intermediate syslog server.
- Splunk acts as a forwarder — receives data directly from Veeam Backup & Replication and forwards it to another Splunk instance, syslog server, or third-party solution.
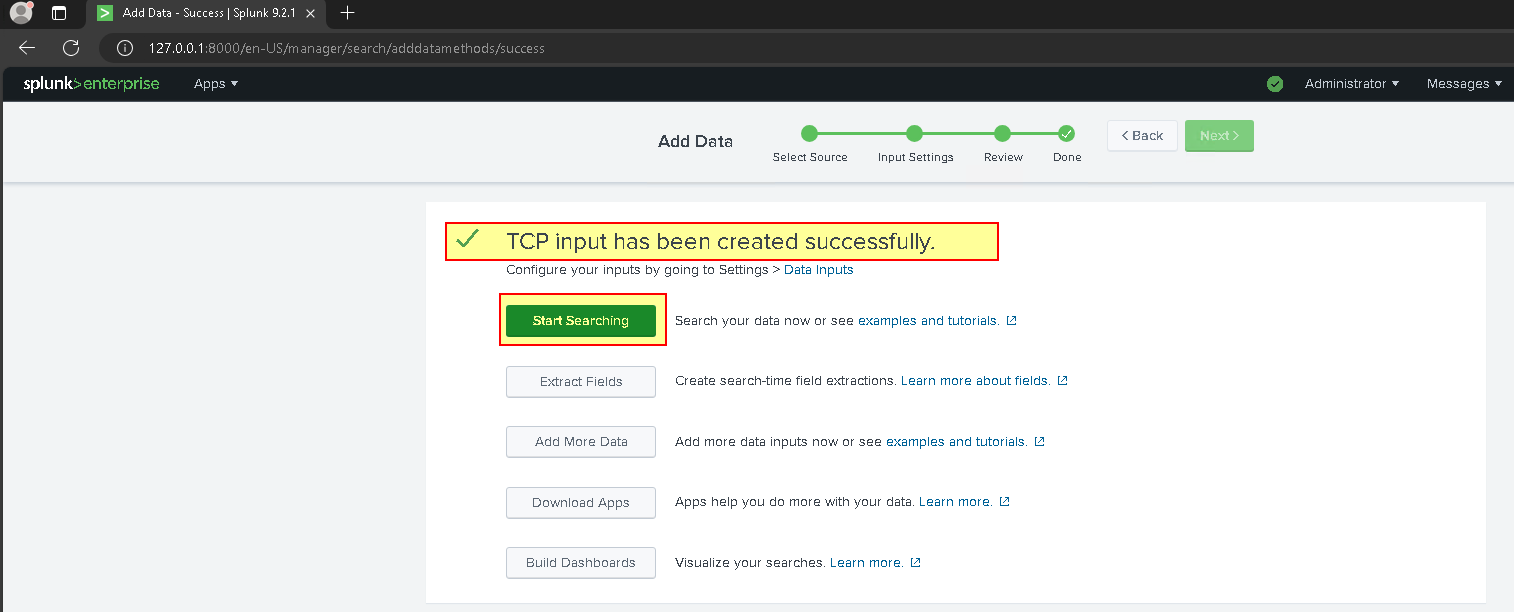
- Splunk acts as the only syslog server — receives data directly from Veeam Backup & Replication (My choice)
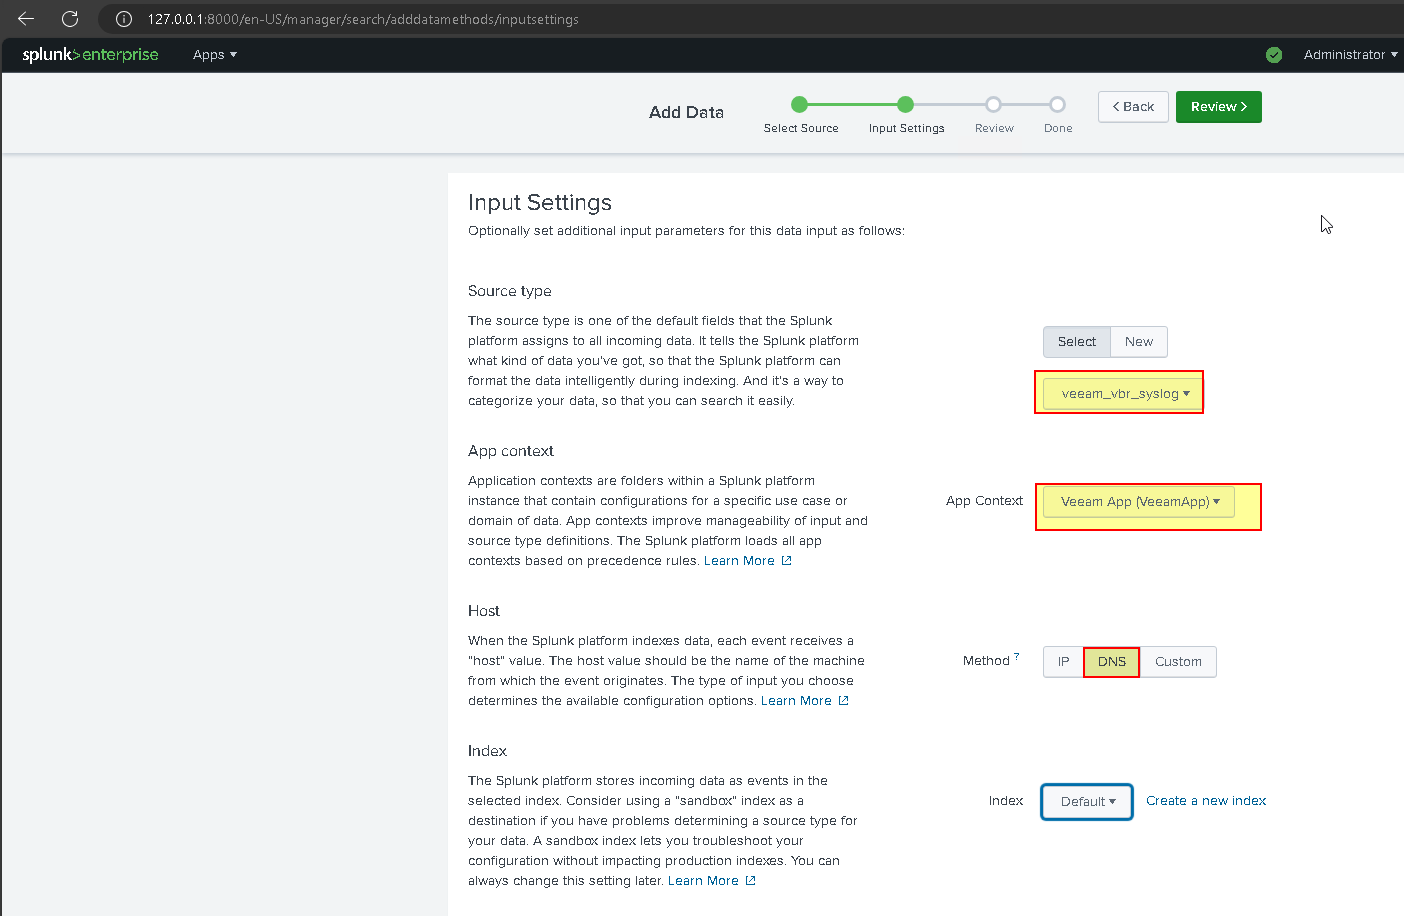
To configure data inputs, specify the “veeam_vbr_syslog” source type. For other settings, follow recommendations from:
- Get data from TCP and UDP ports for Splunk Enterprise
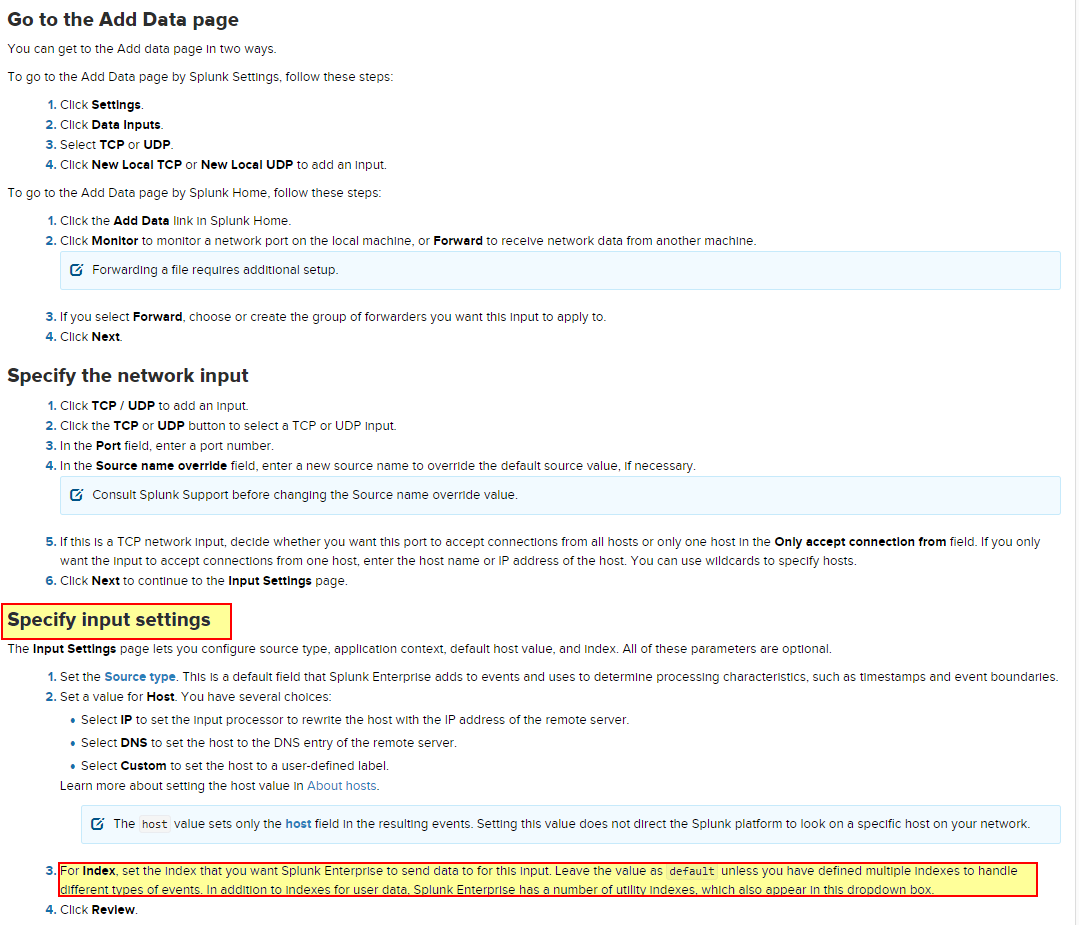
- Two methods for configuring data input
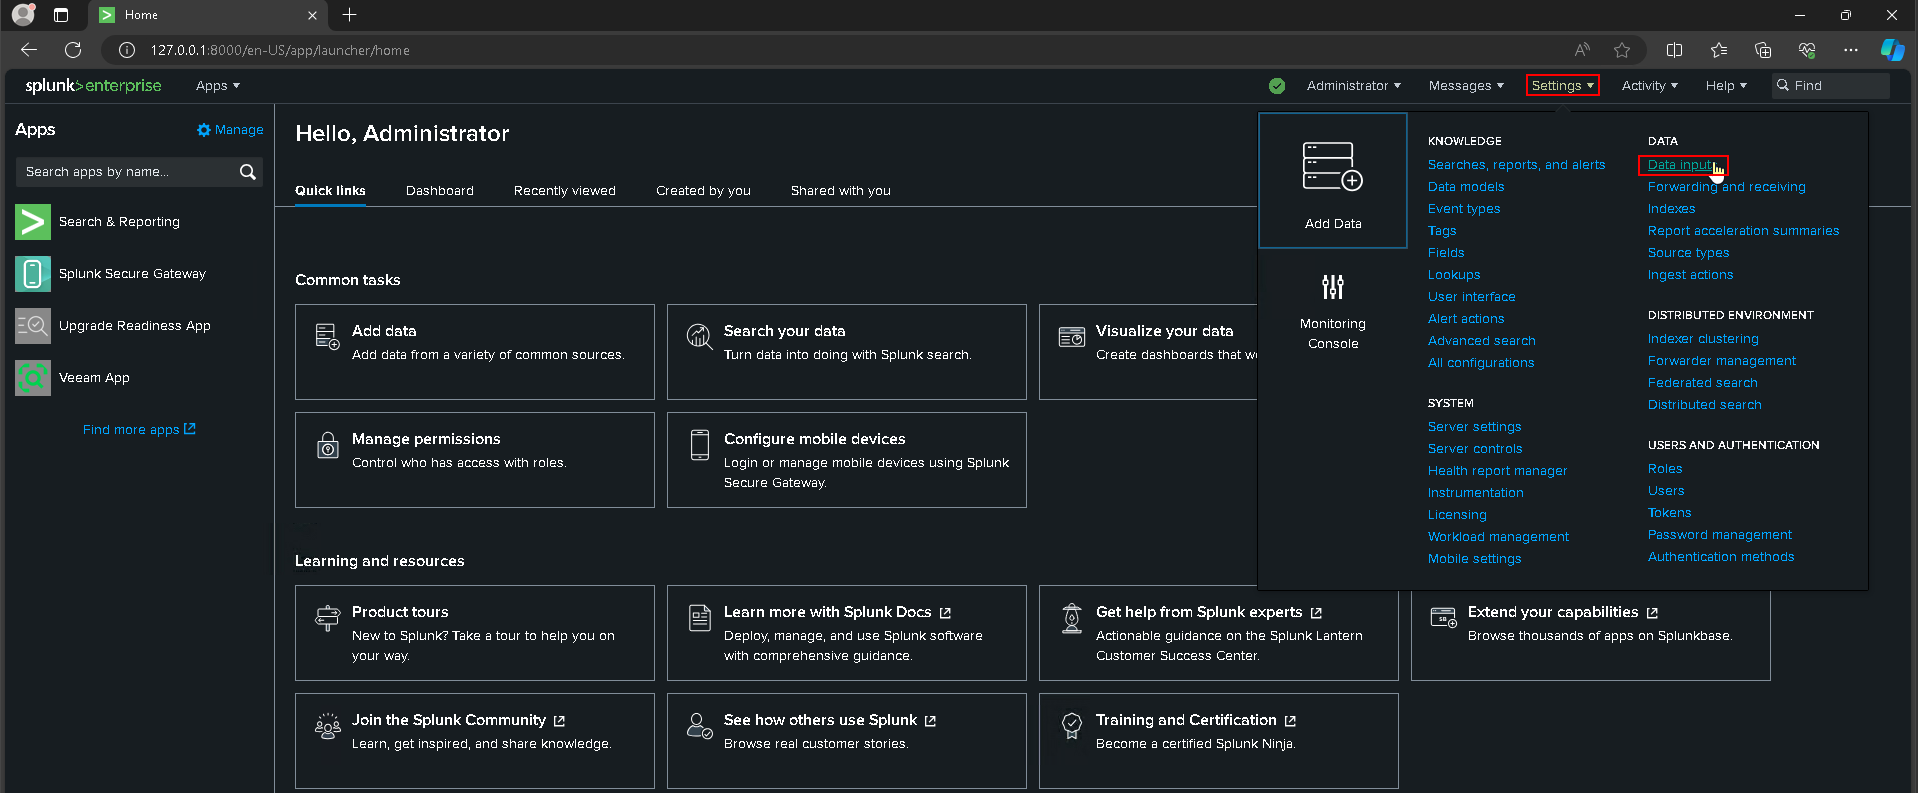
or
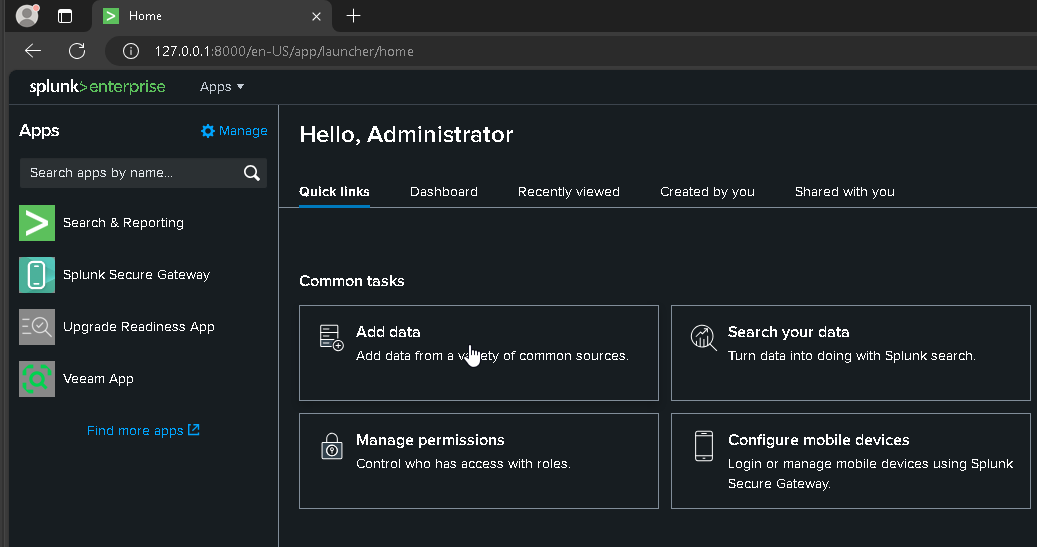
- Chose the second option

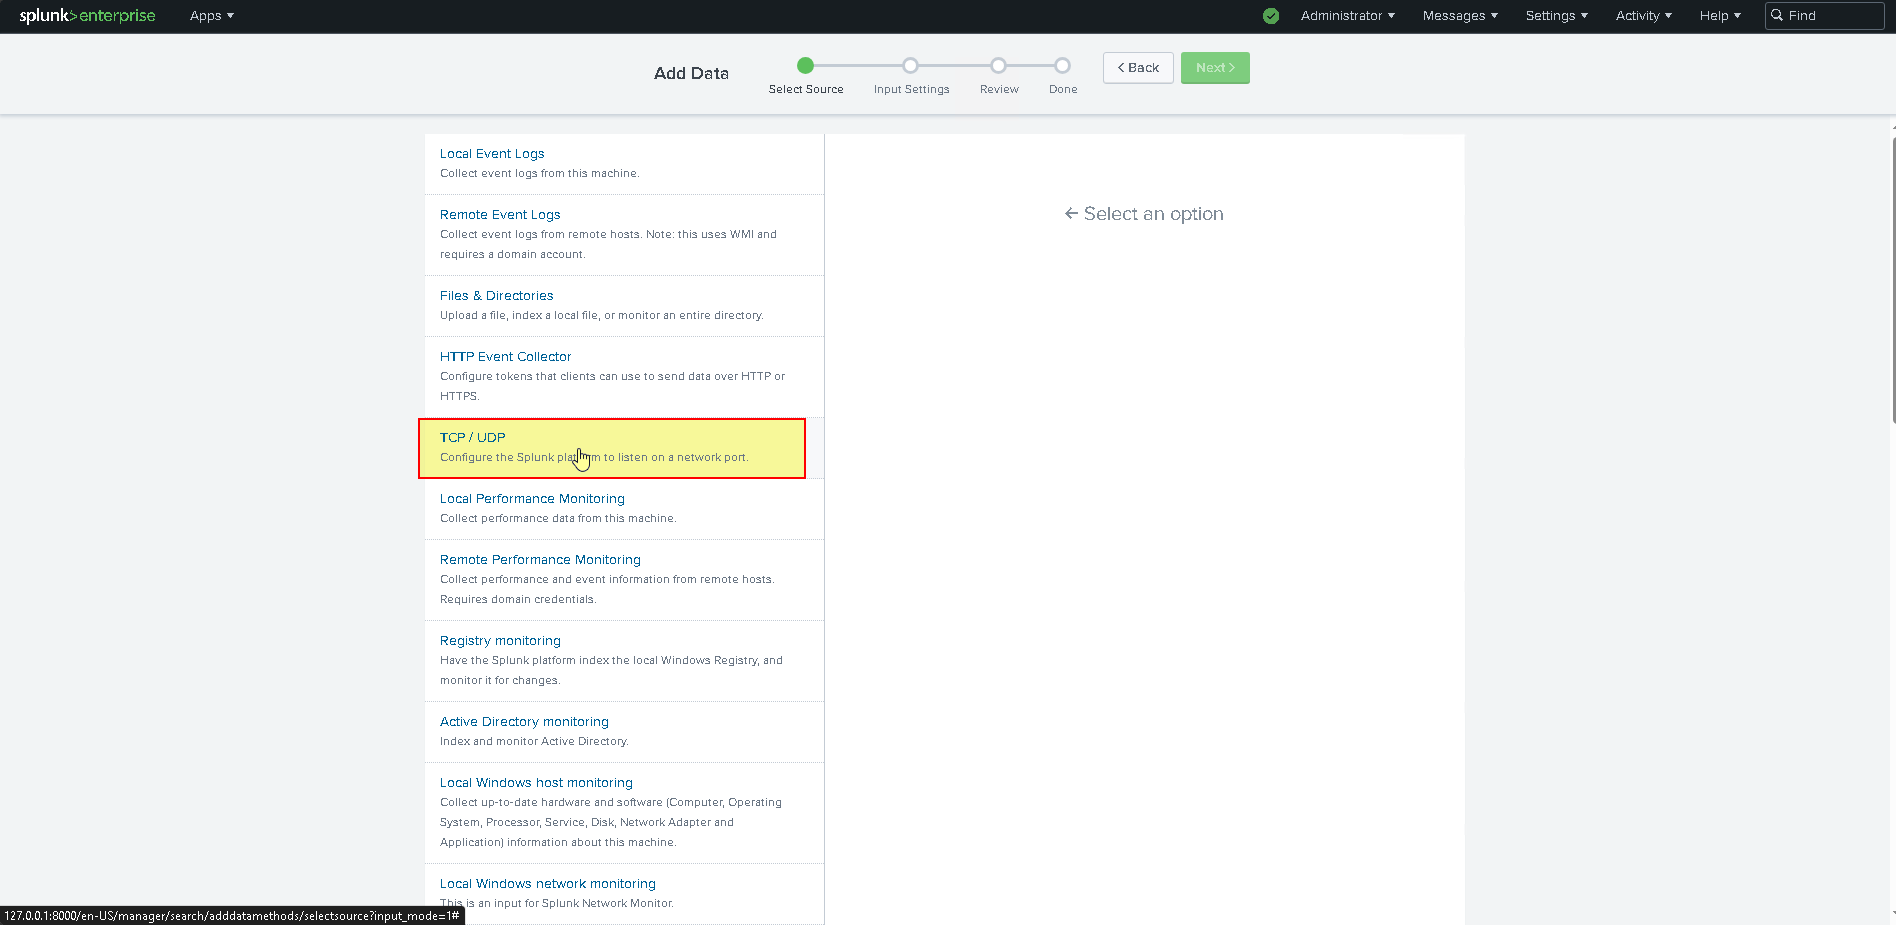
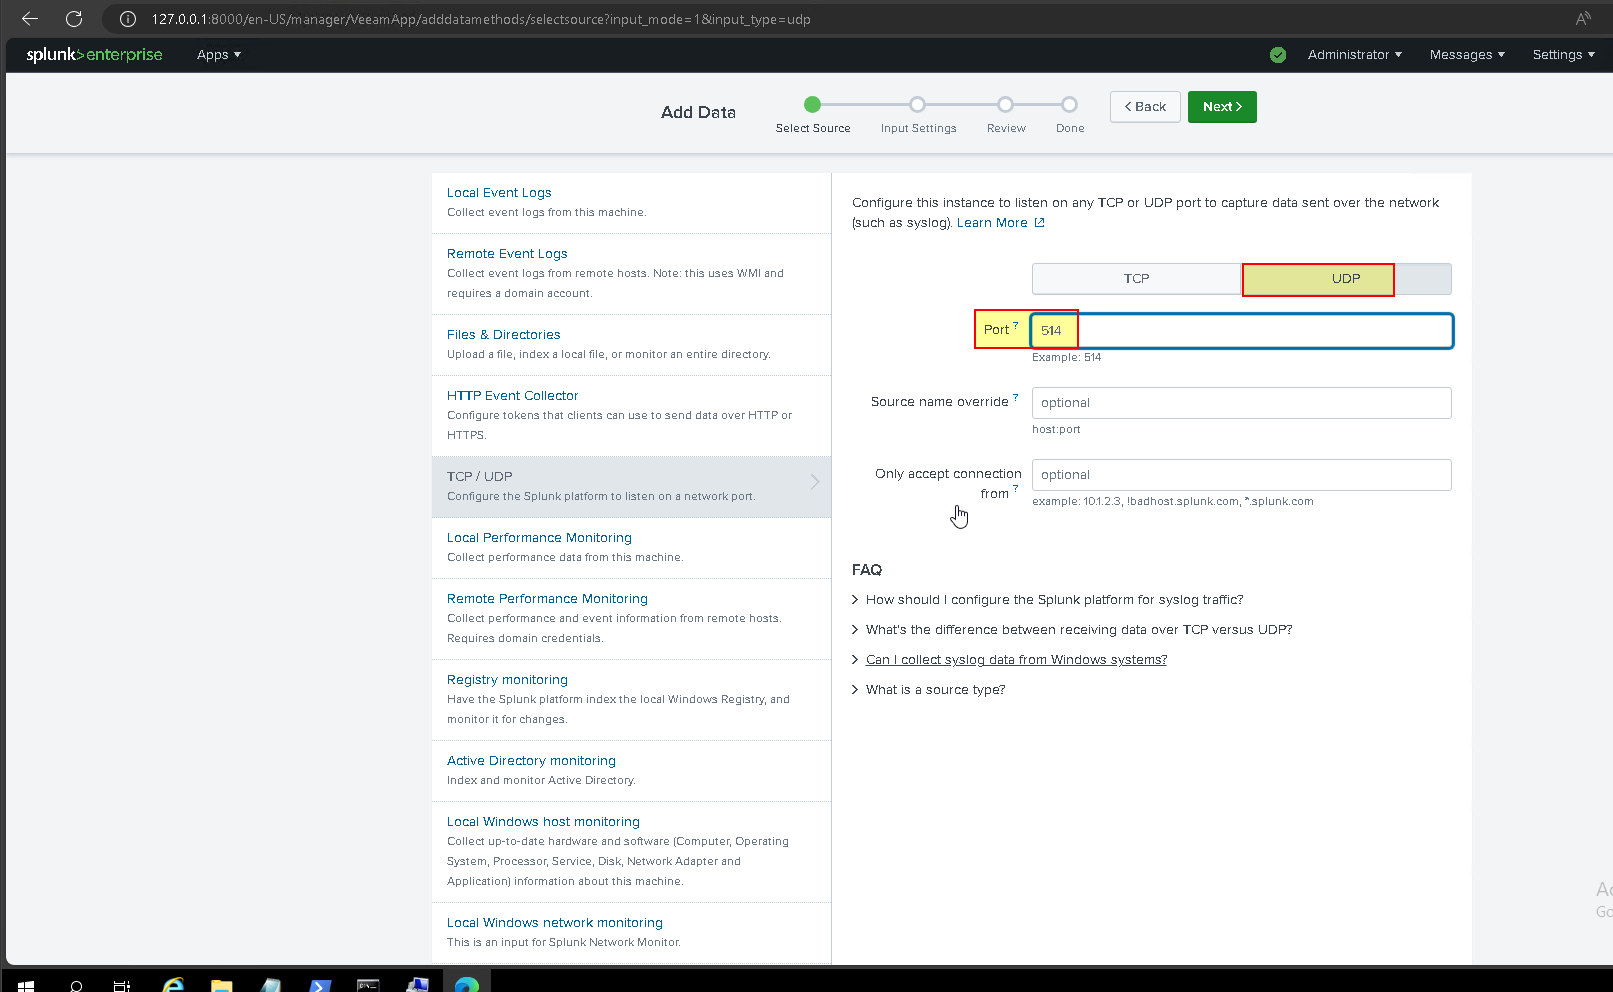
- To configure data inputs, specify the “veeam_vbr_syslog” source type. For other settings, follow recommendations from Splunk documentation
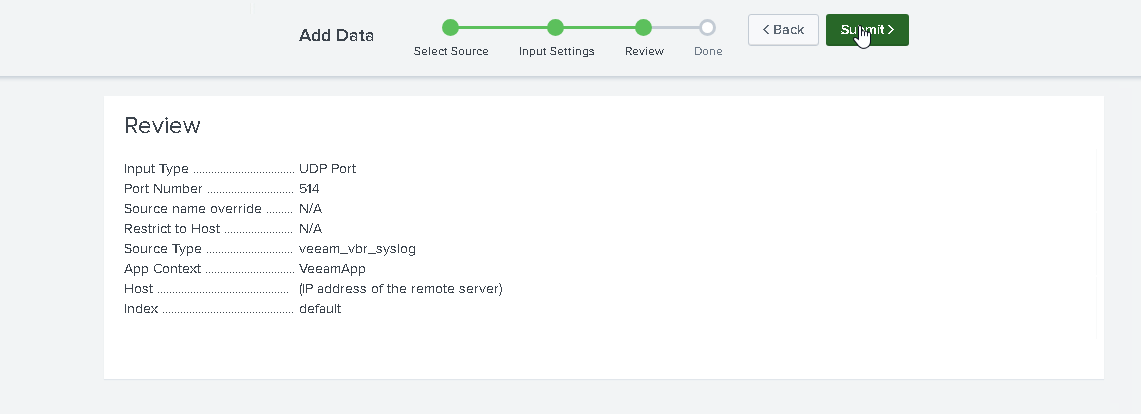
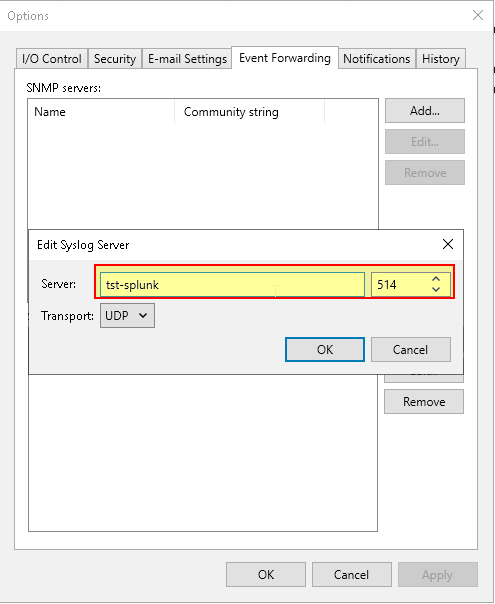
- Configure “Event Forwarding” VBE side: UDP Protocol, port 514.
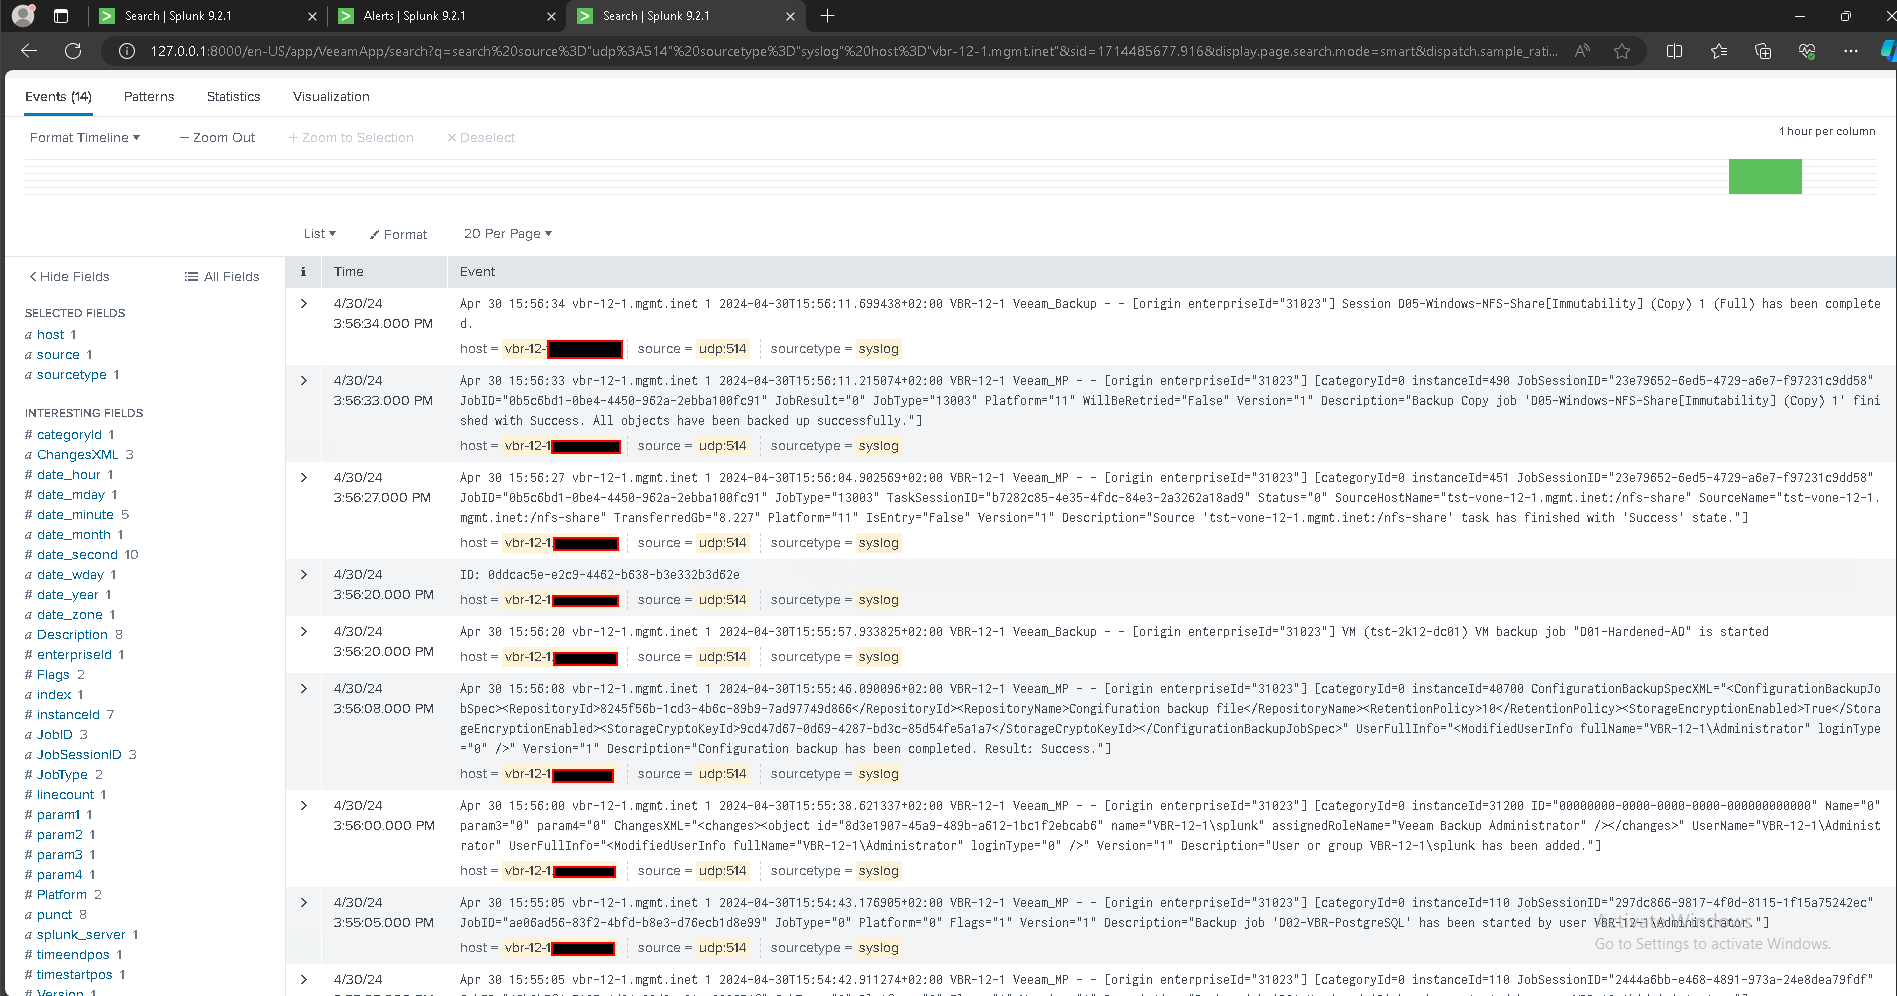
- Check arrival events
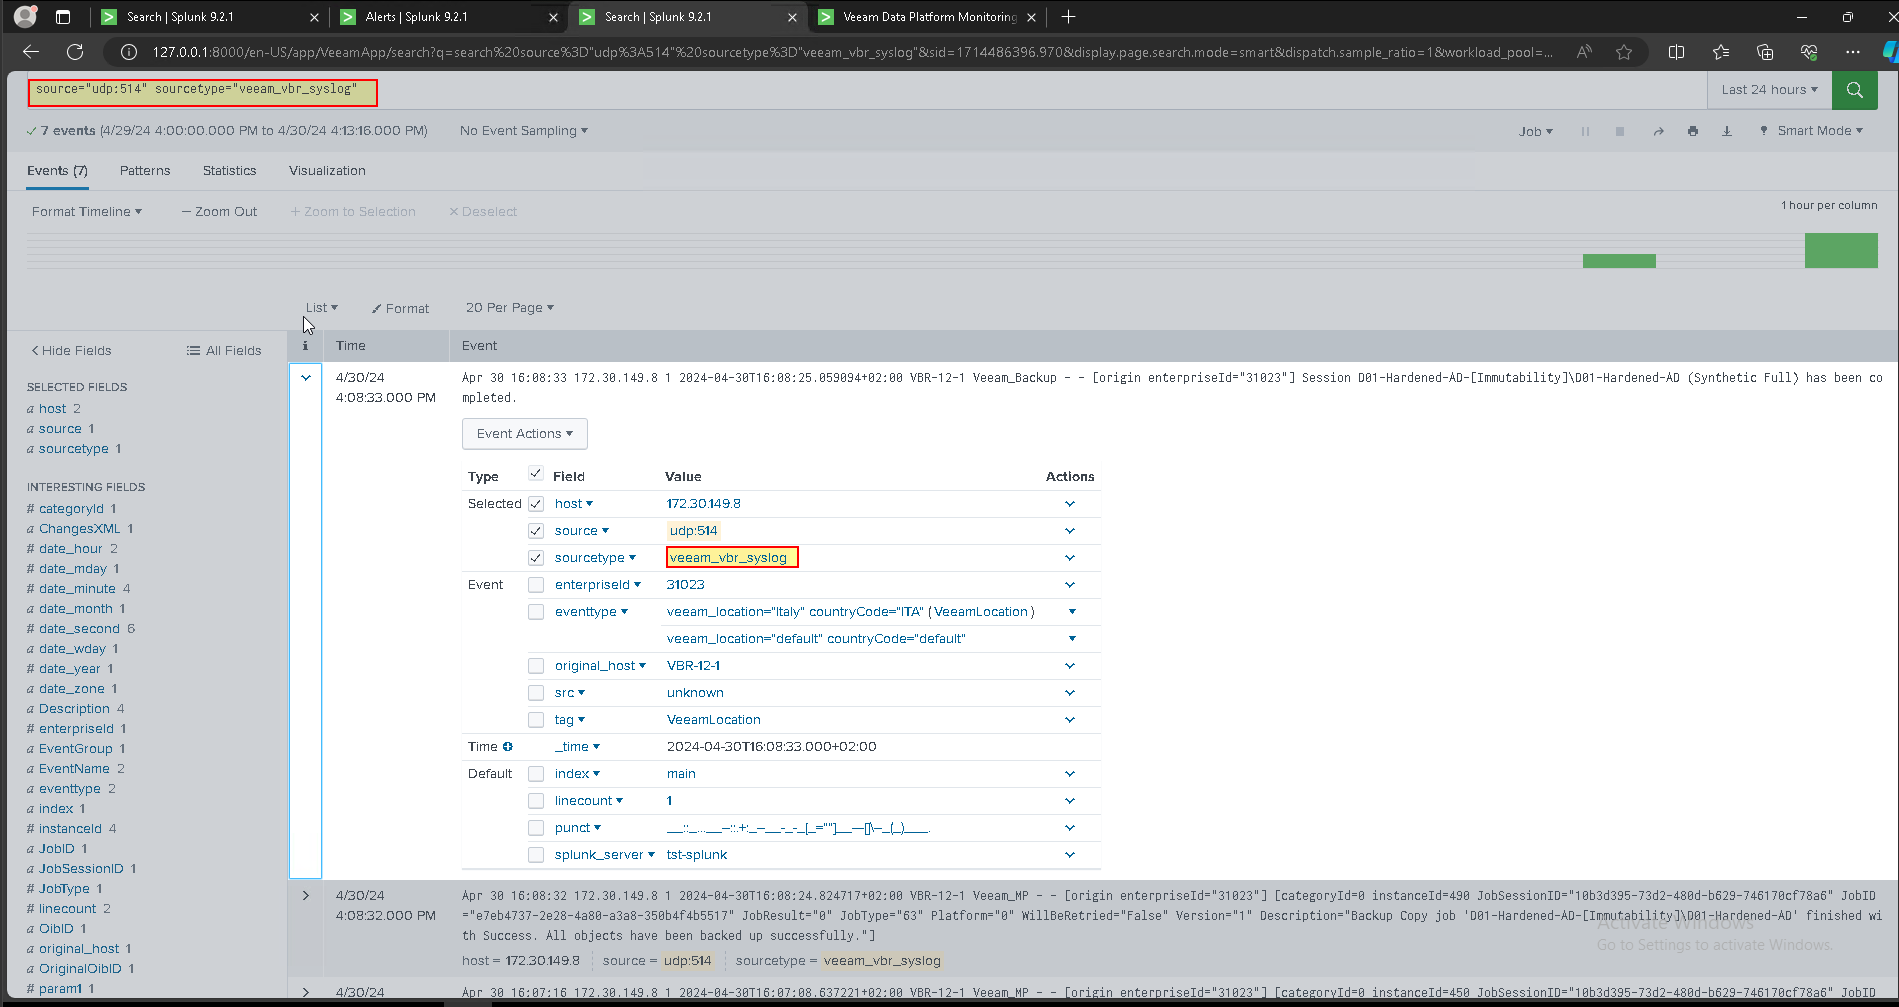
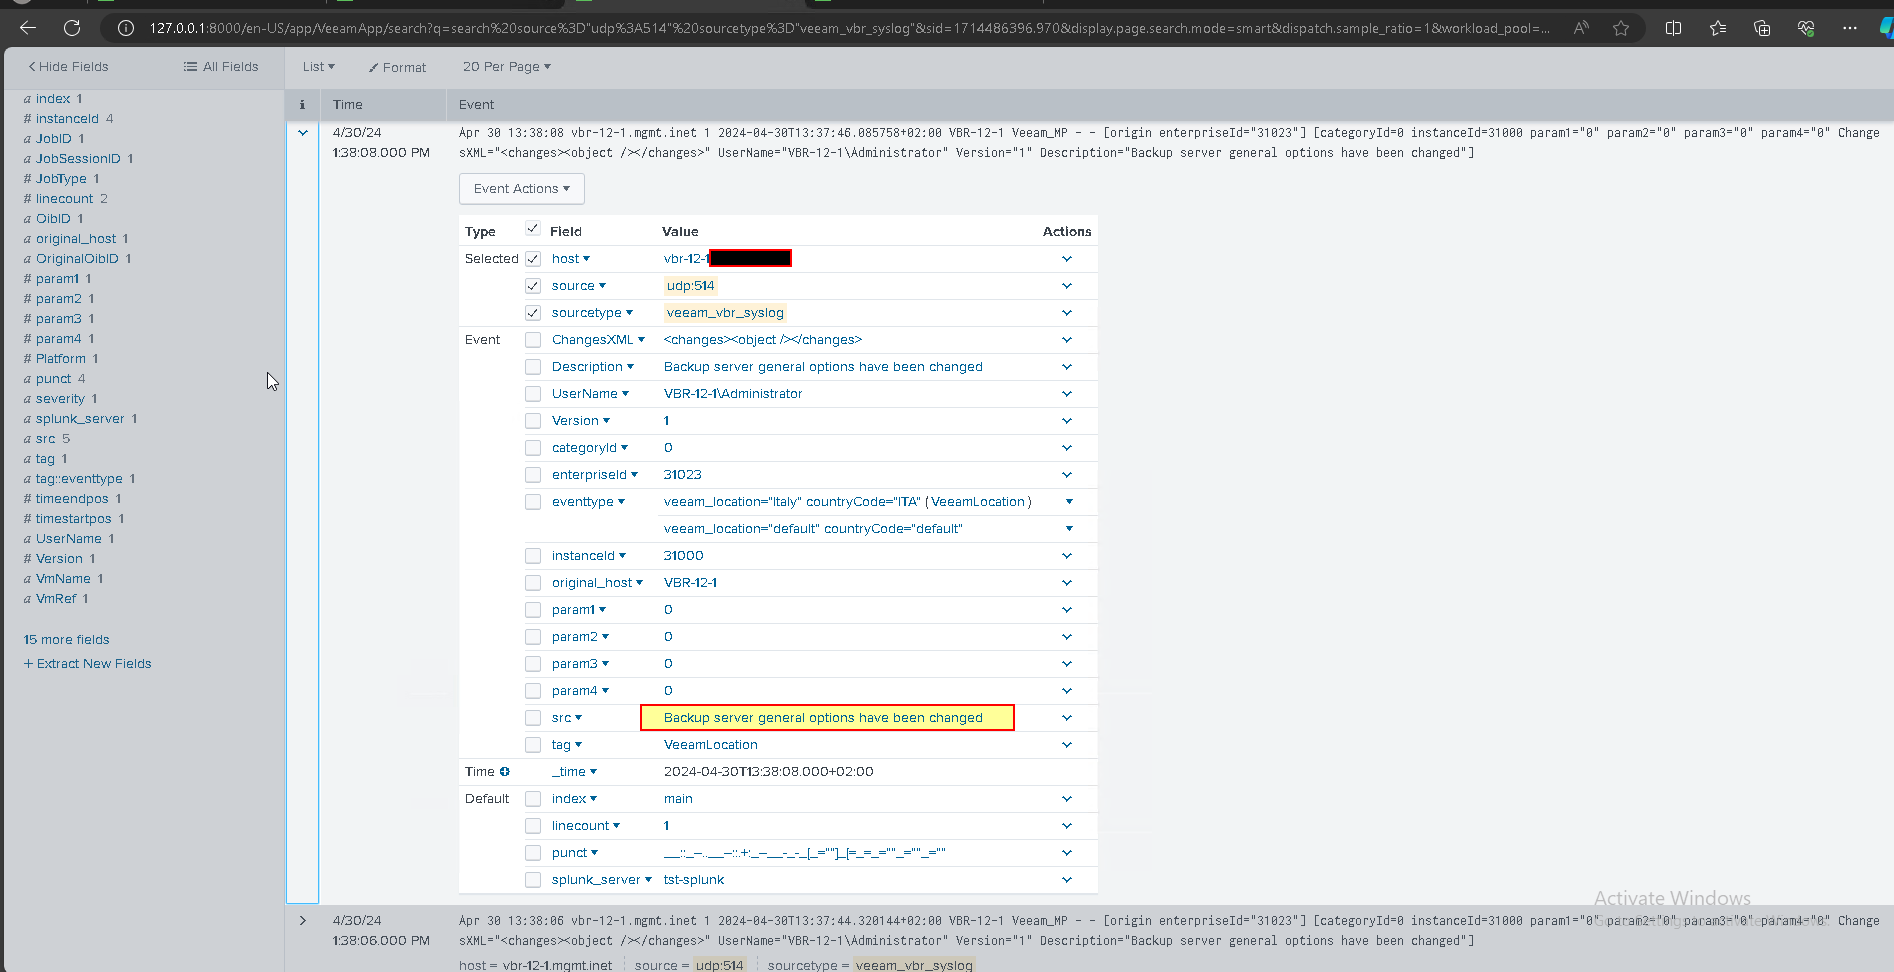
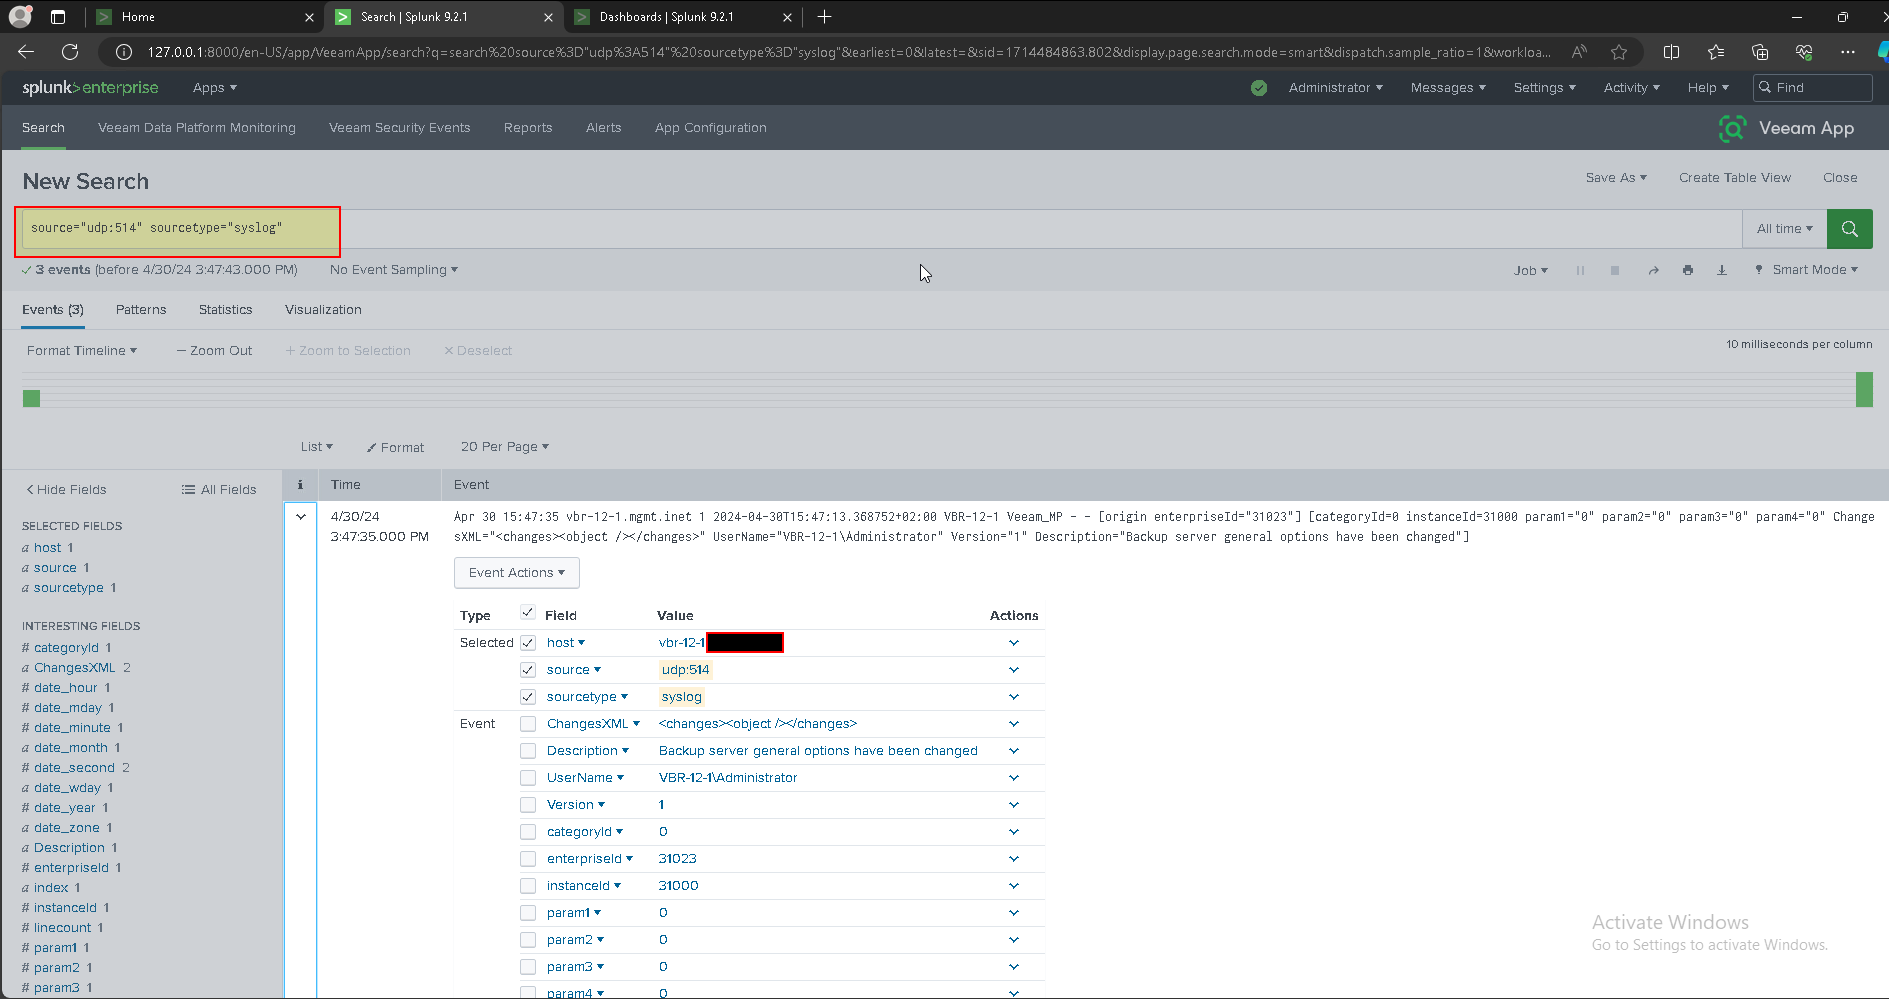

- Configure Veeam App for Splunk
Configuring Veeam App for Splunk - Veeam App for Splunk
- Managing Events
Managing Events - Veeam App for Splunk

- Choose your configuration and classification of Critical\High\Medium Events
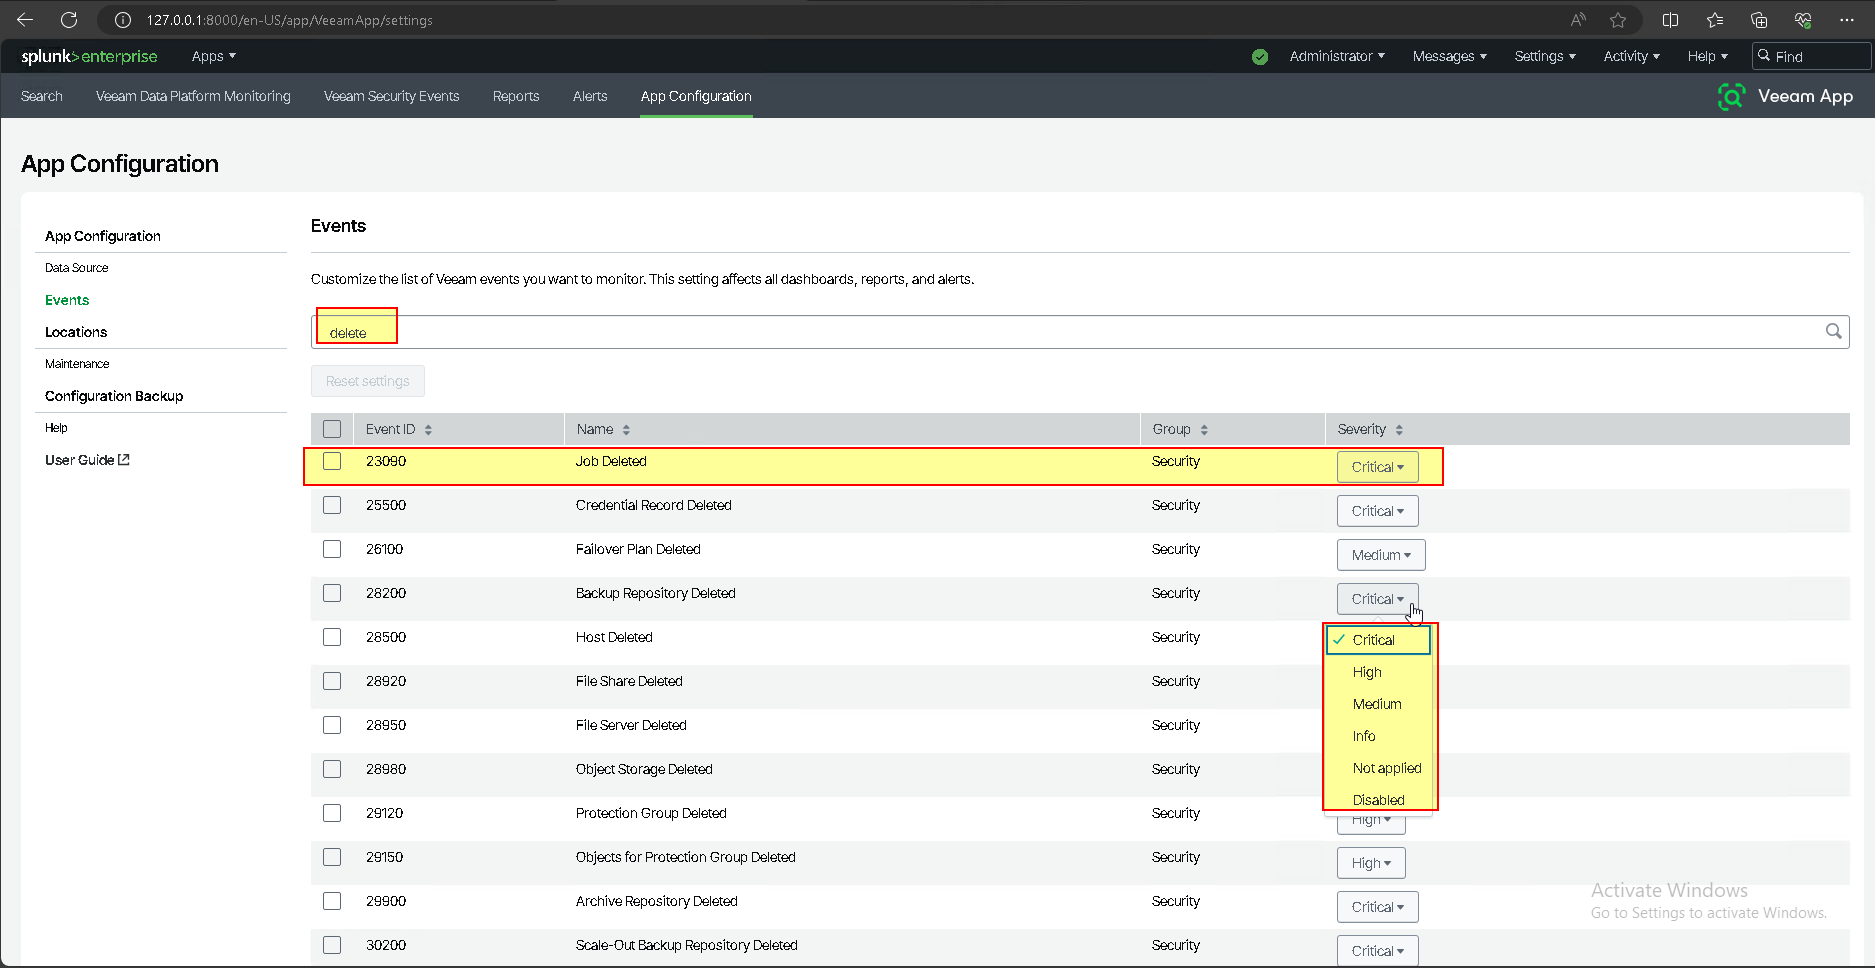
- Configure Managing Location
Managing Locations - Veeam App for Splunk


- Configure your VBR Location
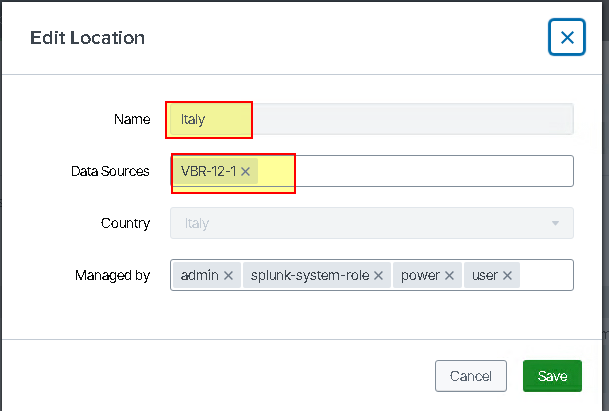
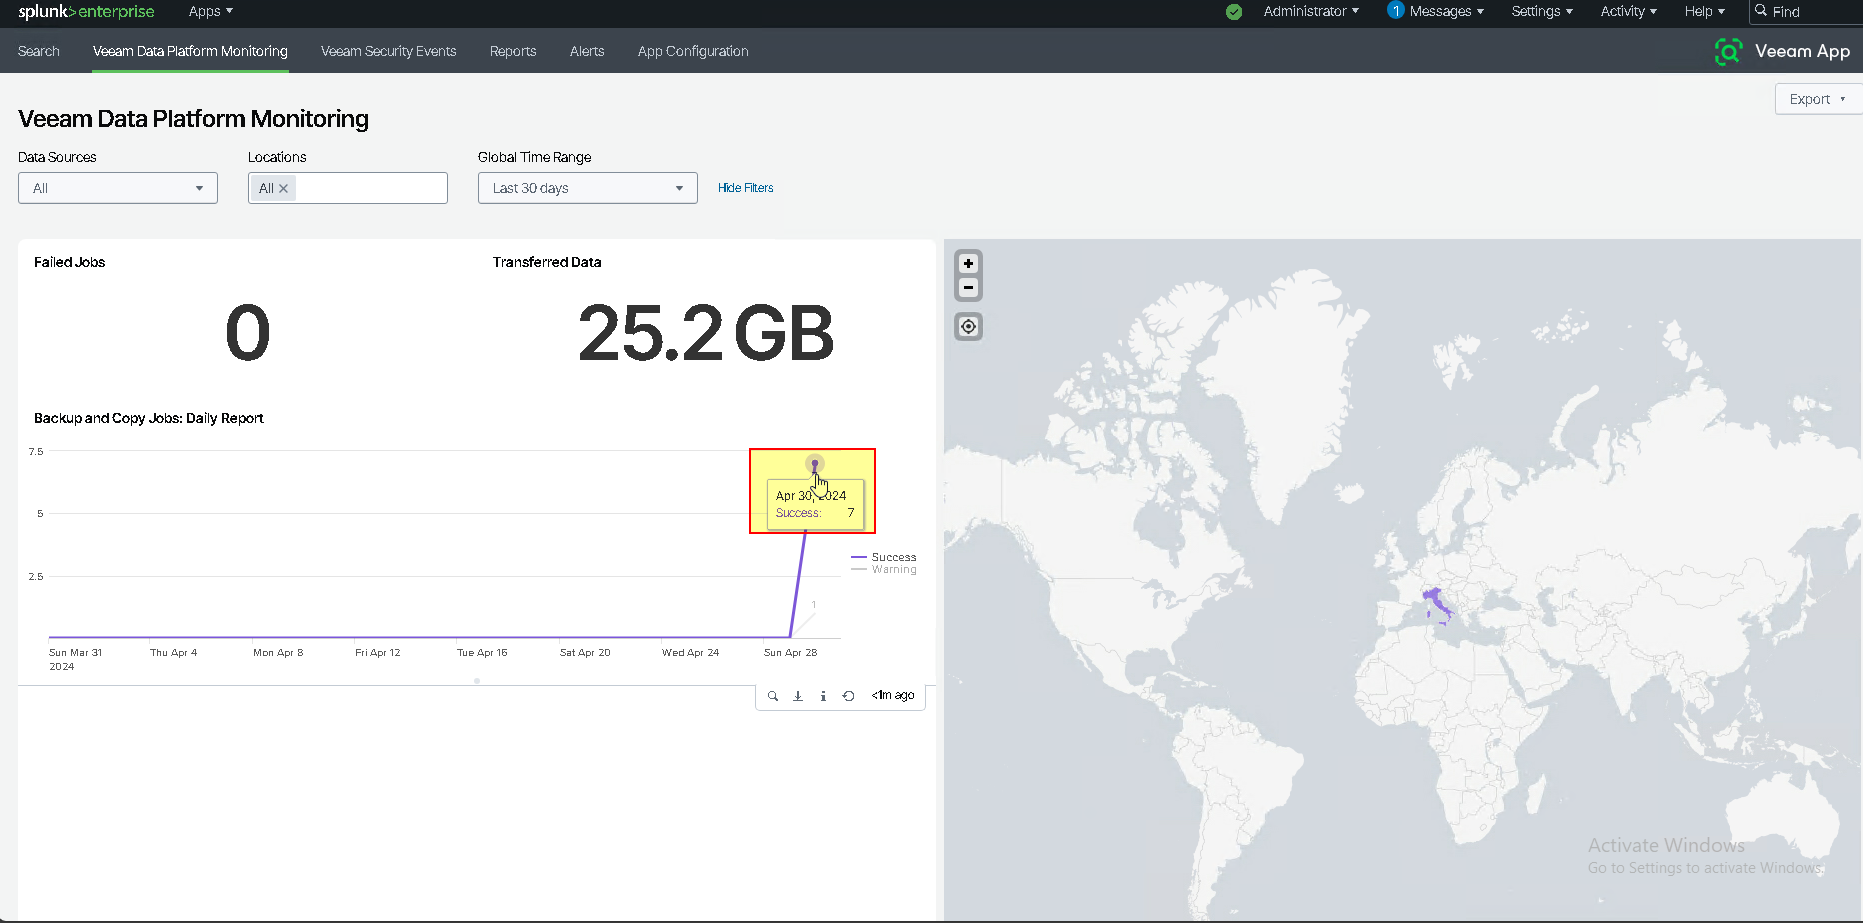
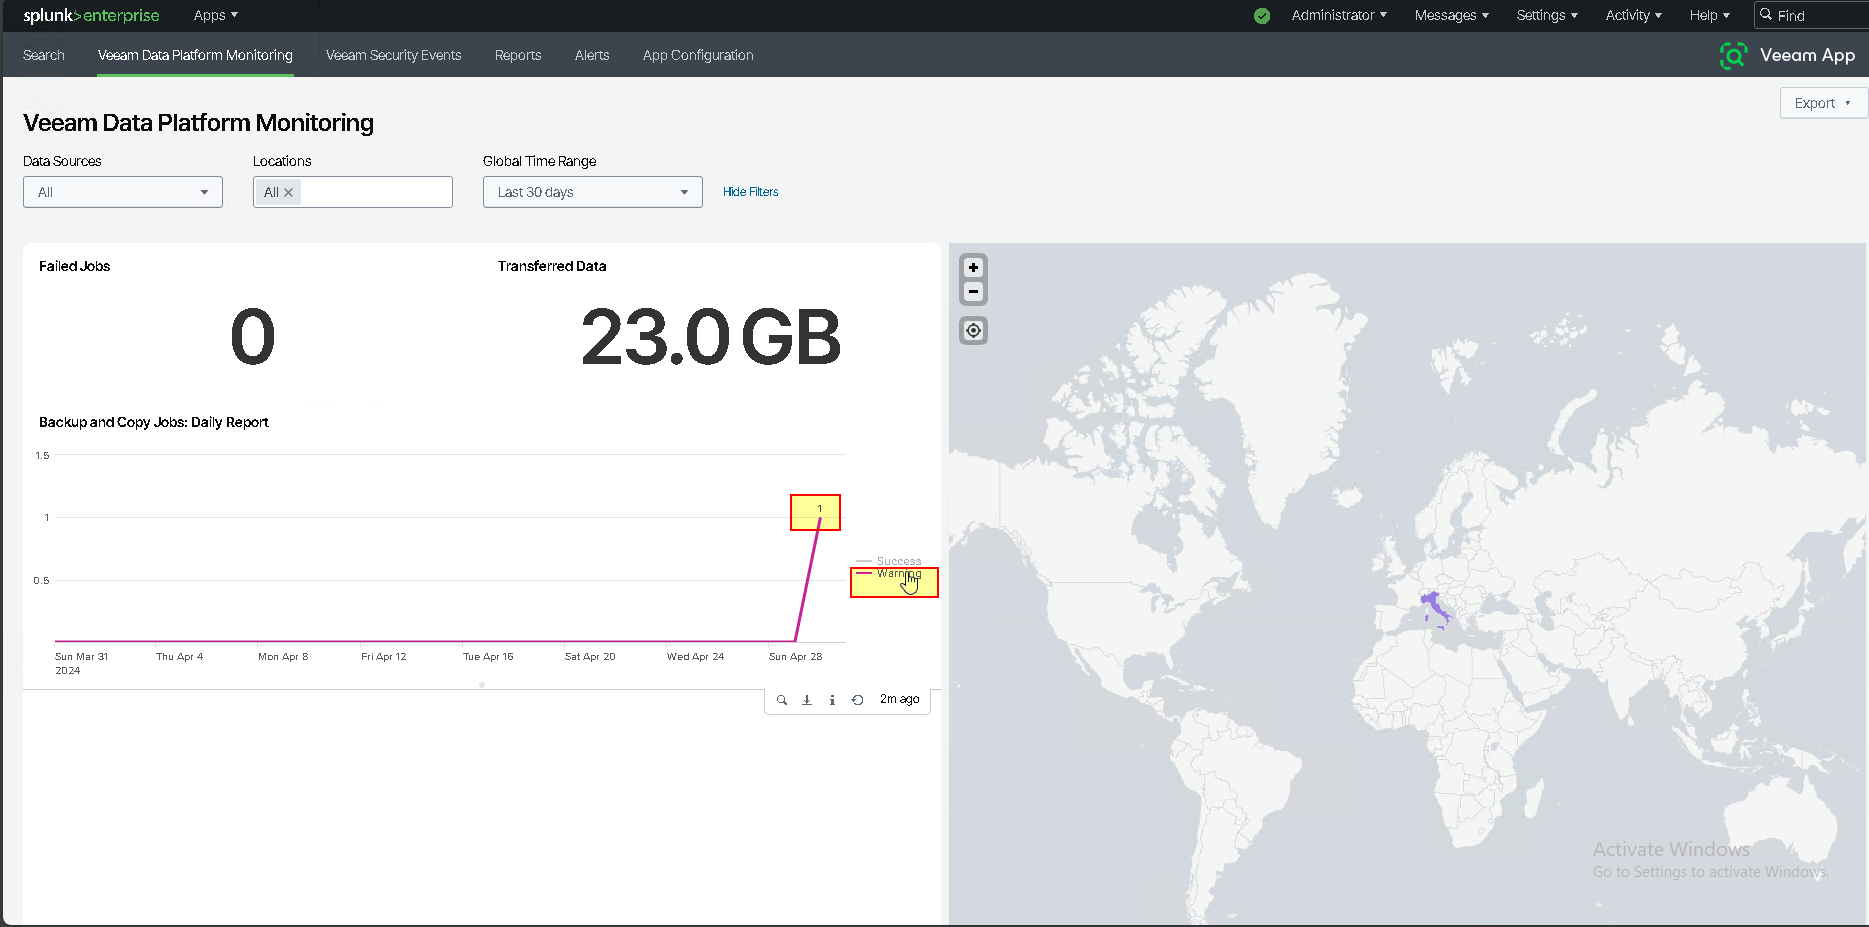
- Check Veeam Data Platform Monitoring \ Location
Select Success
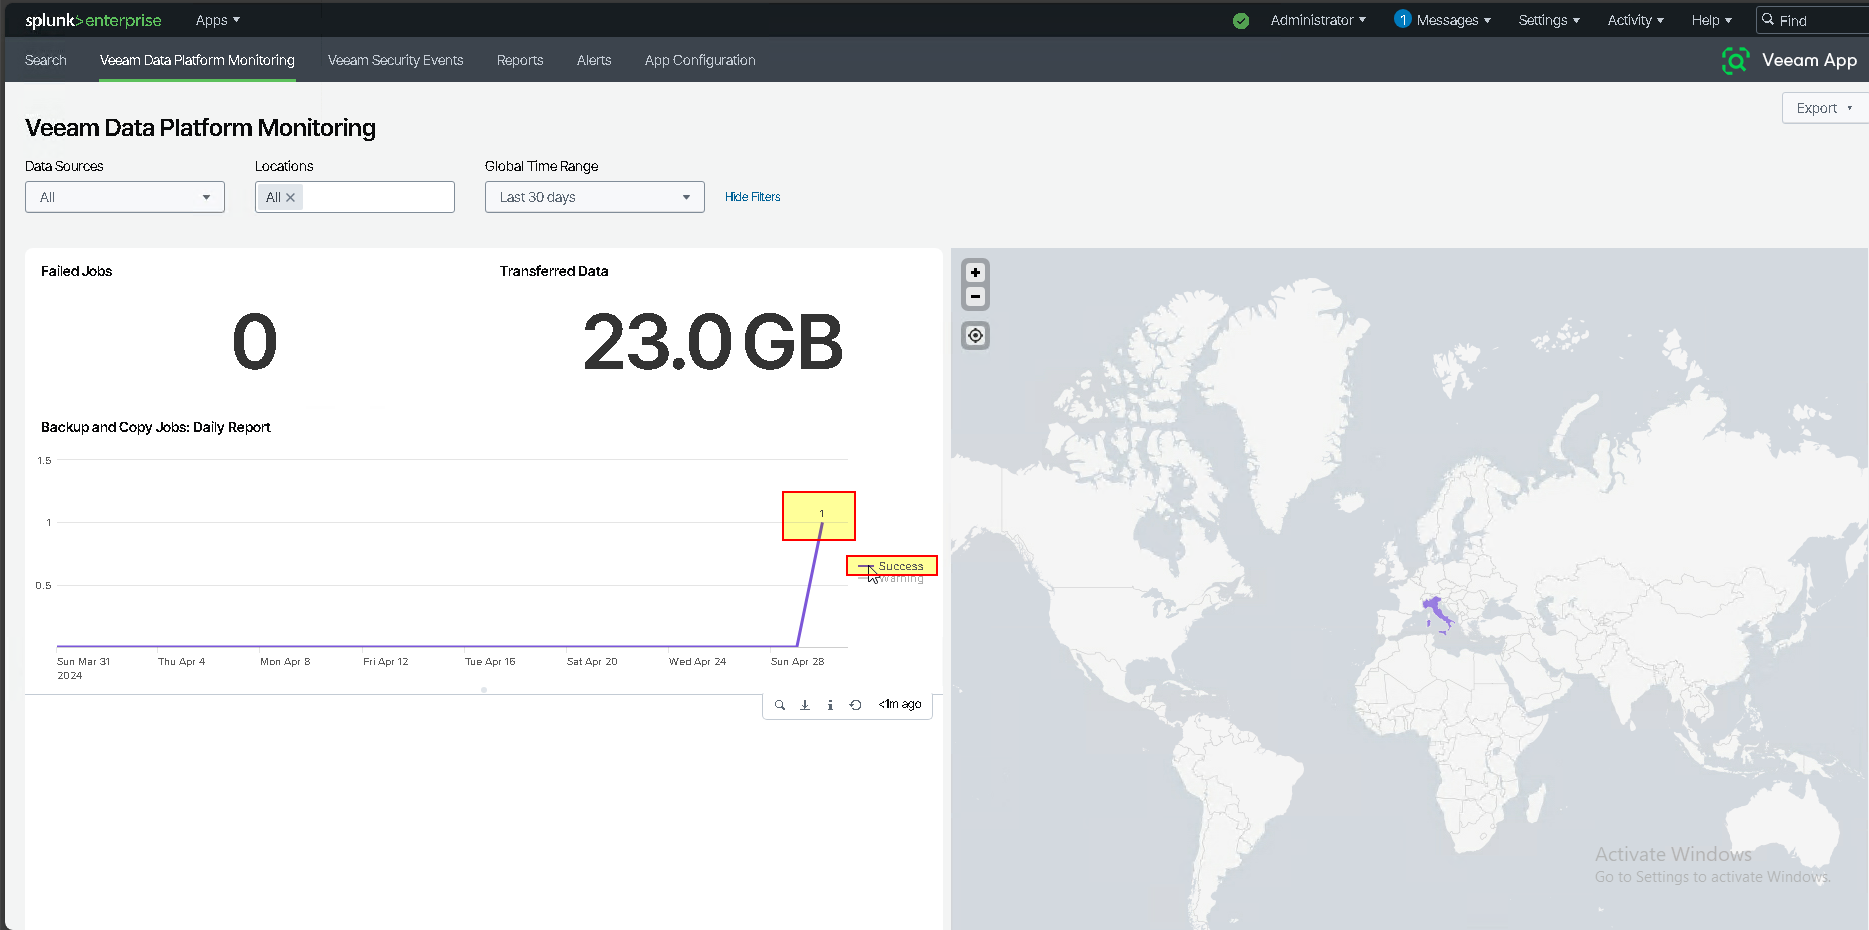
- Statistics and graphs after running several backup and Copy jobs
- Select Warning
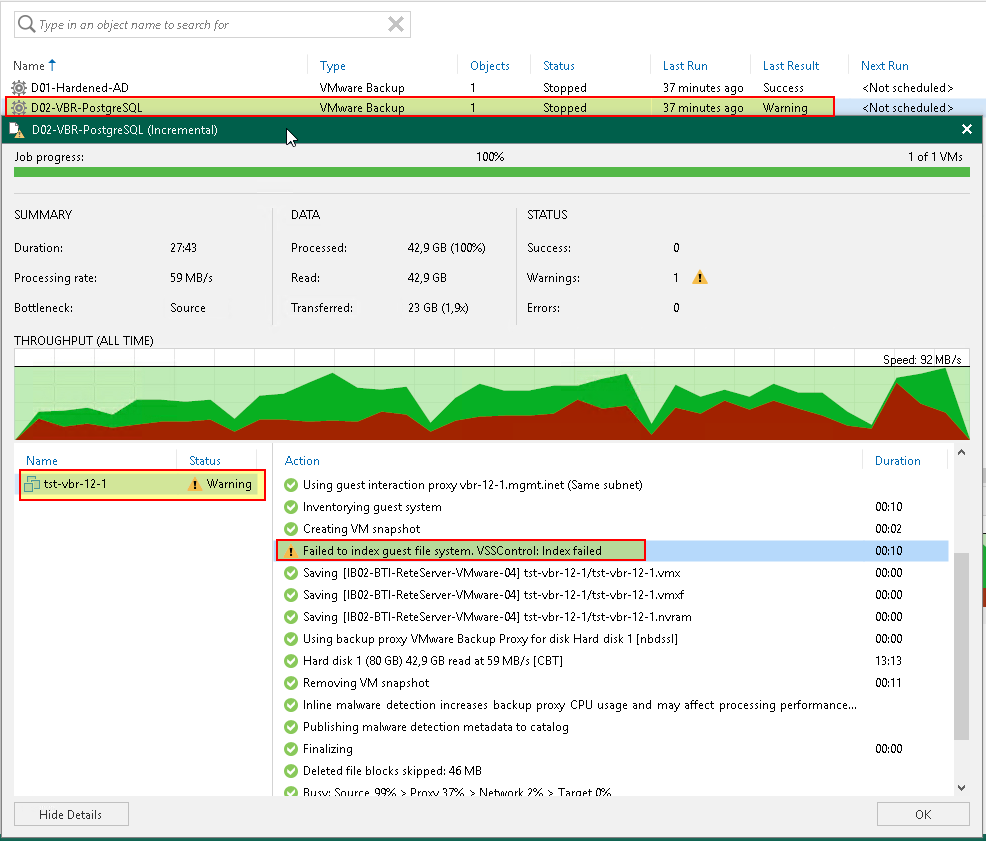
- Managing Configuration Backup
Managing Configuration Backup - Veeam App for Splunk


- Addon configuration: Enable Alert
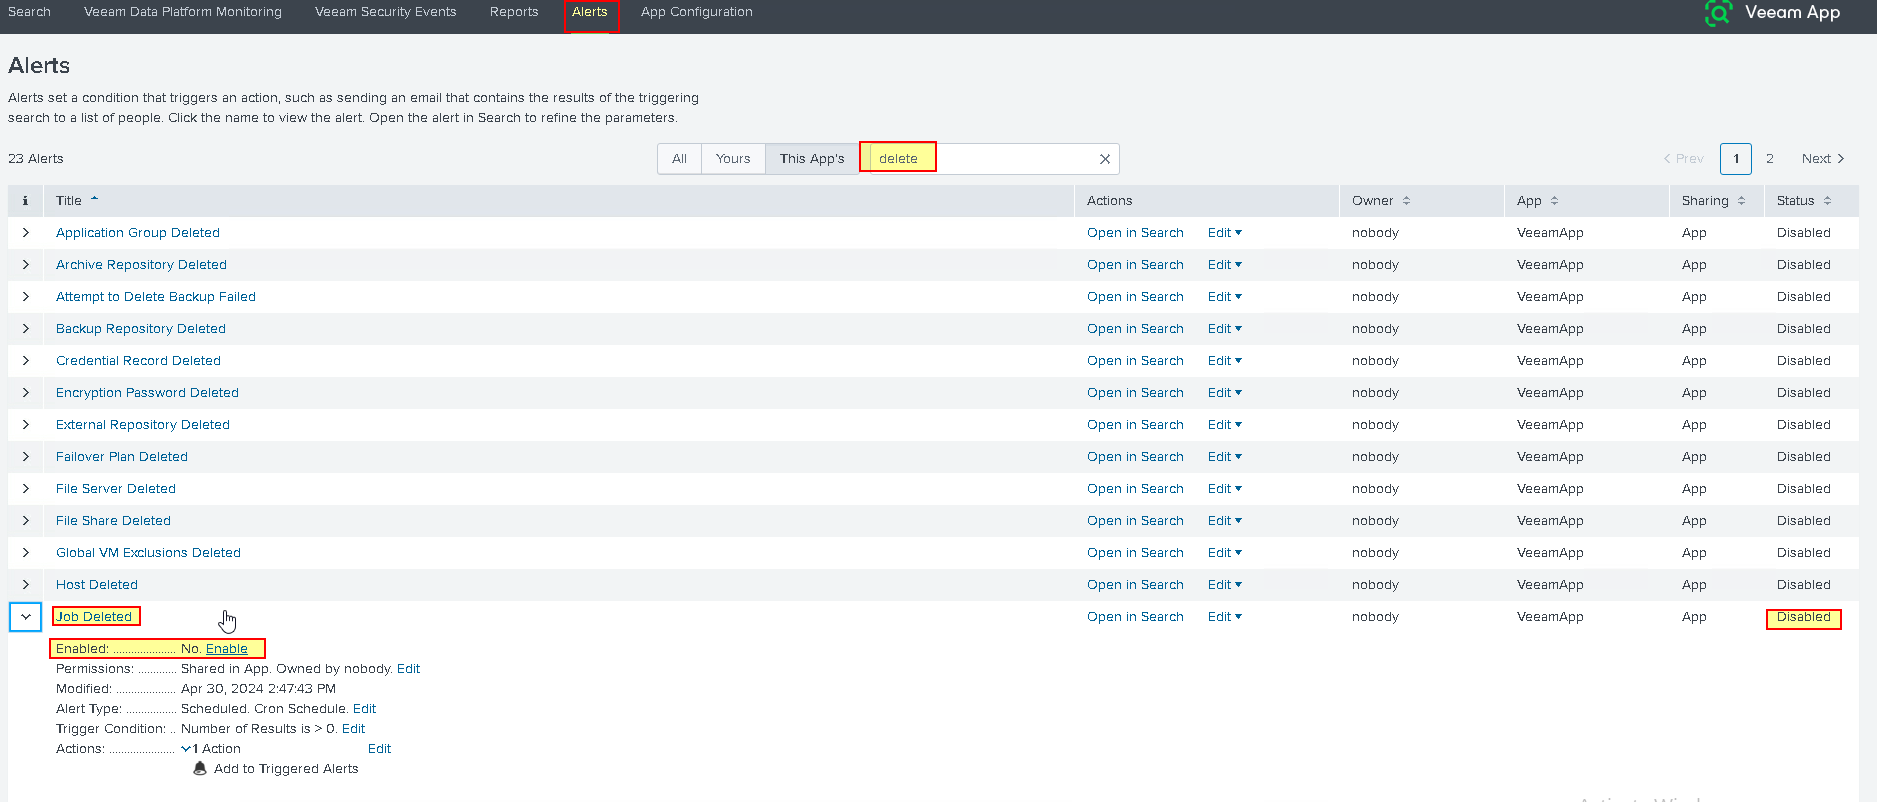
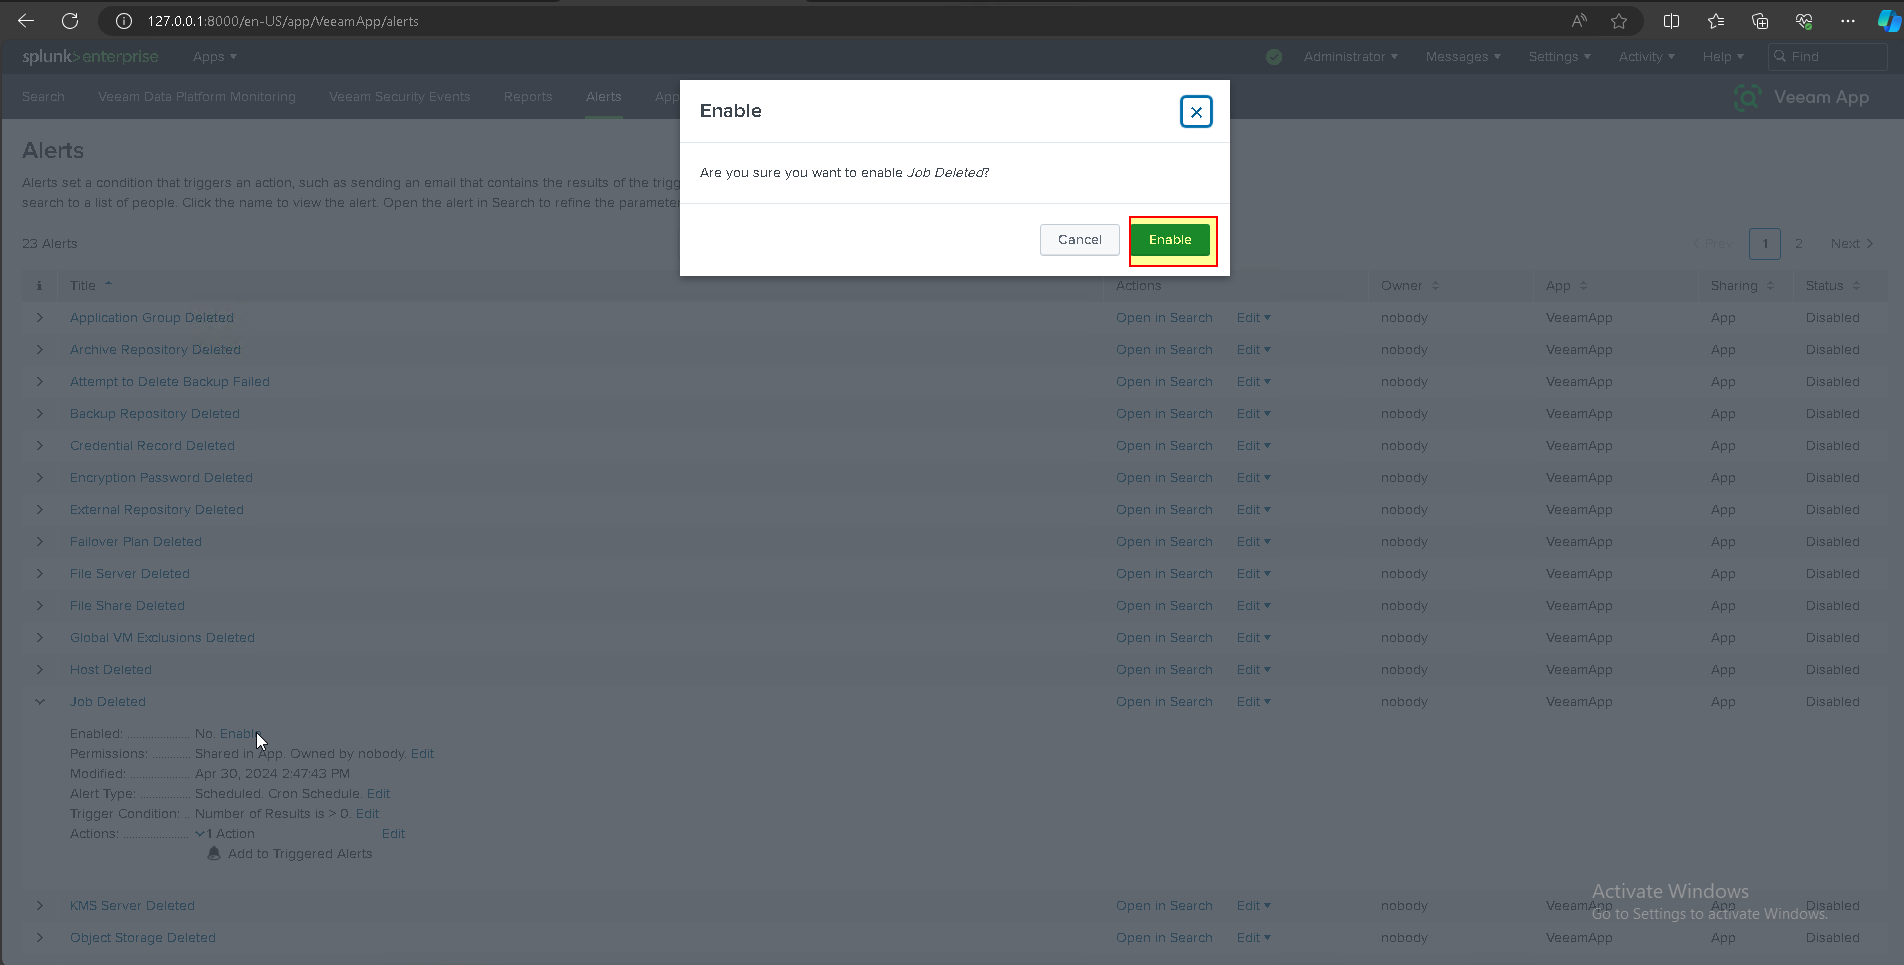
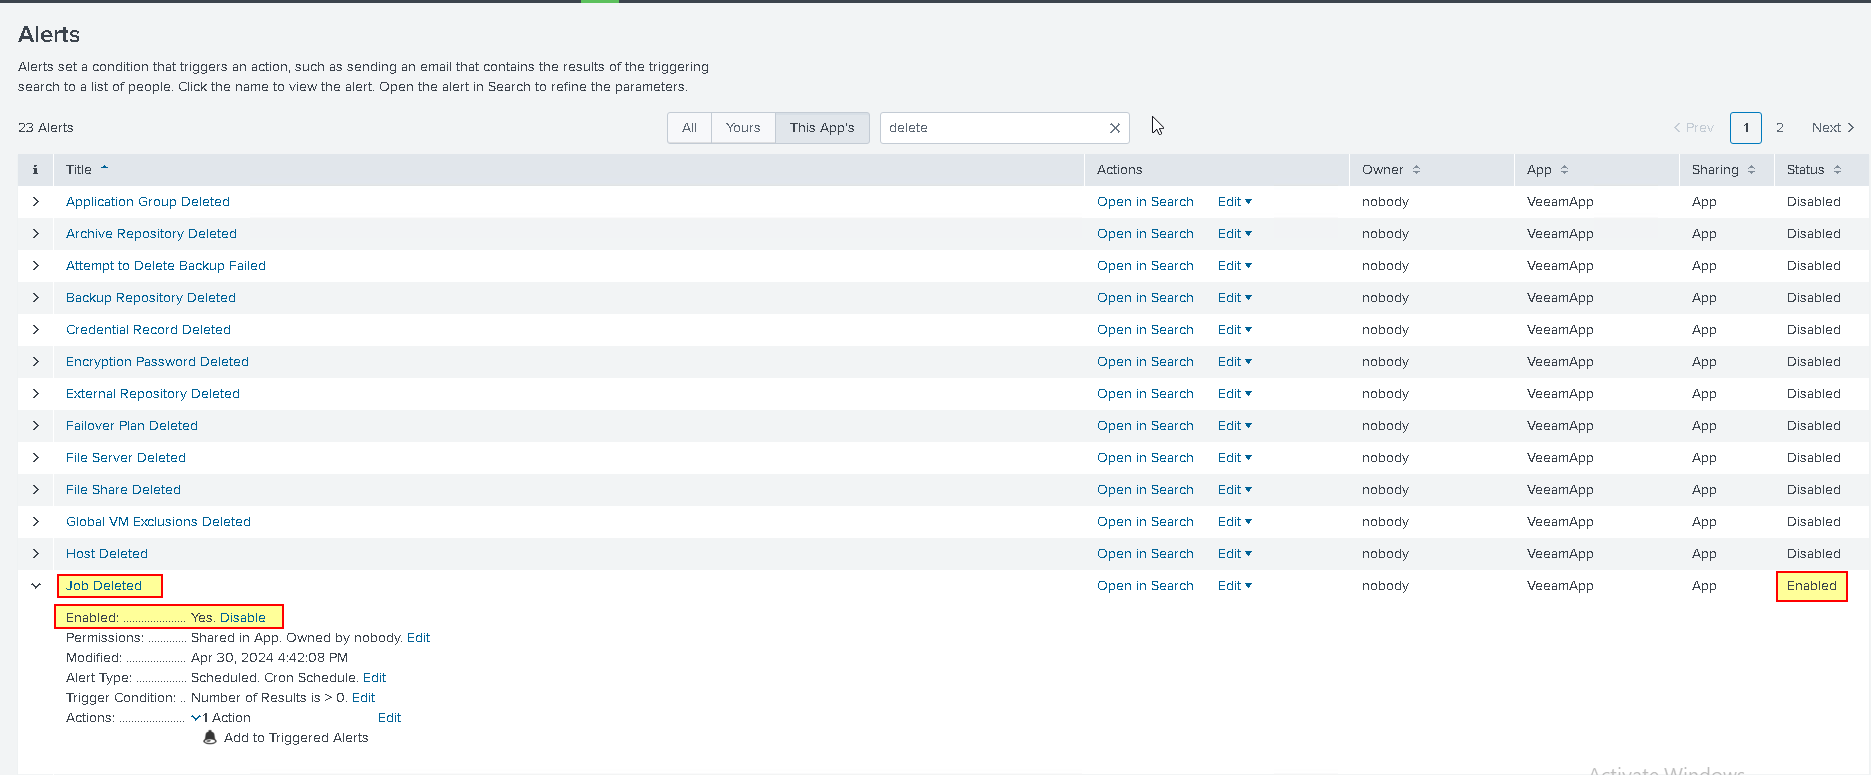
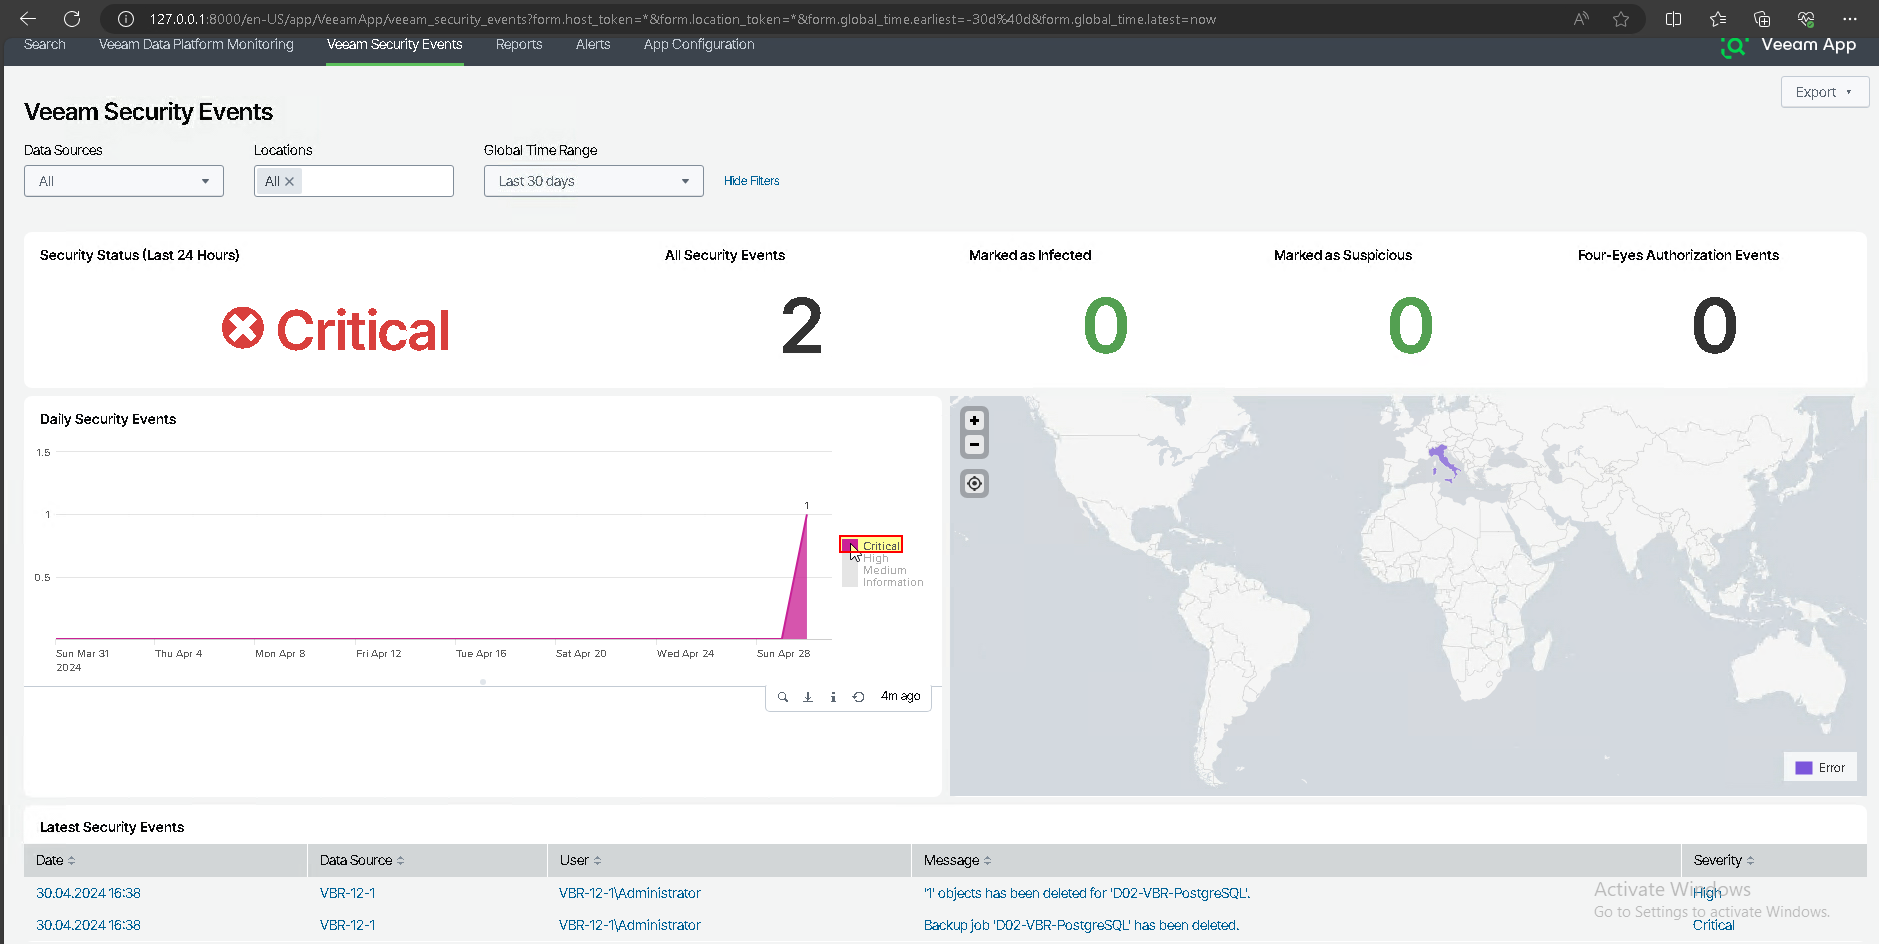
- Control simulation of Security Events
I deleted two jobs to check the rules and related alarms are recorded by Veeam App for Splunk system
clicking on the alert takes us to the query search that generated the alert.
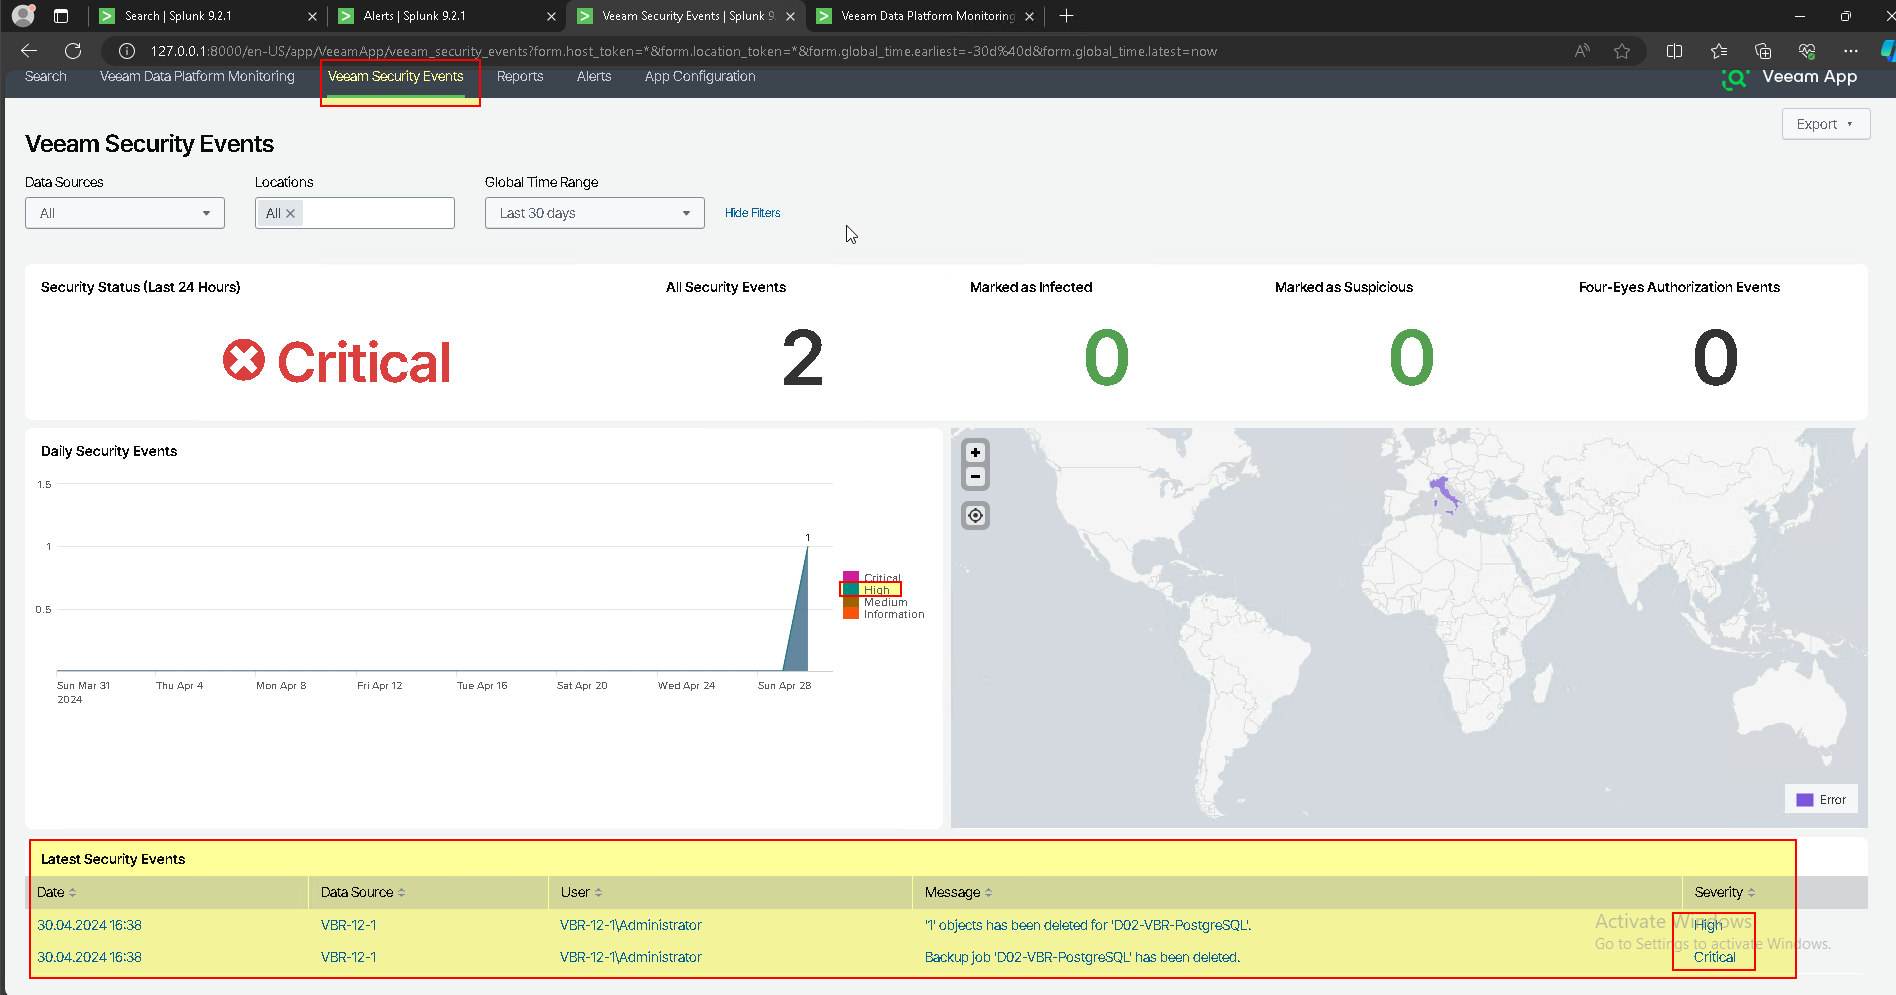

- Clicking on the alert takes us to the query search that generated the alert.

- Reports overview

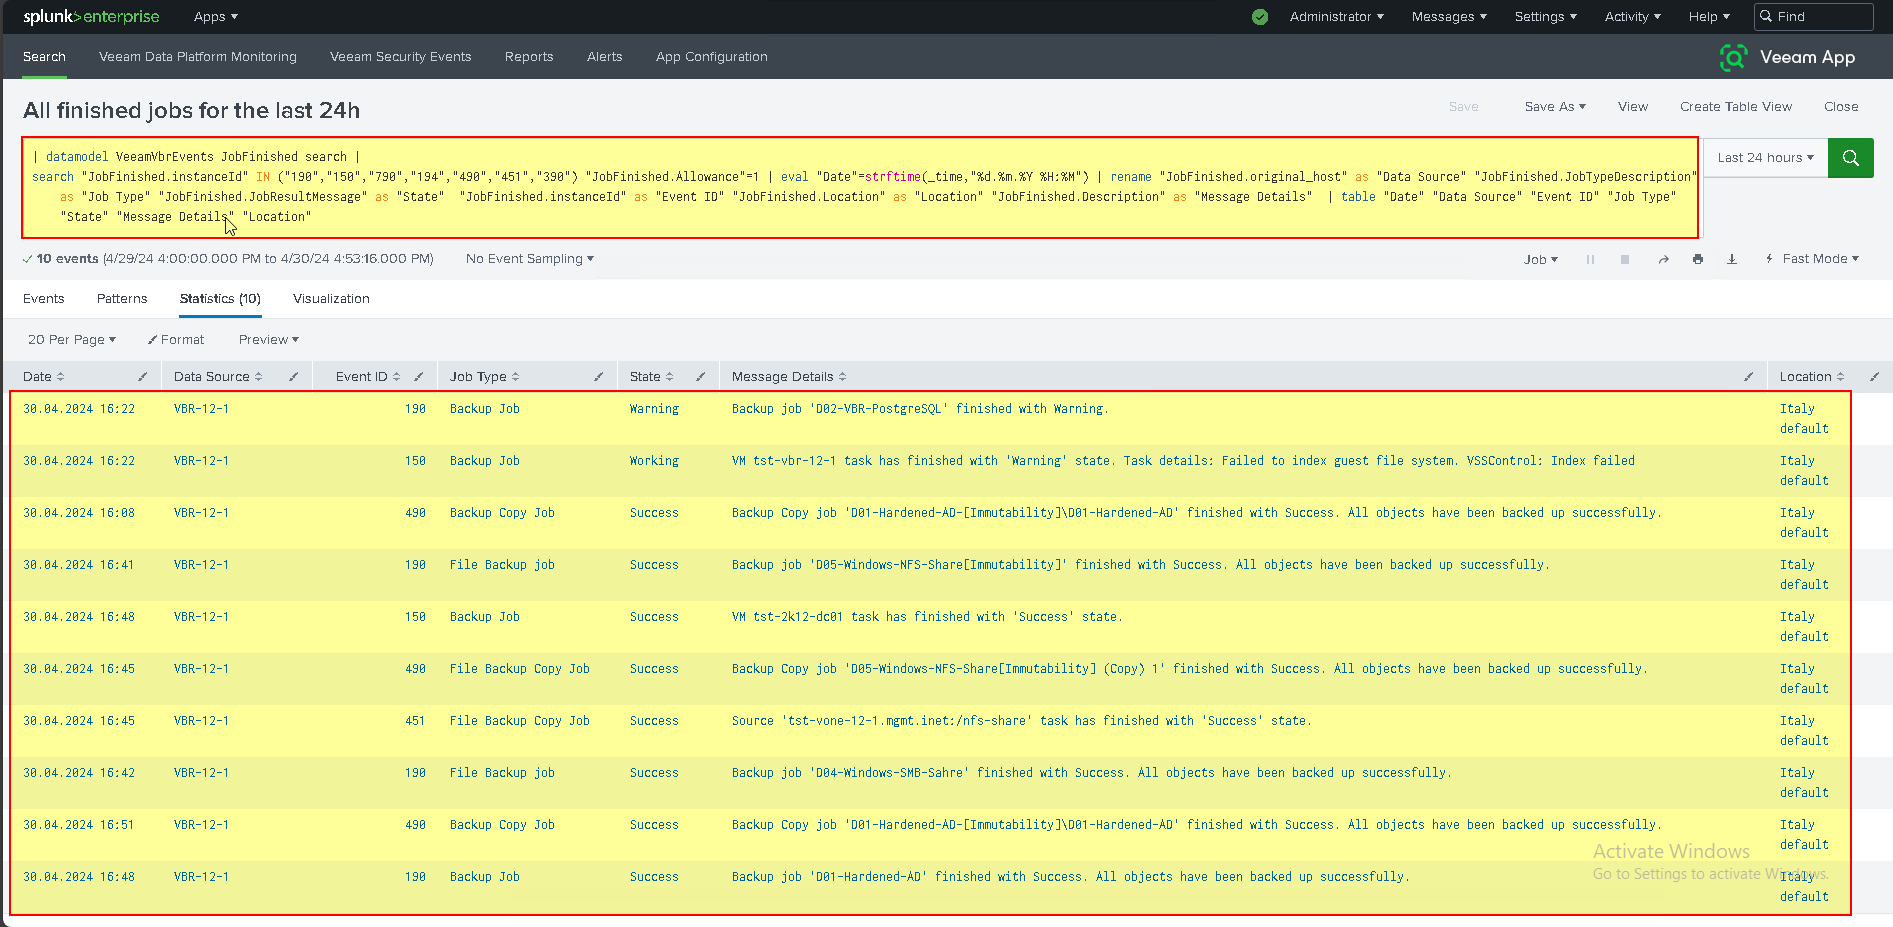
- How to create custom dashboard Report
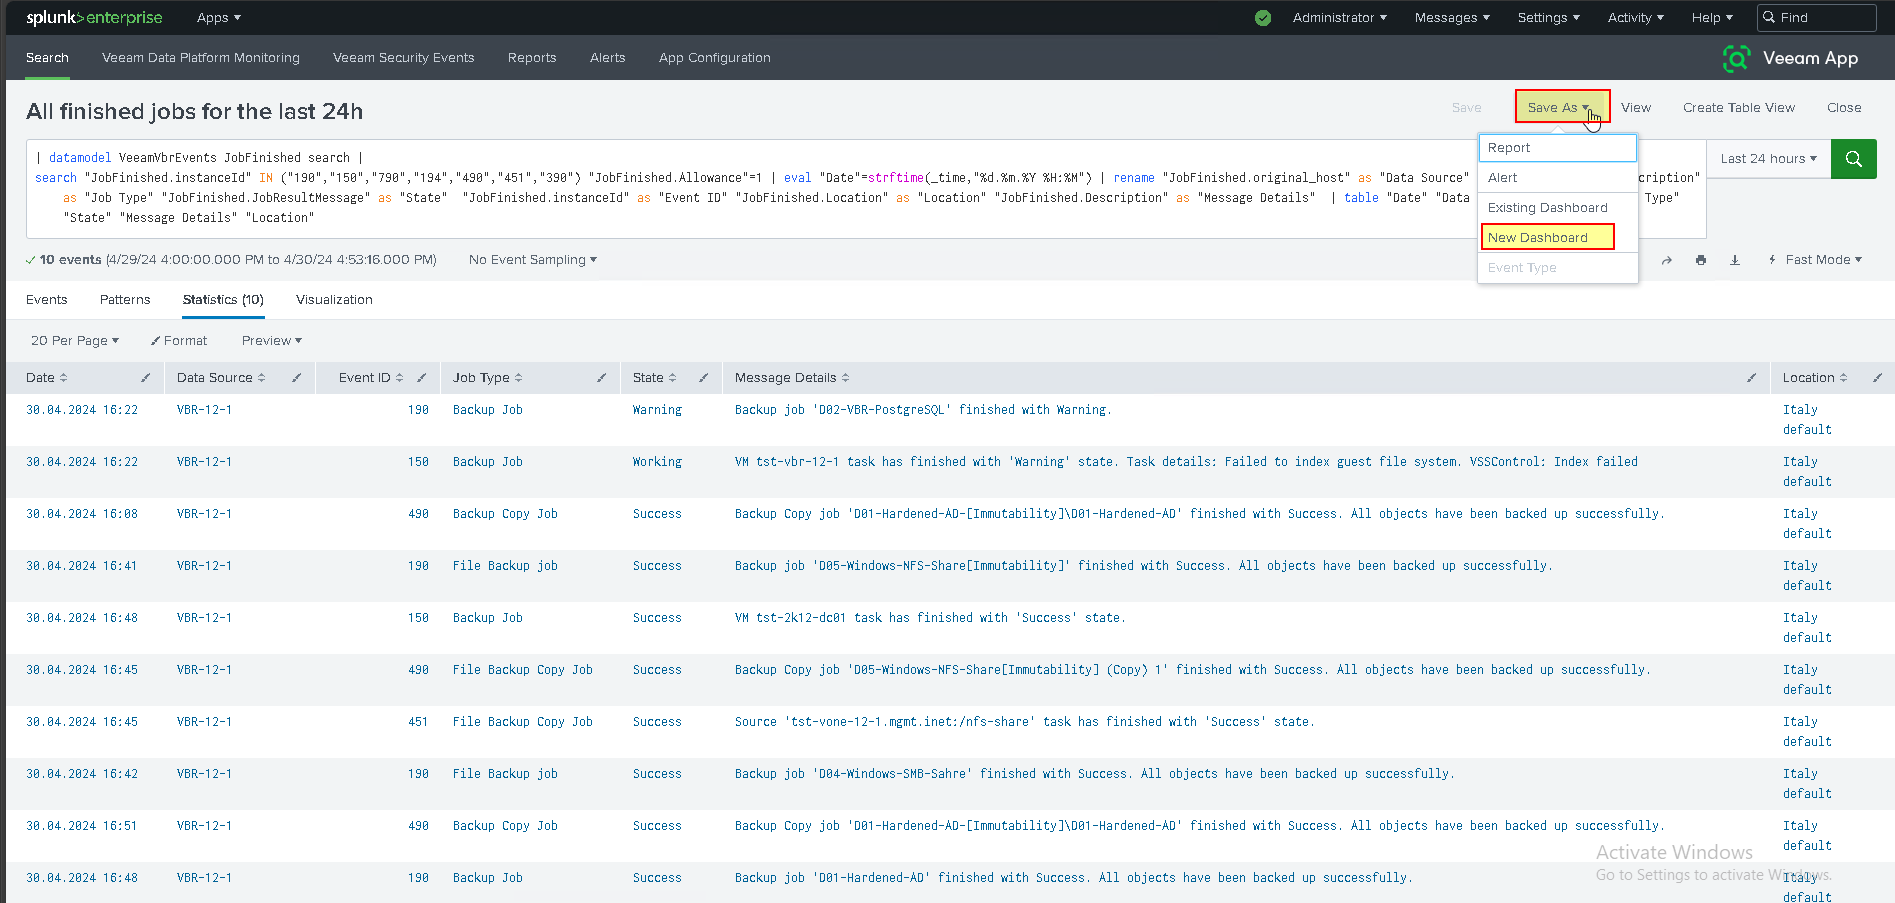
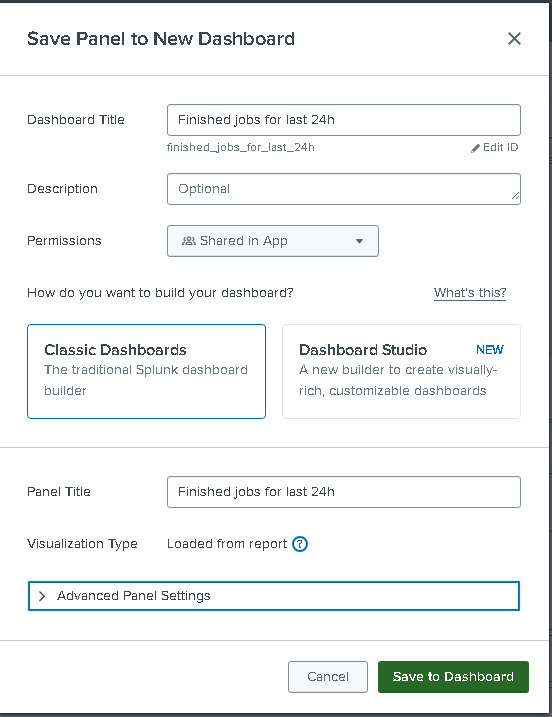
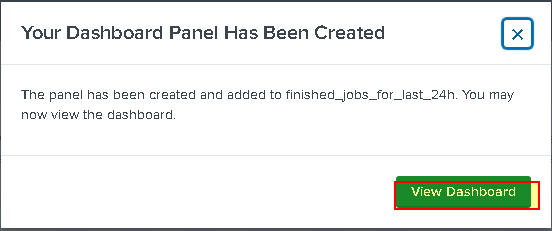
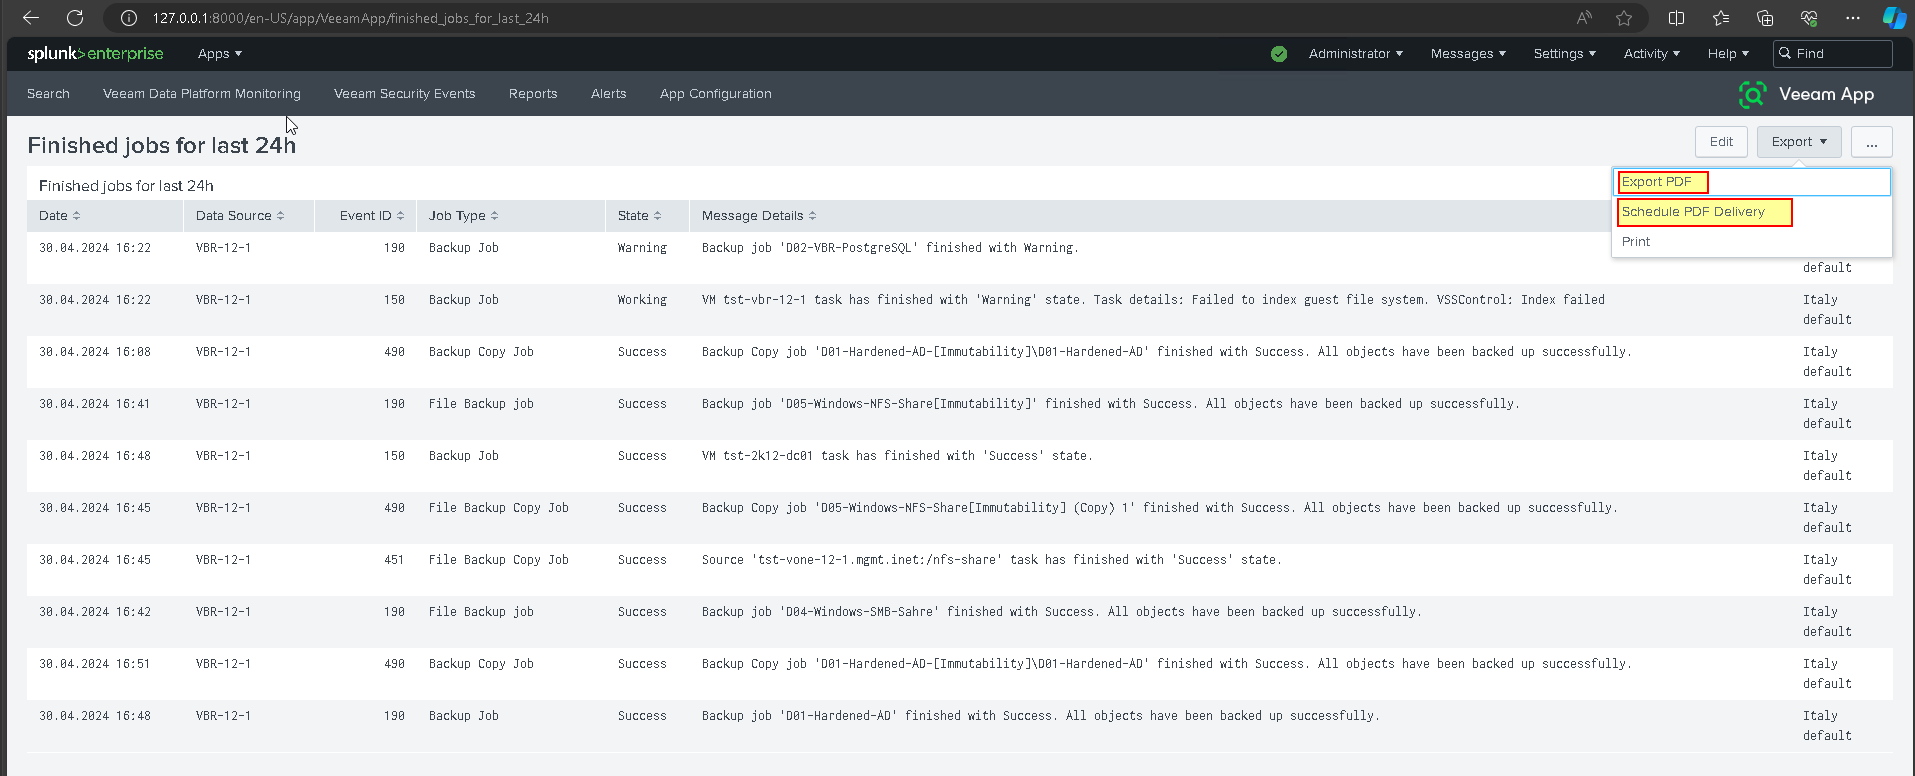
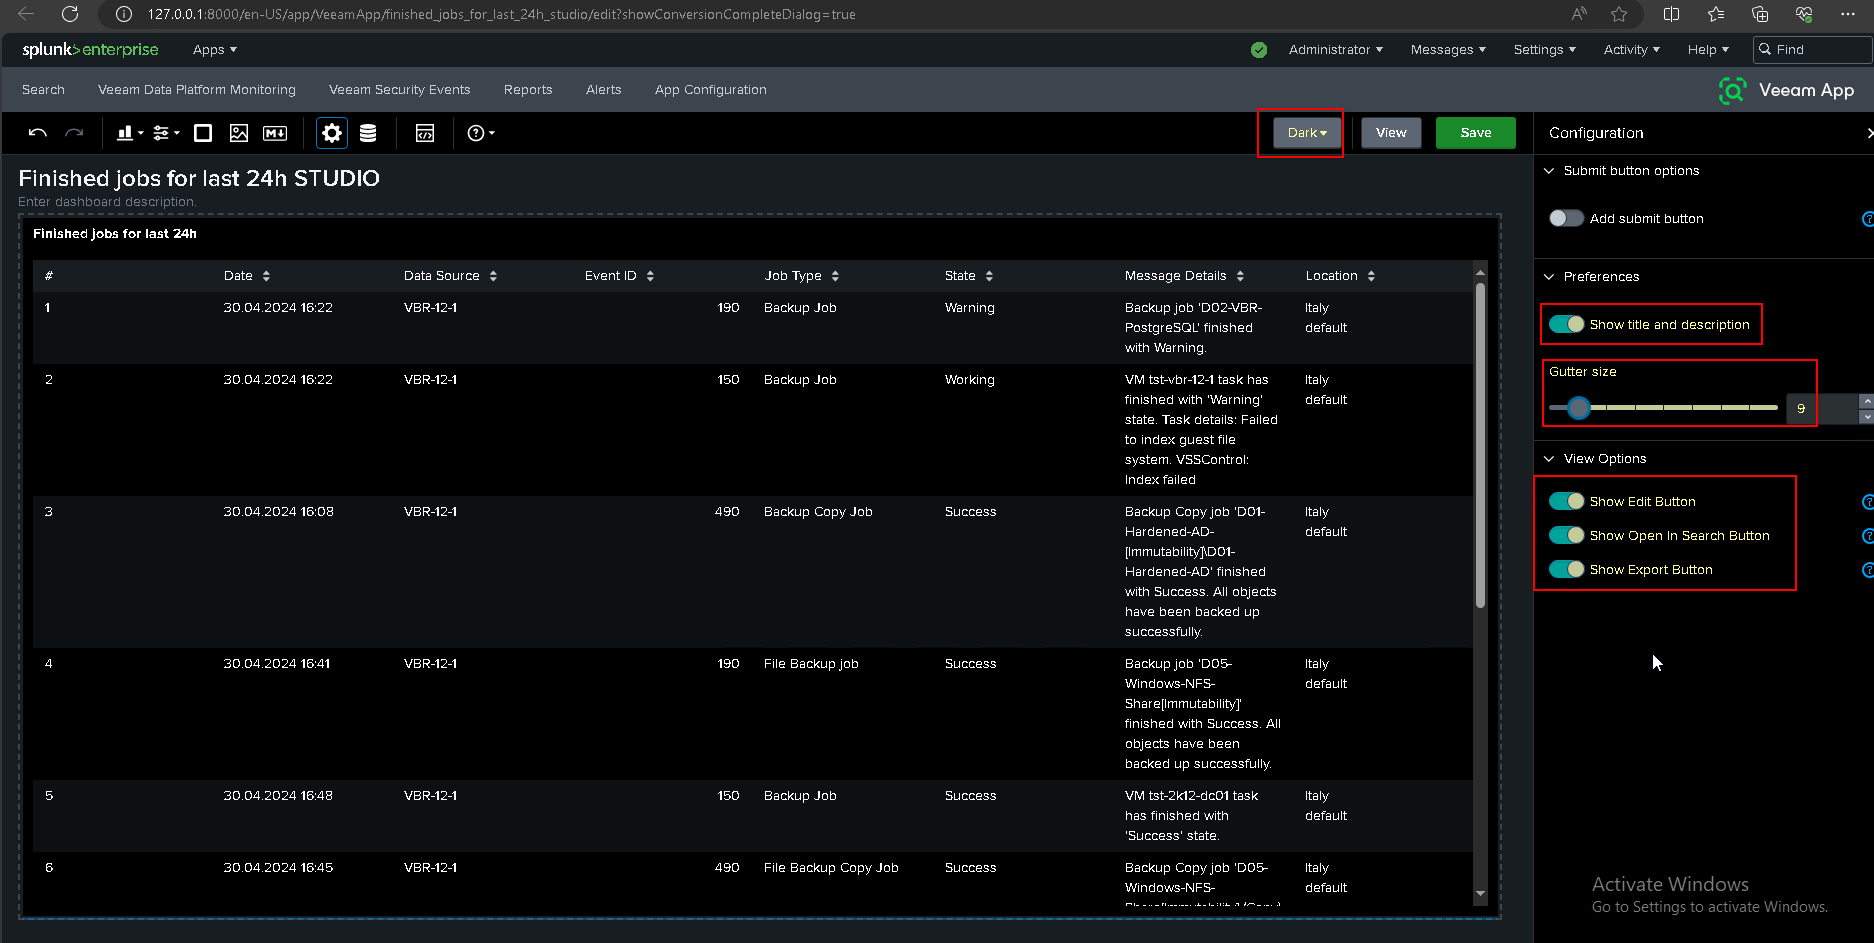
- Create the new Dashboard “Jobs finished in the last 24 hours” can be saved in a PDF report or scheduled.
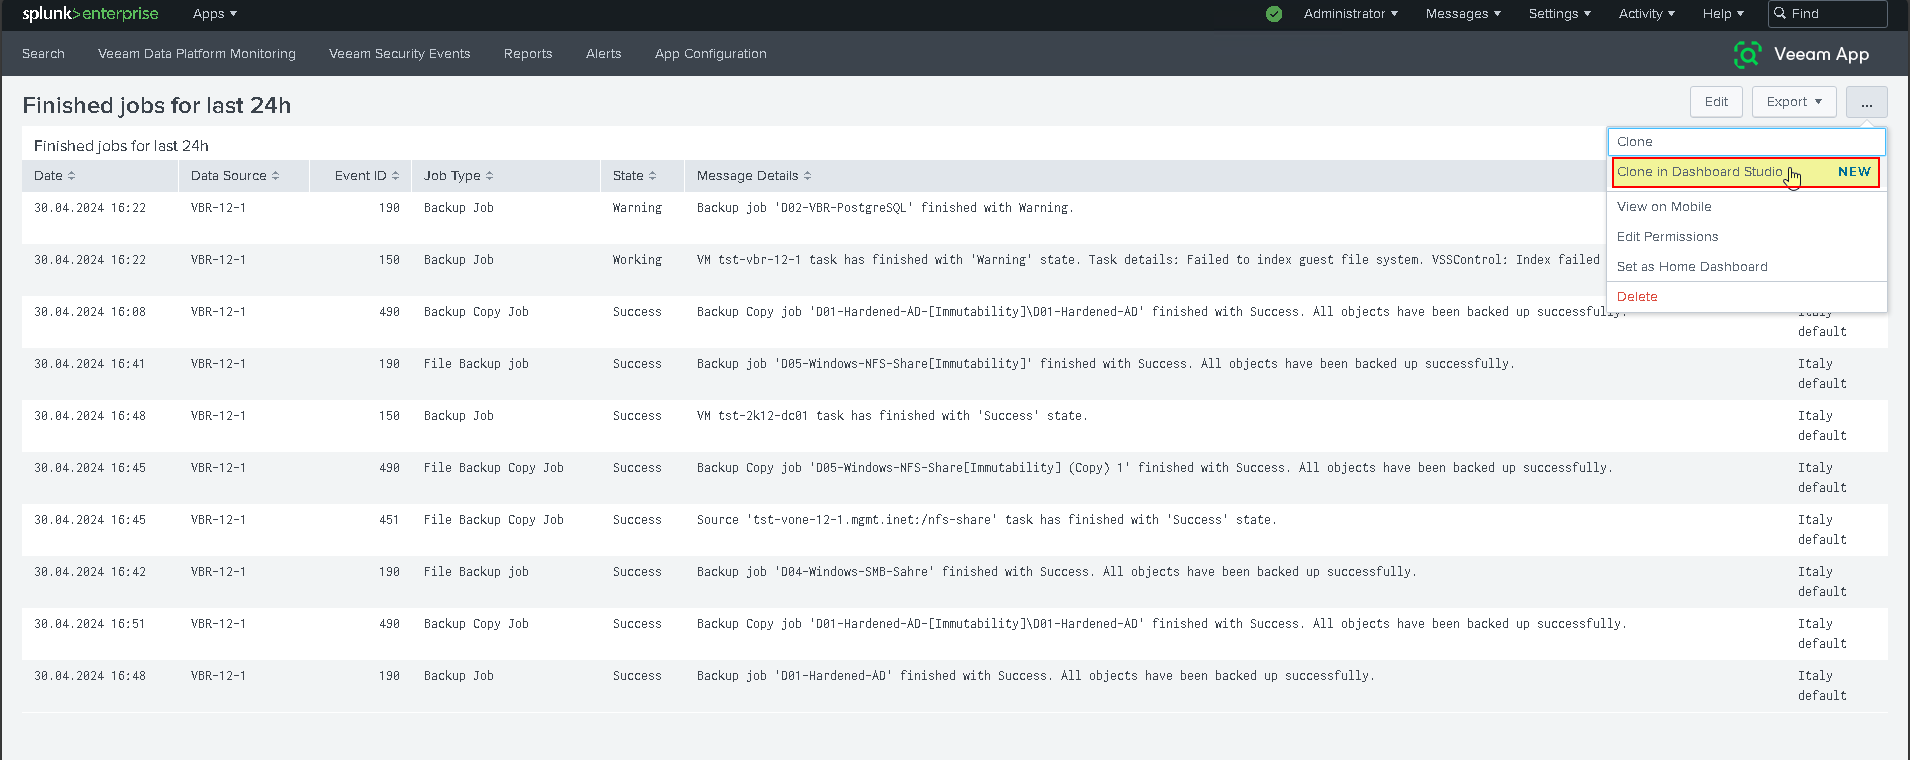
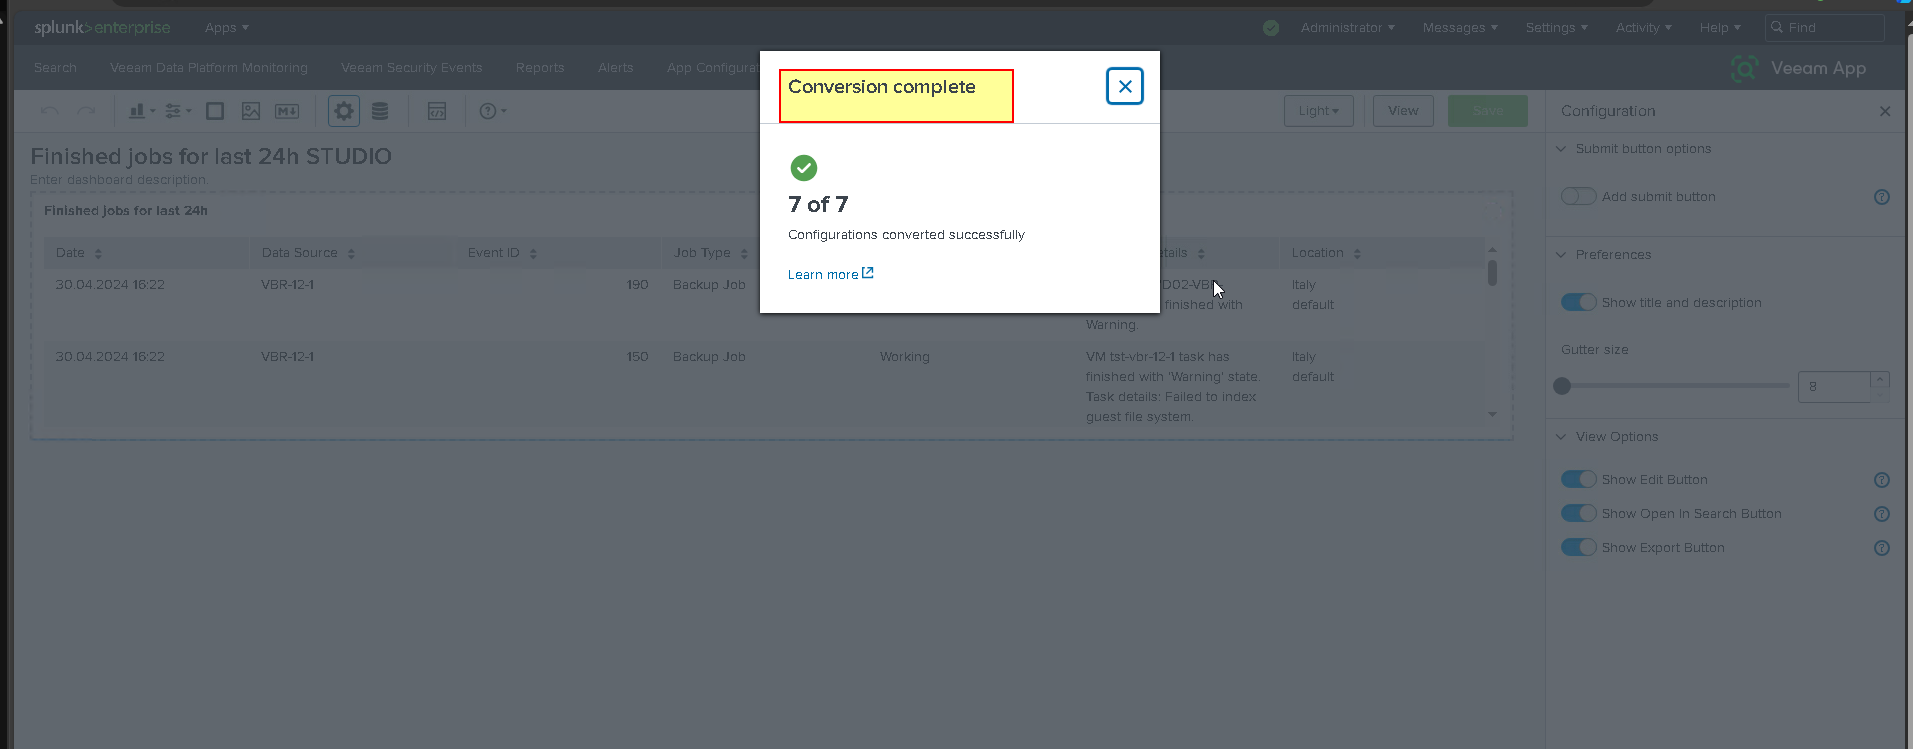
- You can convert Dashboardi to mode: Studio. You can also customize the new dashboard with the visuliaztion most congenial to you.

Have fun greetings to all.
Report to me if there are typos.
thanks


