
Greetings friends! I have seen this question popping up since VSA was released. How do we monitor VSA, or any other hardened appliance? There is a clear announcement about support for things like this, bear this in mind before you continue.
Grafana Dashboard for Veeam Software Appliance (Unofficial + unsupported)
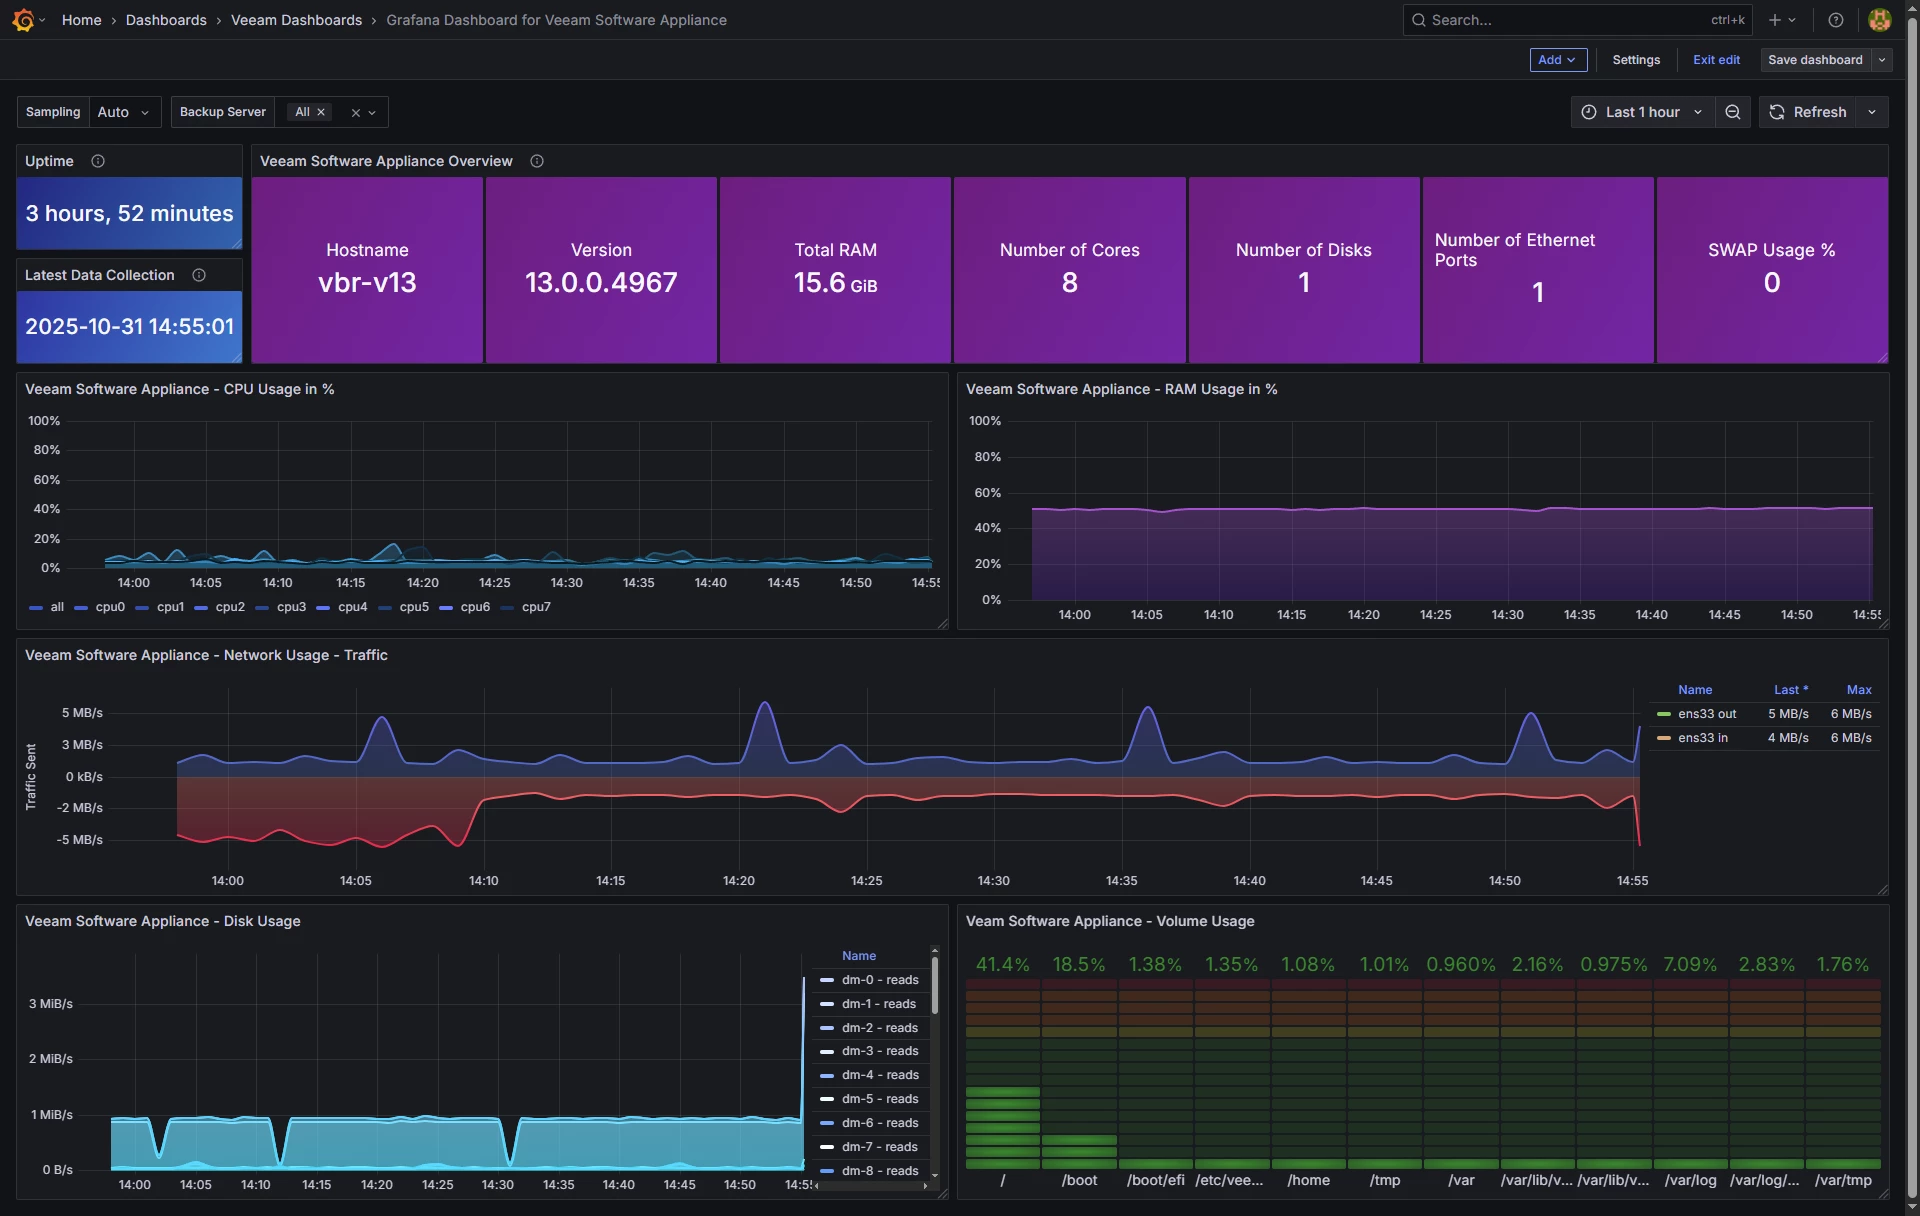
When you finish this article, if you follow all the steps, you should have something similar to this. It might be different according to your environment, number of days you select, etc.

Dashboard – Summary
- Uptime and Latest Data Collection – Two main widgets that will show us if everything is alright.
- Appliance Information Table – Another great set of information, including Hostname, version, RAM, etc. SWAP is dynamic, if you have anything more than 0% colors will change.
- CPU Usage – Always good to keep a good track of the CPU usage, the query is granular and shows the effort and pressure per Core
- RAM Usage – Bit simple, just showing the % of RAM used. Query can be modified to show it GB, etc.
- Networking – One of my favourites as it shows negative Y, making this virtualisation breeze to comprehend how much traffic is coming/going
- Disk Usage – Reads and writes, pretty comprehensive as it does per partition
- Volume Usage - Always important to keep an eye on all the particular VSA volumes, you surely do not want any of them reaching dangerous %, all colour code.
Let’s go
For the past few nights I was thinking on how to do this, as the statement is clear:
- Installing additional Linux packages
- Third-party applications
- Changing OS settings
So, I decided to prepare a simple bash shell that within the Host Admin privileges, BUT without root, can query /proc /sys and do some curl, all of these included natively on Rocky and in JeOS in particular.
Features
- Lowest privilege collection, works as any regular user (requires Host Manager role)
- No external dependencies, only standard tools present on Rocky Linux
- Prometheus-like metric names and labels for easy mental mapping
- InfluxDB v2 line protocol with per-section writes and debug logs
- Health check of Influx endpoint
- Optional dry-run mode for safe validation
- Version tag pulled from veeamtransport -v when available, with uname -r fallback
What is collected
| Area | Metrics (selection) | Labels |
|---|---|---|
| Time | node_time_seconds, node_boot_time_seconds | instance, serverName, version |
| CPU | node_cpu_seconds_total{cpu,mode} for each cpuN and cpu=all | cpu, mode |
| Load | node_load1, node_load5, node_load15 | — |
| Memory | node_memory_MemTotal_bytes, node_memory_MemAvailable_bytes, node_memory_SwapFree_bytes, etc. | — |
| Filesystems | node_filesystem_size_bytes, node_filesystem_free_bytes, node_filesystem_avail_bytes | device, fstype, mountpoint |
| Disks | node_disk_reads_completed_total, node_disk_read_bytes_total, node_disk_write_time_seconds_total, etc. | device |
| Network | node_network_receive_bytes_total, node_network_transmit_packets_total, *_errs_total, *_drop_total | interface |
| Temperatures (not available when virtual) | node_thermal_zone_temp_celsius when /sys/class/thermal is present | sensor |
Minimum Requirements (all inlcuded in JeOS)
- Rocky Linux or similar with
/procand/sys bash,awk,sed,grep,curl- Outbound access to your InfluxDB v2 endpoint
Installation
Did I already mentioned this is not supported, etc? Please refer to the KB before you continue.
Explore the GitHub content, and get the RAW shell script at hand, use notepad to avoid adding some formatting.
Let’s connect to SSH using veeamadmin, or any other local user with Host Management permissions, and run these commands to create the files and folders:
mkdir -p "$HOME/bin" "$HOME/logs" nano "$HOME/bin/veeam_appliance.sh"
chmod +x "$HOME/bin/veeam_appliance.sh"
Then create a .env which will be much secure to keep your InfluxDB Token safe, etc.
cat > $HOME/.veeam_influx.env <<'EOF'
INFLUX_PROTO=https
INFLUX_HOST=yourinfluxdbhost
INFLUX_PORT=8086
INFLUX_ORG="YOURORG"
INFLUX_BUCKET=telegraf
INFLUX_TOKEN="PASTE_YOUR_TOKEN_HERE"
CURL_INSECURE=true DEBUG=true # Optional
# DRY_RUN=false
EOF
chmod 600 $HOME/.veeam_influx.env
If all is good, now you can give it a try:
set -a
. $HOME/.veeam_influx.env
set +a

bash "$HOME/bin/veeam_appliance.sh" | tee -a "$HOME/logs/veeam_appliance_$(date +%F).log"
If everything is correct, you will be able to see something like:
[INFO] Checking InfluxDB health at https://veeamtech.ddns.net:8086/health
[INFO] InfluxDB health OK
[INFO] cpu: preparing to send 90 line(s)
[SAMPLE] node_cpu_seconds_total,instance=vbr-v13,serverName=vbr-v13,version=13.0.0.4967,cpu=cpu0,mode=softirq value=860.860000 1761842788978656645
[INFO] cpu: write OK (HTTP 204)
...
[INFO] Done.
It is time to cron this, do a crontab -e then press i and paste this:
* * * * * /bin/bash -lc '. $HOME/.veeam_influx.env; mkdir -p "$HOME/logs"; LOG="$HOME/logs/veeam_appliance_$(date +\%F).log"; /bin/bash "$HOME/bin/veeam_appliance.sh" >>"$LOG" 2>&1'
0 3 * * * /bin/bash -lc 'find "$HOME/logs" -name "veeam_appliance_*.log" -mtime +14 -delete'
Exit with :wq as usual with vim.
Grafana Dashboards
I have already spend the time building all the queries, variables etc for you. Just go to Grafana and download it, or use the ID:
- https://grafana.com/grafana/dashboards/24318
- If the Grafana is not loading, use the dashboard from Github - https://github.com/jorgedlcruz/veeam-appliance-monitoring/tree/main/node_exporter_bash
Import Grafana Dashboards easily
Knowing the Grafana dashboard ID, we can just import it:24318:
 And that’s it. With the menus on the top you can even show different VSAs, or VIAs, etc.
I think that from all the options to monitor a Linux system, this is the less problematic, as it is a simple unprivileged bash shell that collects some metrics and push them out to InfluxDB, so no opening ports, no packages, etc. Additionally, once you finished this, you can turn off SSH as the script will keep pushing data using CURL to the InfluxDB.
I do not guarantee that this file will remain when an upgrade happens, etc. As said, use under your own responsibility, better just for lab :)
Please leave your feedback in the comments, or on GitHub.