Unofficial, community-built tool — not an official Veeam product and not supported by Veeam Support. Results are estimates derived from a parsed log and should be validated against the official Veeam calculators, the Veeam Help Center, and Best Practices documentation. For final sizing decisions, loop in a Veeam SE / Solution Architect.
When reviewing a Veeam environment— usually because there's a sizing conversation coming, or someone wants a second opinion on whether a setup is sane. And almost every time, the information I actually need is sitting right there in the VMC.log. Proxy count, repository layout, retention, GFS, agent jobs, whether immutability is on, what the NICs are doing. All of it.
The problem is it's buried in a few thousand lines of log, and after the third or fourth time of Ctrl-F-ing my way through one of these to pull out proxy task counts and squint at retention policies, I got tired of it.
So I built something to do the reading the log file for me.
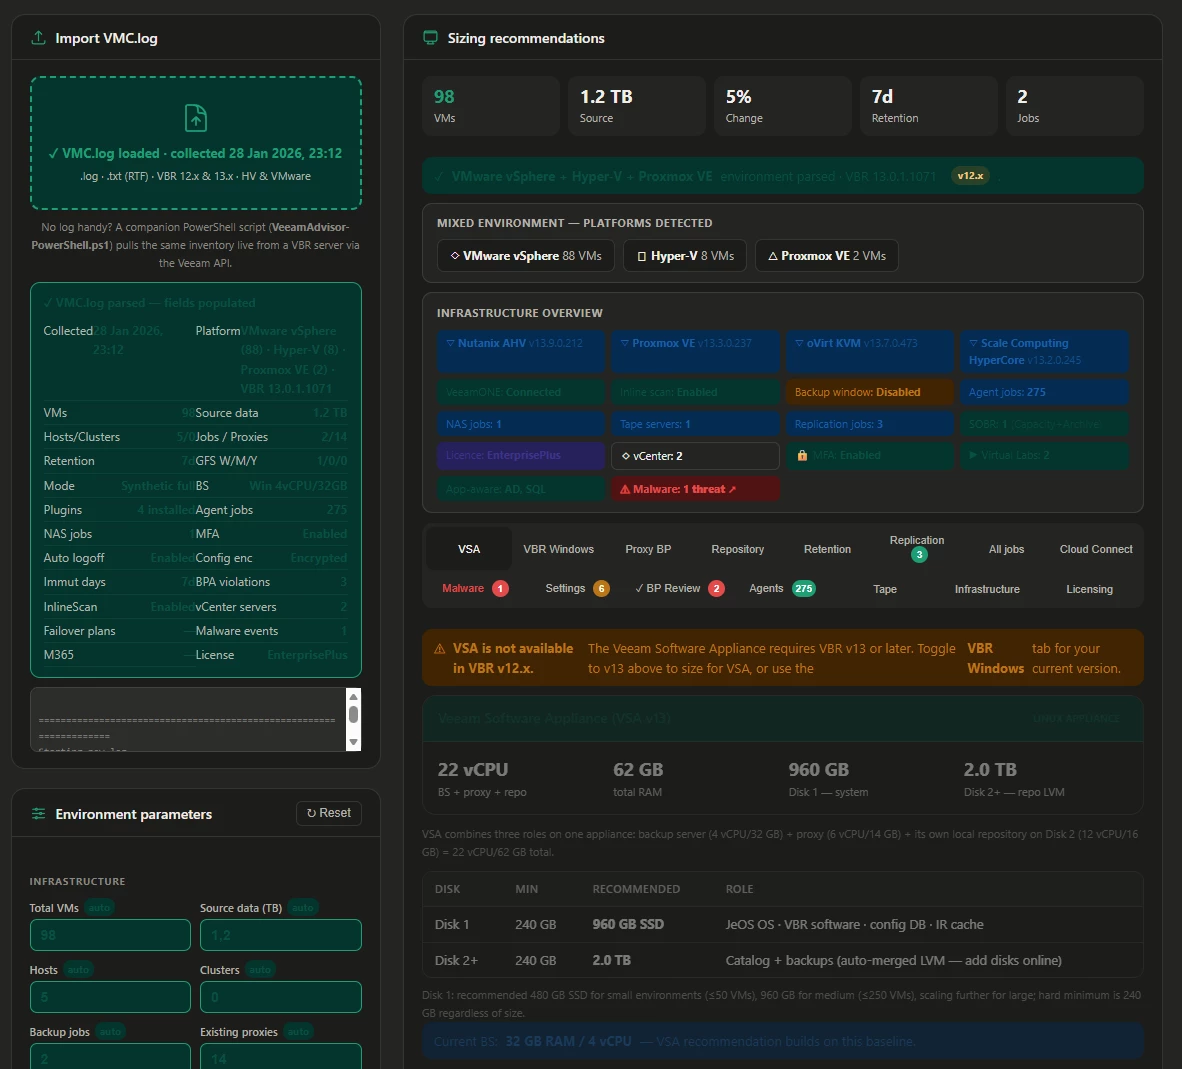
It's called Veeam Advisor. It's a single HTML file that parses a VMC.log and gives you back the environment in a form you can actually use — sizing recommendations, a best-practice review, protection coverage, the lot. It's free, and I'll put the link at the bottom.
One thing I want to mention first, because for a backup audience it's the bit that matters: it runs entirely in your browser. There's no server, no upload, no "drag your customer's infrastructure detail into some random website." The log file is read locally by the browser and never leaves the machine — no fetch, no upload, nothing goes out over the wire.
Personally, I'd be uncomfortable using a tool that worked any other way with customer data, so this one doesn't.
The source is on GitHub if you want to verify that for yourself rather than take my word for it (link below).
What it pulls out
Drop a log in and it figures out whether you're looking at a Windows VBR or the appliance (VSA), the platform (VMware, Hyper-V, Proxmox, AHV), Cloud Connect if there's any, every proxy with its task counts, repositories and SOBRs, all the job types, replication, agent jobs, GFS and retention, malware/threat events, and the security posture — MFA, immutability, config-backup encryption, and so on. Then it lays it out across a set of tabs and adds a sizing calculator and a best-practice review on top.
How to use it
1. Get a VMC.log. This is the log the backup server produces. Easiest way is to export logs from the console (Help → Support Information), and you'll find VMC.log in the bundle. It's also sitting in the logs folder under ProgramData on the VBR server if you'd rather grab it directly. One thing worth knowing — if you've just created or changed a job, run it once so it has a restore point before you export, otherwise the freshly-made job won't show up in the collection yet. (Learned that one the hard way.)
2. Open the tool and drag the log onto it. That's genuinely it. The drop zone is the big box in the middle. It parses in a few milliseconds — even a 4MB log is basically instant, because nothing's being uploaded, it's just reading off your disk.
3. Read the tabs. A few I find myself using the most:
- BP Review — the compliance findings, sorted by severity. This is usually the first place I look. It'll flag things like no backup copy job (3-2-1 not satisfied), no SureBackup, MFA off, immutability not set.
- Protection coverage — compares the VMs it can see in the infrastructure against what's actually covered by backup jobs and agents, and gives you an estimated unprotected count. Big caveat on this one, see below.
- Tape — if there's tape, it shows you what's there (servers, drives, libraries, GFS vs regular media pools). If there isn't, it'll size a GFS tape job for you across LTO-7/8/9. It uses native capacity, not the compressed marketing number, because Veeam backups are already compressed and you get basically nothing from tape hardware compression on top — a detail that trips people up constantly.
- Infrastructure — a one-screen inventory of the whole environment mapped against the Veeam best-practice design areas. Handy for "what am I even looking at" before a call.
4. Export a PDF if you want something to send back. The report includes both the date you generated it and the date the data was actually collected, so there's no confusion later about how stale the numbers are.
I’m working on a Fleet View version if you've got several servers — drop multiple logs and it gives you a comparison across the estate.
The part I actually use it for: "what if" sizing
Note: always use the official Veeam tools valid any output.
Reading the log is half of it. The other half — and the reason it earns a spot in my bookmarks rather than being a one-off curiosity — is that once a log is loaded, every sizing input is editable, and the recommendations recalculate off whatever numbers you put in.
When you drop a log, it pre-fills the inputs from what it found: VM count, data size, host and cluster count, job count, retention, GFS, NIC speed, existing proxy count. But none of those are locked. Change any of them, hit Calculate, and it works the sizing again. That turns it from a viewer into a planning tool, which is where the real conversations happen:
- Proxies. It works out how many backup tasks your data volume needs to fit the backup window over the NIC you've got, then how many proxies that takes (it sizes virtual proxies at 6 vCPU / 14 GB, capped at 12 tasks each), and compares that against how many are actually deployed. So you can sit there and go "right, what if the customer doubles their VMs?" — bump the VM and TB figures, recalculate, and watch the proxy count and the per-proxy vCPU/RAM move. Or "what if we shrink the backup window from 8 hours to 4?" — same thing, you immediately see whether the current proxies still cope or whether you're adding iron.
- VBR server CPU and memory. The backup server sizing scales with concurrent jobs (it works on roughly a core and a few GB of RAM per ten concurrent jobs, on top of a base), and it takes the detected server spec as the floor. Add jobs, or grow the estate, and you can see the point where the current VBR box runs out of headroom and needs more cores or RAM — before it becomes a 2am problem rather than a planning one.
- Repository and growth. Same deal — change retention or GFS or the change rate and the capacity figure and the storage-growth projection move with it.
That's the bit I find genuinely useful for partner conversations. Instead of "here's what you have," it's "here's what you have, and here's what happens to your proxy and backup-server sizing if you grow the way you're telling me you're going to." You're modelling the impact live in front of the customer instead of going away to build a spreadsheet.
It also works the other direction — you don't need a log at all. Type the numbers straight in and it'll size a greenfield environment for you.
If you can run PowerShell on the box, there's a better option
The log-reading approach is great when someone's emailed you a VMC.log and you can't touch their environment. But if you've got console access to the VBR server itself, there's a companion PowerShell script that skips the log entirely and pulls everything live, straight from the Veeam API.
It's the same set of insights — managed servers, VMware and Hyper-V proxies, repositories and SOBRs, every job type, agent jobs (both managed-by-server and the policy/legacy kind), Cloud Connect tenants, backup copy, SureBackup, tape jobs, plus the protection-coverage estimate and orphaned/disabled-job detection. The difference is it's reading the current state of the running server rather than whatever was true when the log was exported, so there's no "is this data stale" question.
Grab the script from GitHub — view it / browse the source, or download it directly (right-click → Save As, or Invoke-WebRequest it straight onto the box) — then run it on the VBR server (or point it at a remote server / VSA appliance by hostname or IP — it'll prompt for credentials):
.\VeeamAdvisor-PowerShell.ps1[View the Veeam-Advisor/README.md for additional parameter]
It writes everything to the console and to a timestamped results file you can keep or send on. It's Windows PowerShell 5.1 compatible, enforces TLS 1.2, and — relevant if you're on v13 — it's been sorted for the v13 connection change. (When Veeam moved the identity handshake to a different port in 13, the old Connect-VBRServer on the classic port threw a "Failed to connect to Identity service" error even on a perfectly healthy server. The script falls back automatically now, so it connects against both v12 and v13. That one cost me an afternoon of head-scratching on a real v13 box before I worked out what was going on.)
So: web tool for reading a log someone sent you, PowerShell script for live data when you're on the server. Same picture, two ways in.
What it is not
Worth being straight about this. It is not a replacement for any Veeam official tools.
The protection coverage number in particular is an Estimate Only derived from the log — if it tells you 51 VMs are unprotected, treat that as "go check," not gospel.
For the exact list, the Veeam ONE Protected VMs report is the source of truth. The sizing is planning-grade too: it's based on provisioned sizes and standard assumptions, so validate against real backup sizes before anyone signs a PO off it.
While talking to
The official Veeam calculators are the always first, go-to source; this is a second opinion an additional possible scenario to weigh alongside the official one, not a substitute for it.
That's exactly the right way to think about it.
Think of it as a fast first pass — the thing that turns a wall of log into a conversation in about ten seconds — not the final word.
Where to get it
It's live here, free to use, nothing to install:
https://victorious-beach-03fc63910.7.azurestaticapps.net
Source is on GitHub:
https://github.com/JasonOrchard-IMNZ/Veeam-Advisor
I've tested it against a fair pile of real-world logs across VMware and Hyper-V, single-server and appliance, with and without tape, agents, Cloud Connect — and validated the trickier bits (the agent job types especially) against a production v12 & v13 server.
But every environment is weird in its own special way, so if you throw a log at it and something looks off, I'd genuinely like to hear about it. Tell me what it got wrong and ideally what the log looked like and I'll have a look.
Hope it saves someone else the Ctrl-F grind.