These diagrams are a sample of what I am working on in PowerShell for the next version of the Veeam.Diagrammer module. I am mainly working on generating diagrams of the Cloud Connect infrastructure and the composition of resources used by the tenants.
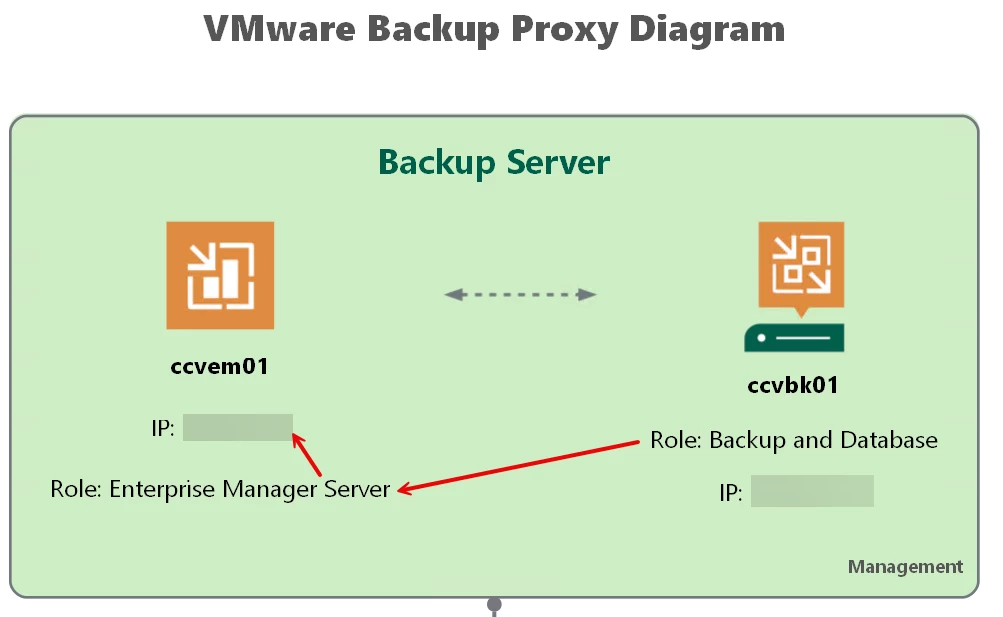
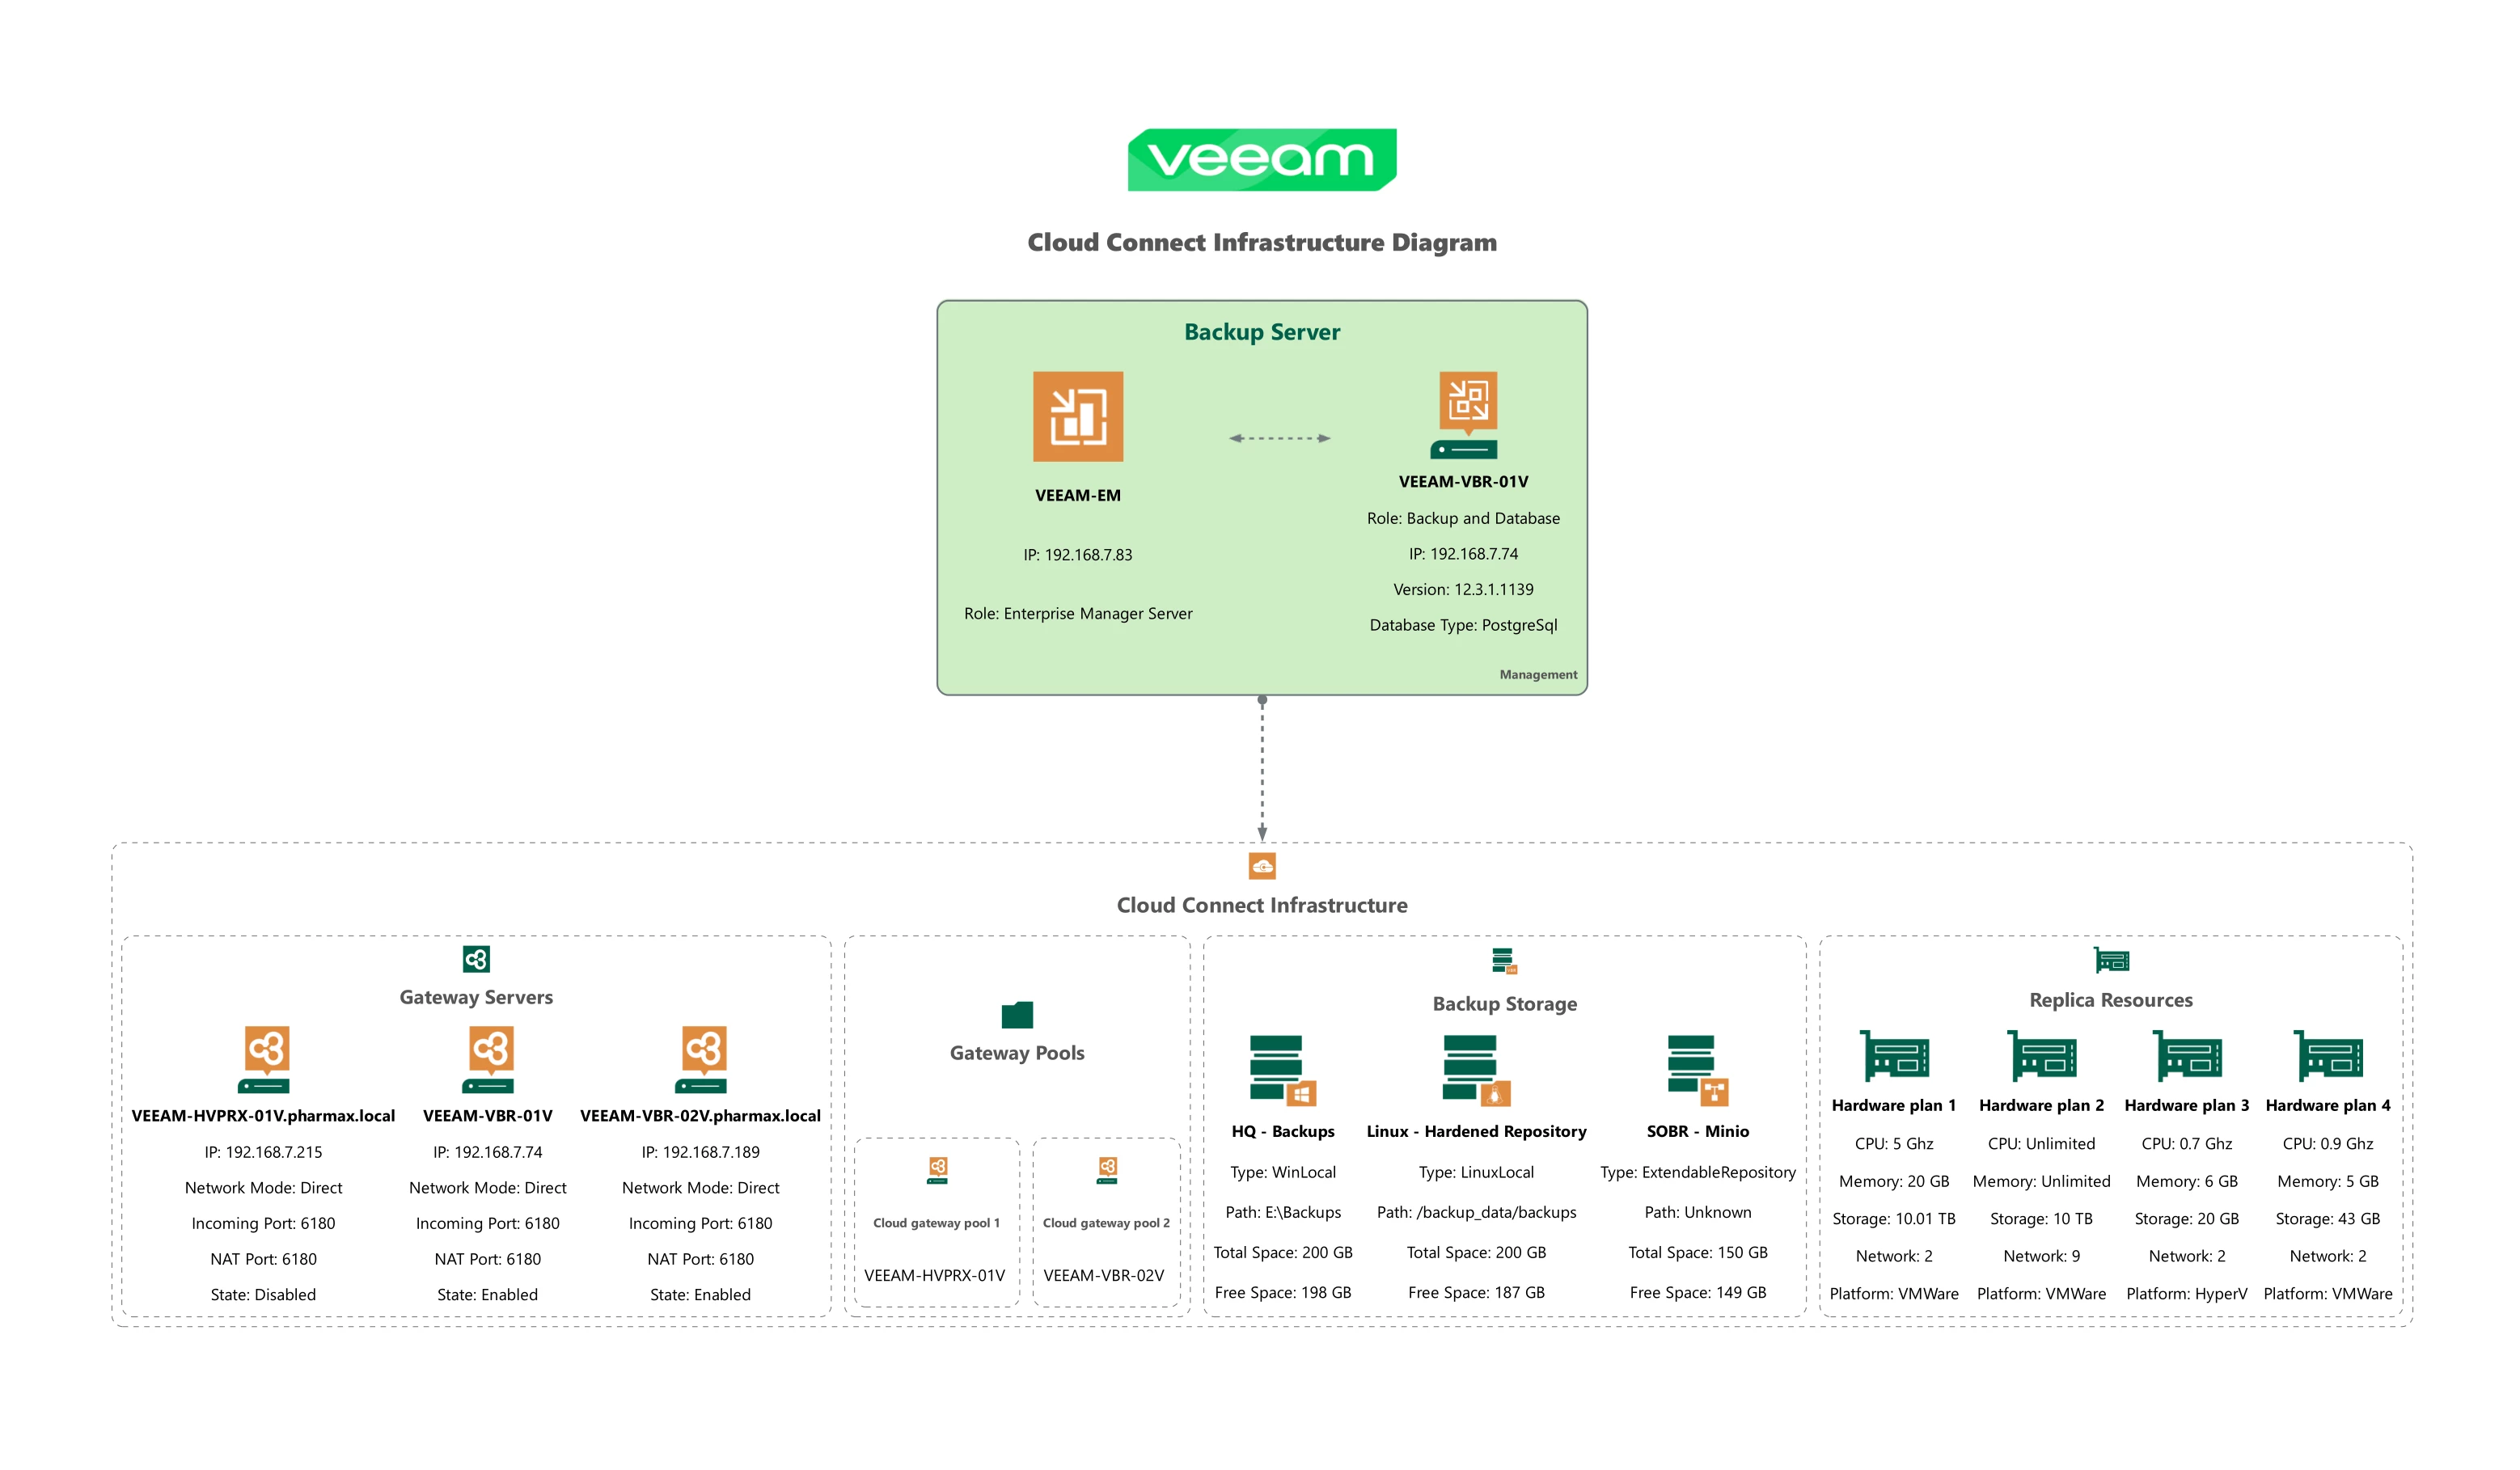
Cloud Connect Infrastructure:
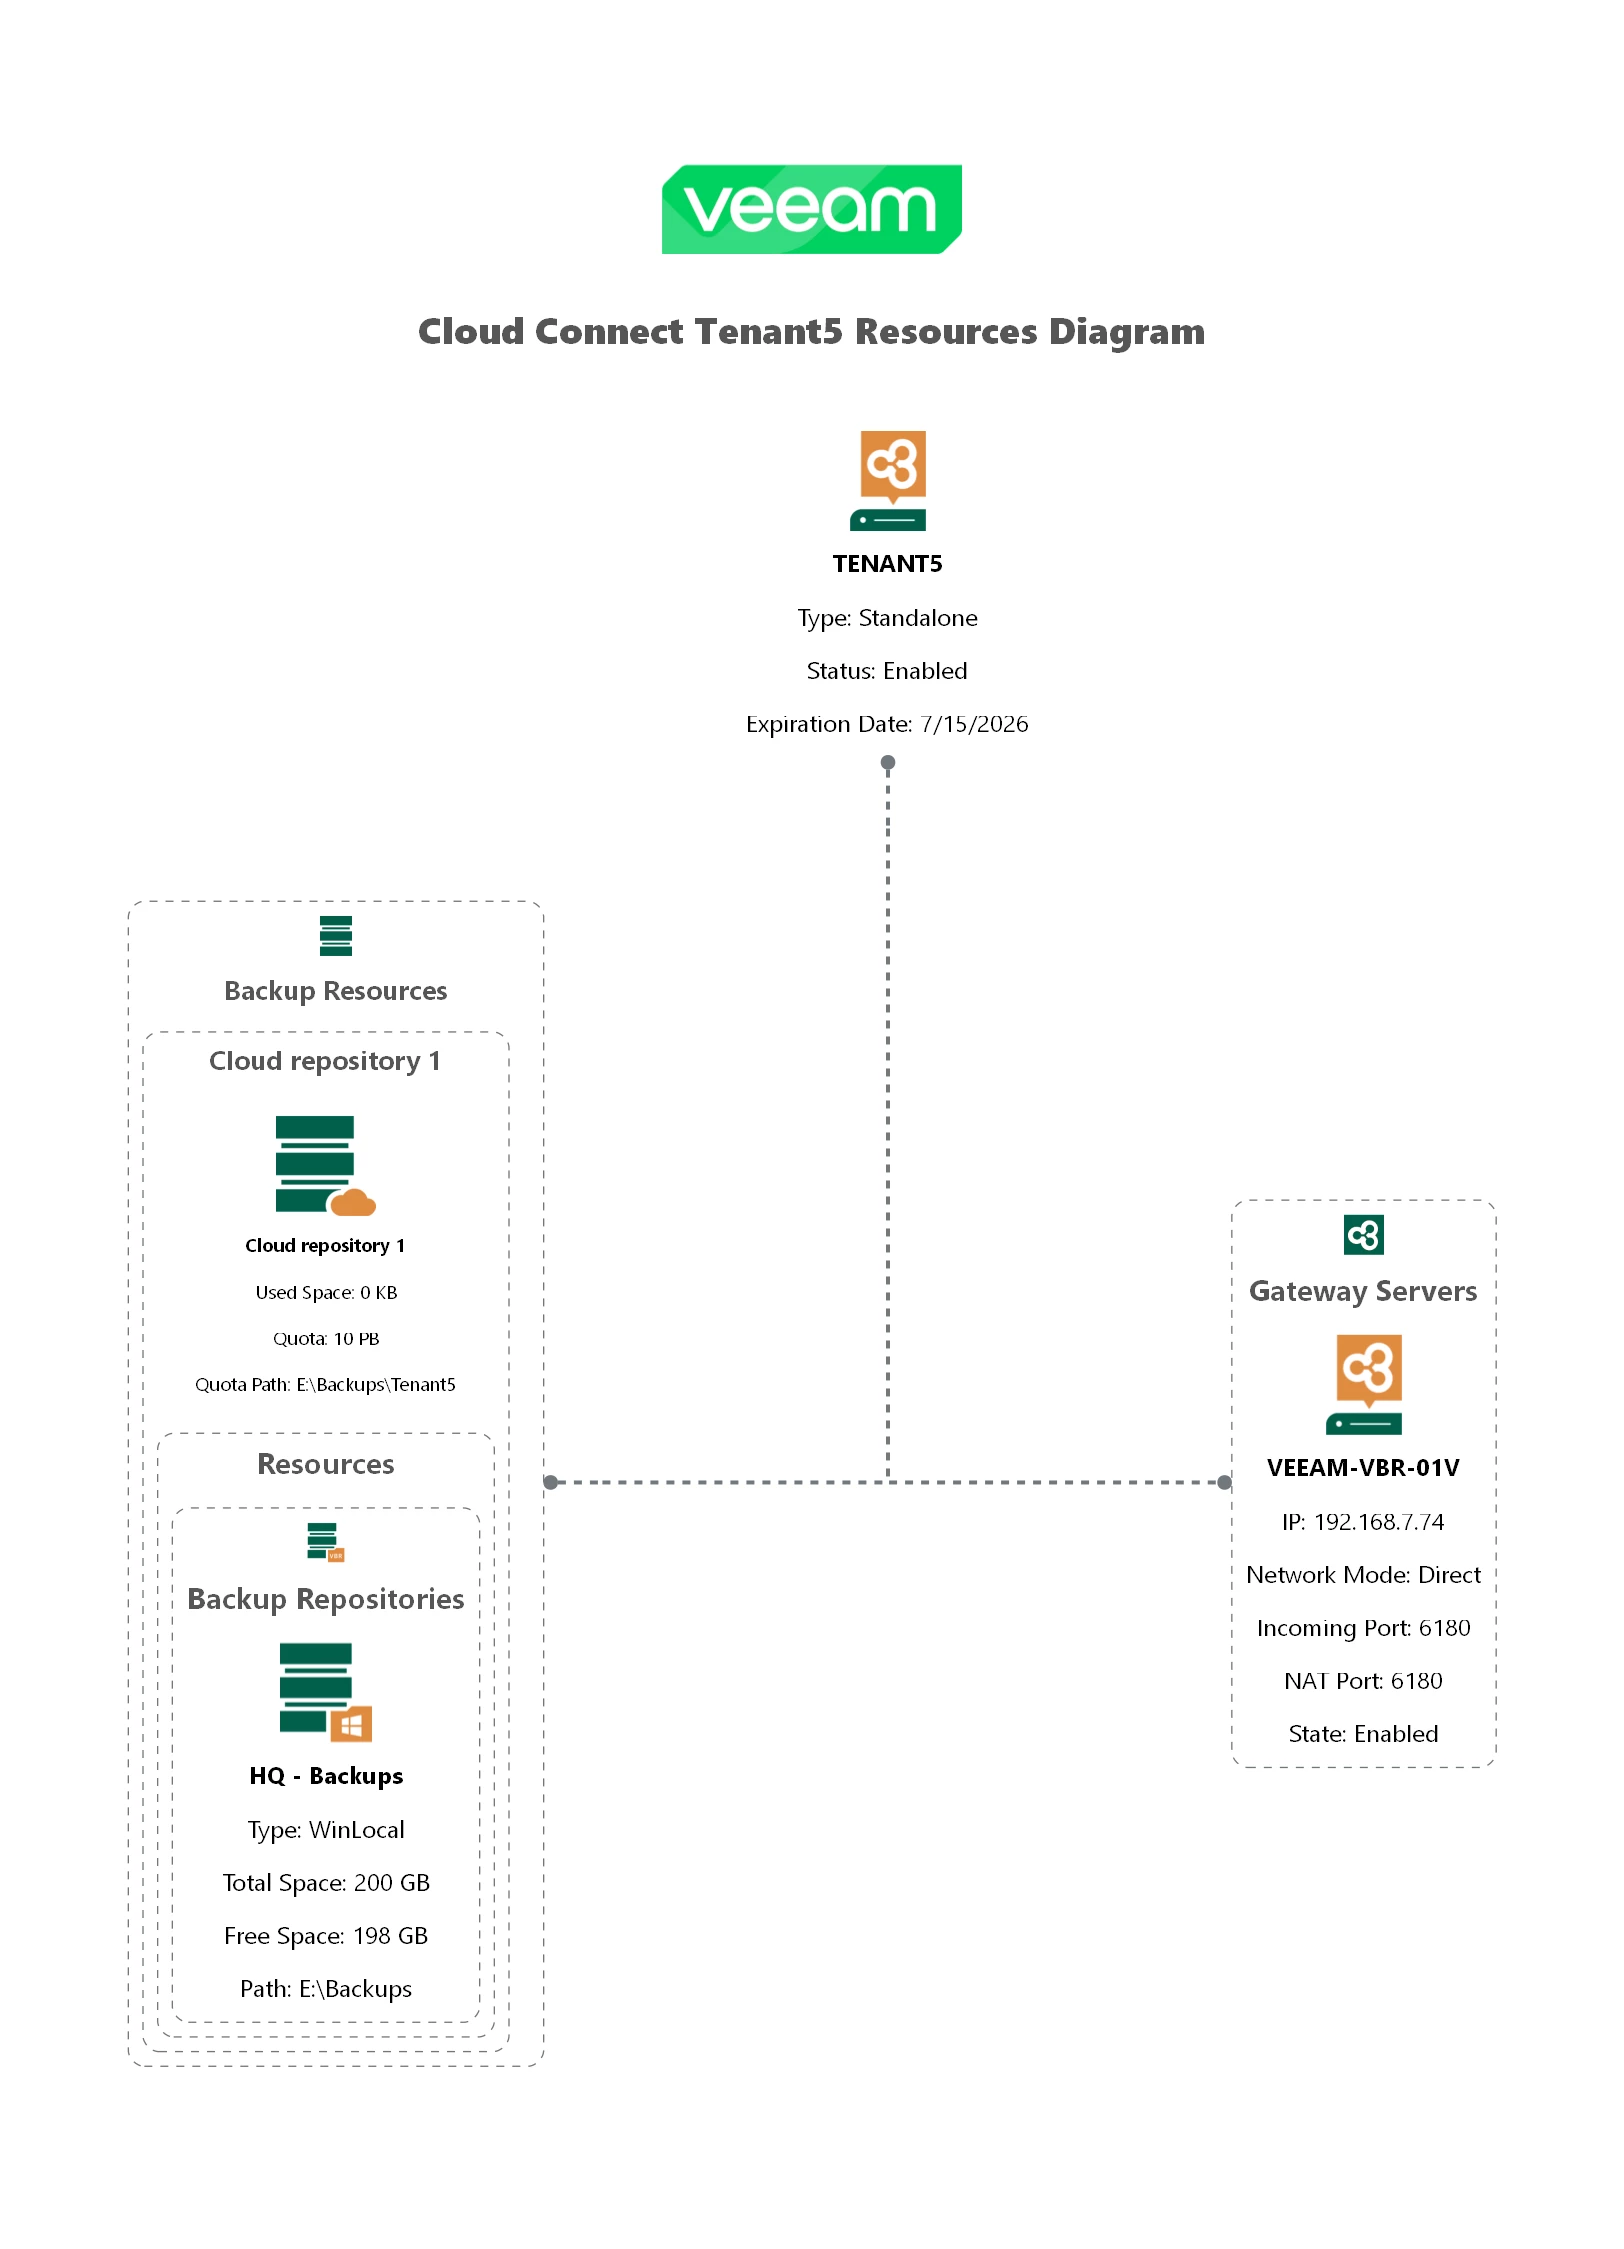
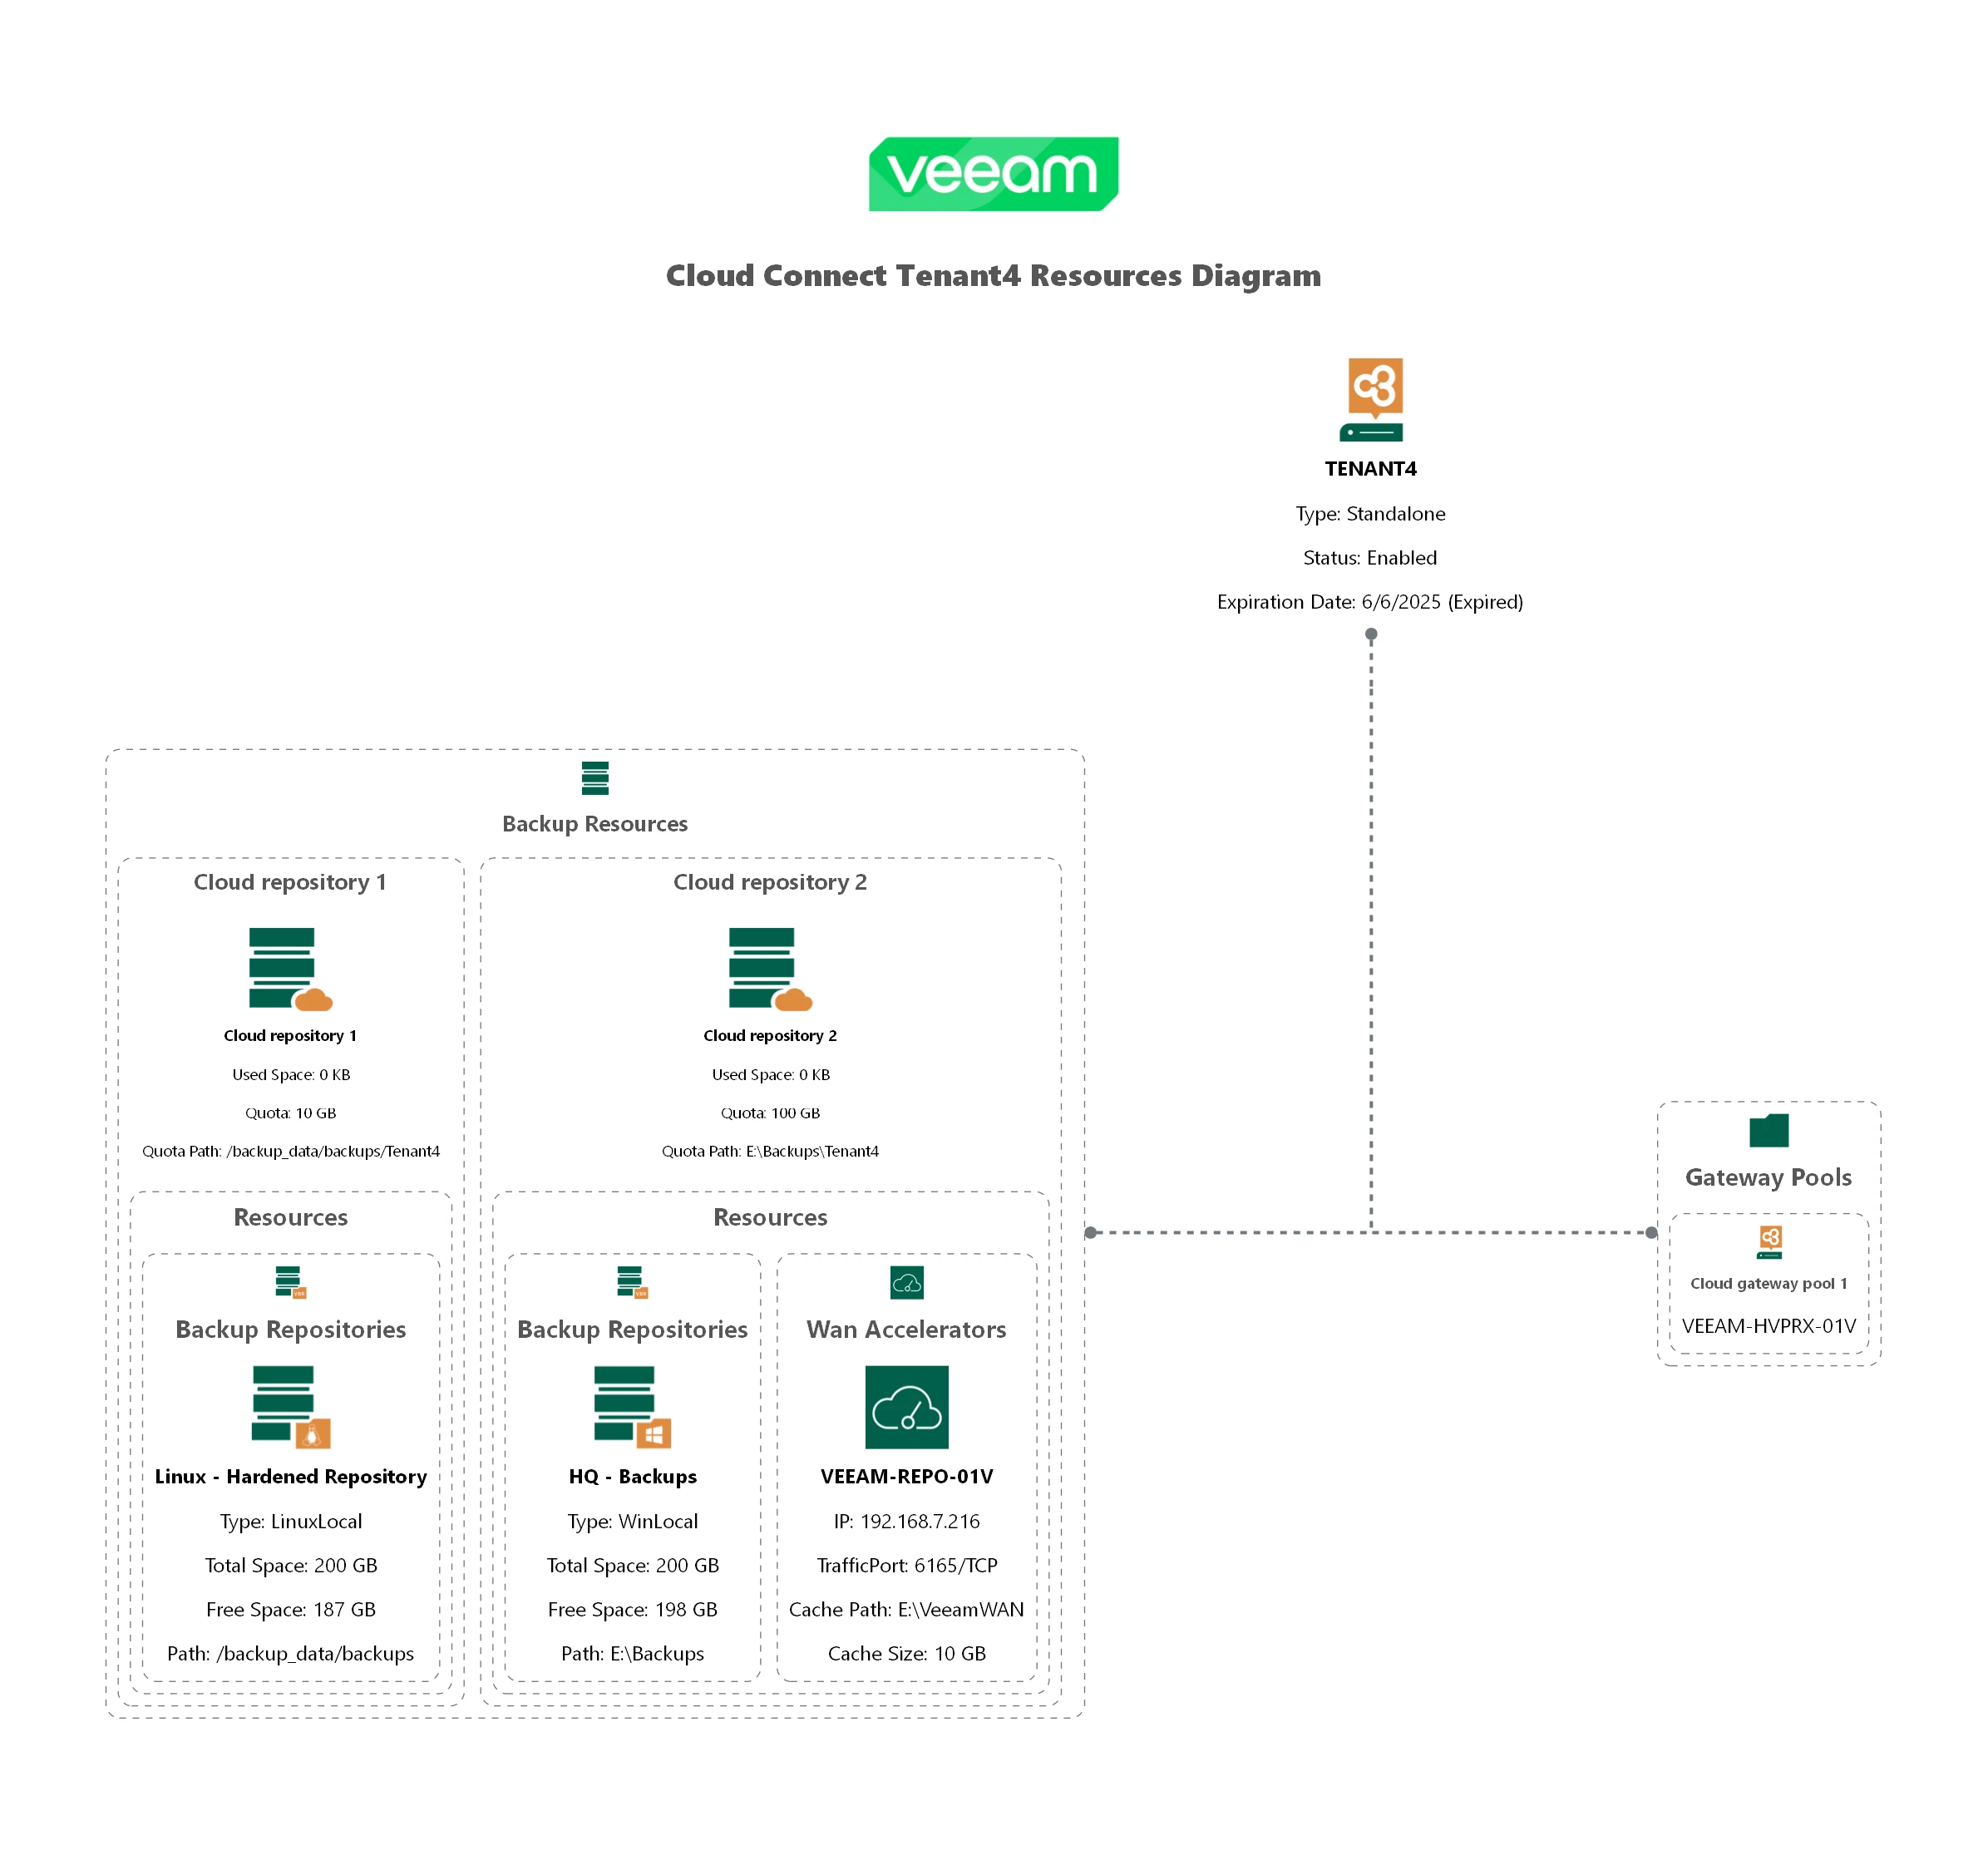
Per Tenant diagram:
These improvements will also be part of the next version of the AsBuiltReport.Veeam.VBR report.
The upcoming versions are going to be amazing!!!!!