Fooling around with Kasten Prometheus Server


Userlevel 7
Badge +22

Hi Everyone,

Lets take a peak in the Kasten Prometheus server that comes with the default Kasten deployment.

As usual I am running Kasten in Rancher Desktop with Windows Subsystem for Linux which provides me with a single node installation of K3s.

My Kasten dashboard is exposed via Traefik and can be found at this url: http://172.29.153.133/k10/


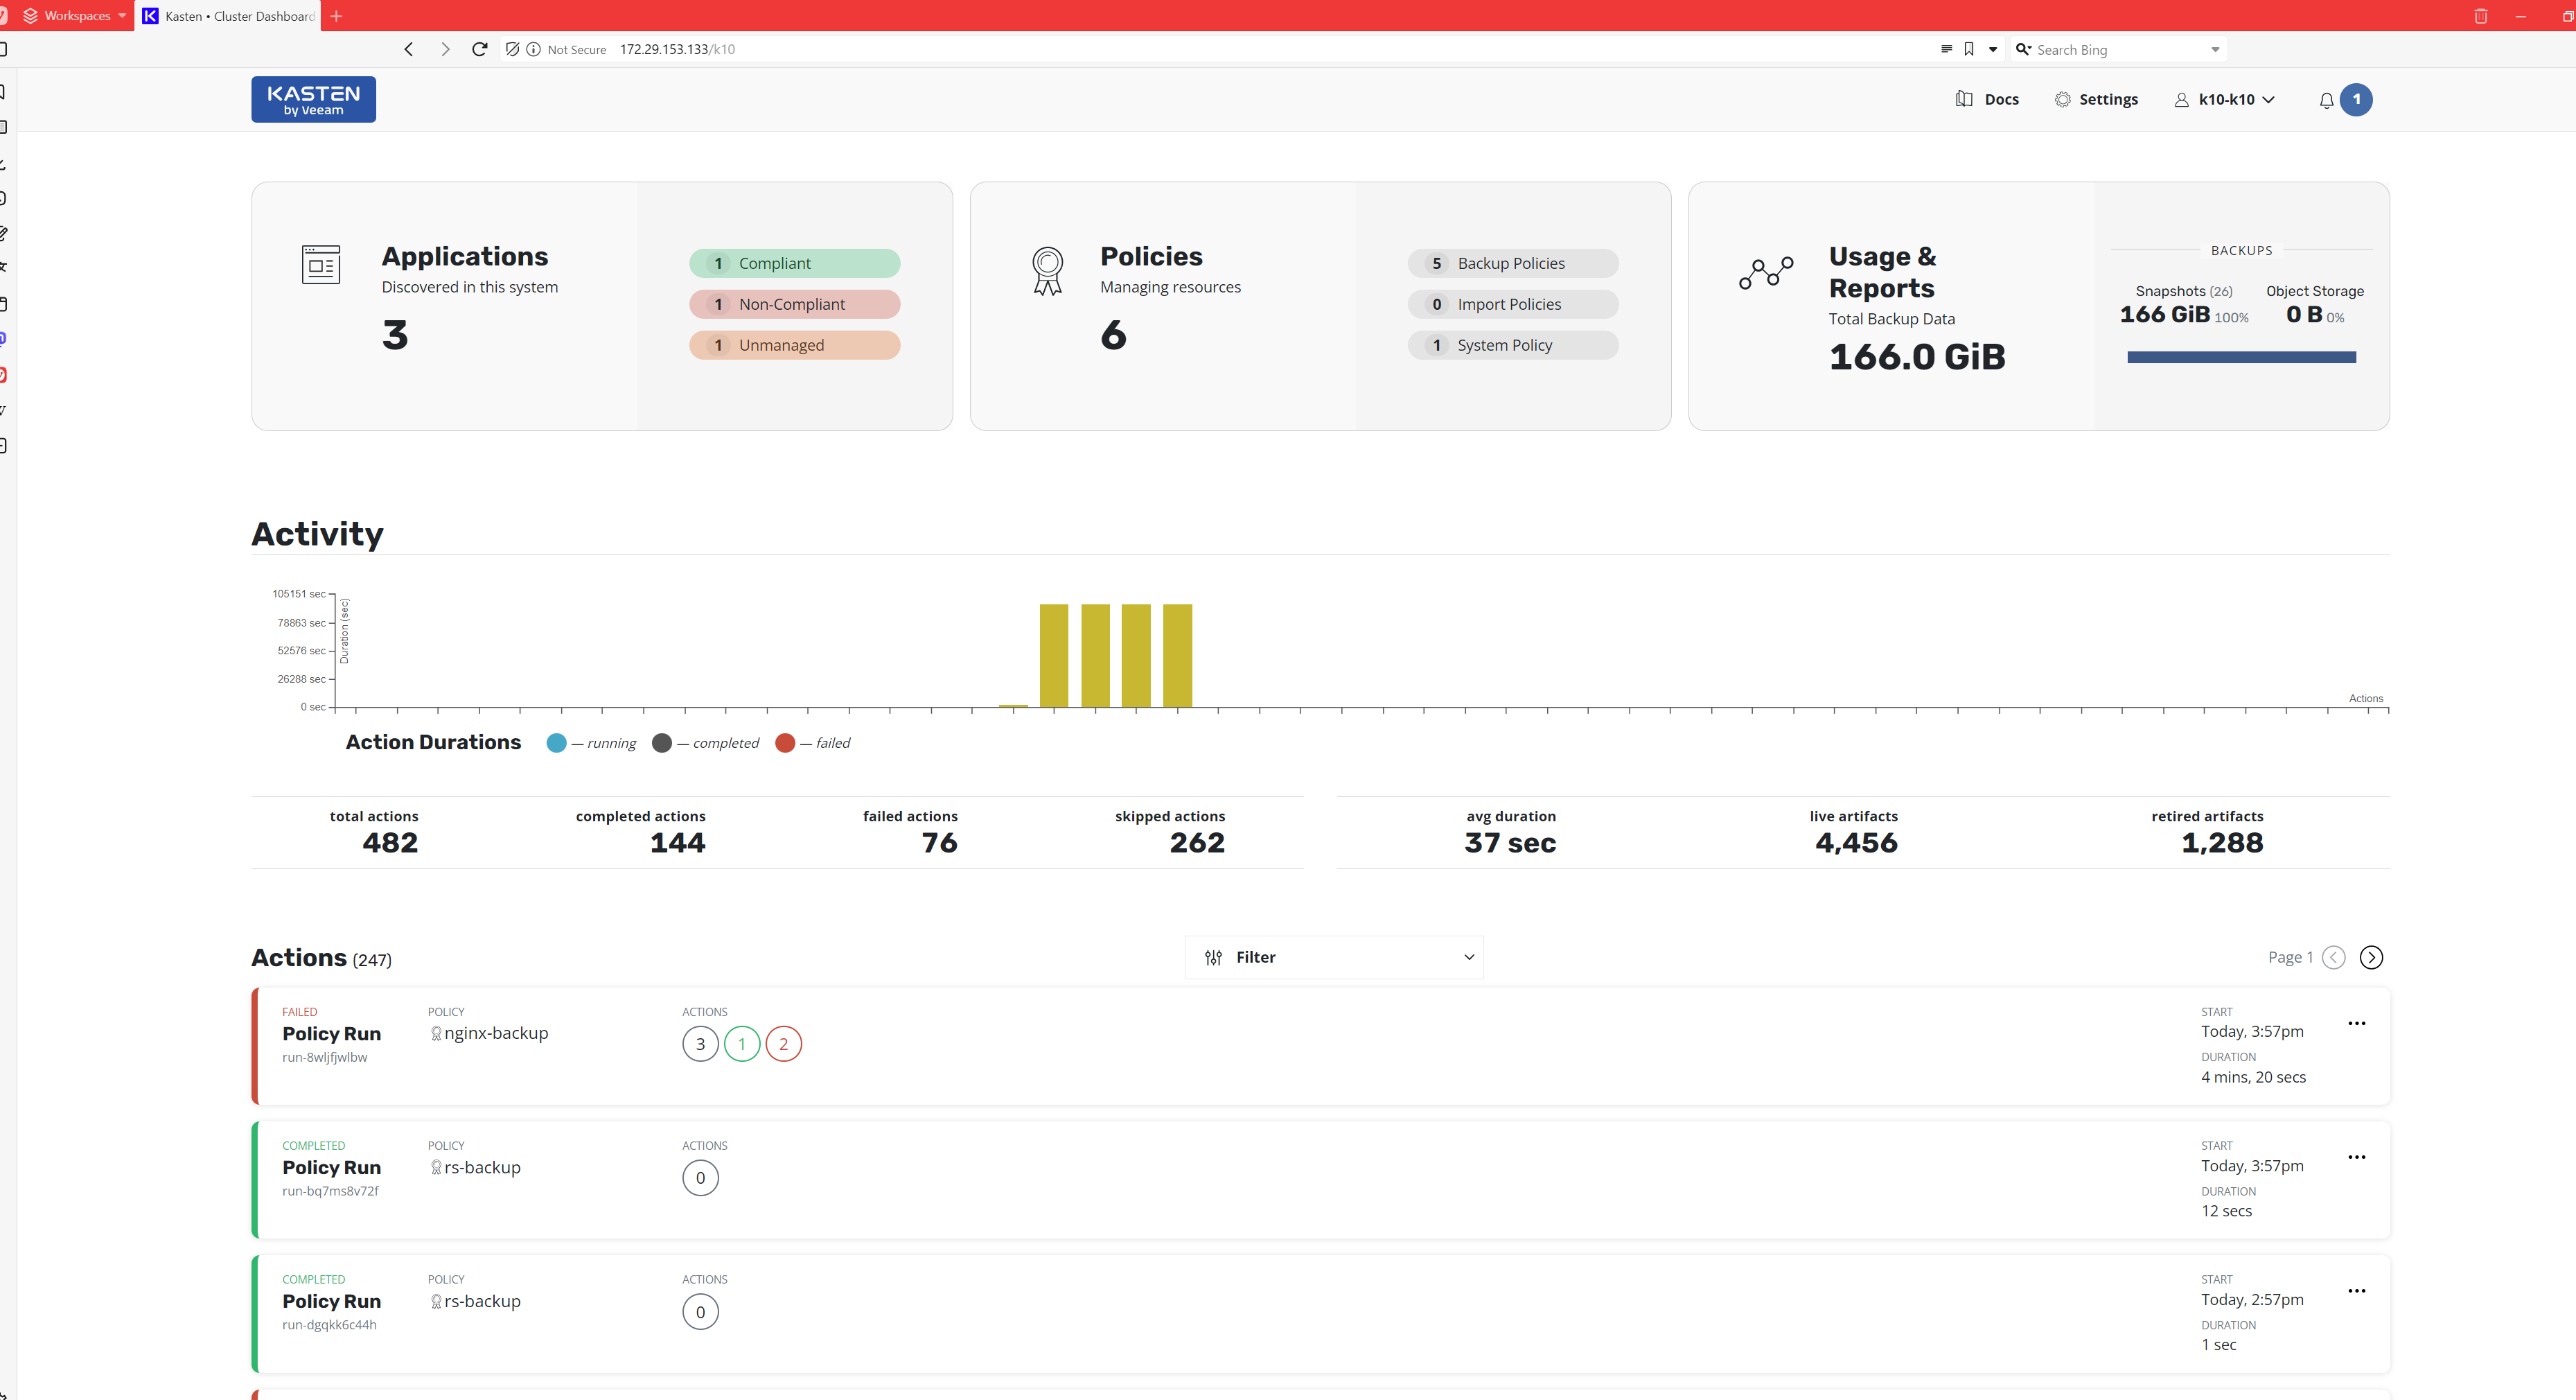
Now if I want to play around with the instance of Prometheus that comes installed with Kasten I just need to add Prometheus onto that url: http://yourk10nameorip/k10/prometheus/


Let’s poke around a bit. First lets take a look at the default targets which you can get to by selecting the Status menu then Targets:

On the left we have the various endpoints, in the middle the state, after that the labels and then the Last Scrape and Scrape durations times. 


Lets see what kind of metrics have been setup for Kasten, if we click on the metrics explorer at the top next to execute we get a nice list: 

I am interested in backups so I will type backup in the filter and see what I get:


action_backup_duration_seconds_sum_overall seems interesting so I will pick it from the list and run execute:


Ok, so nothing for the cancelled and Failure but 63 for the last one. 


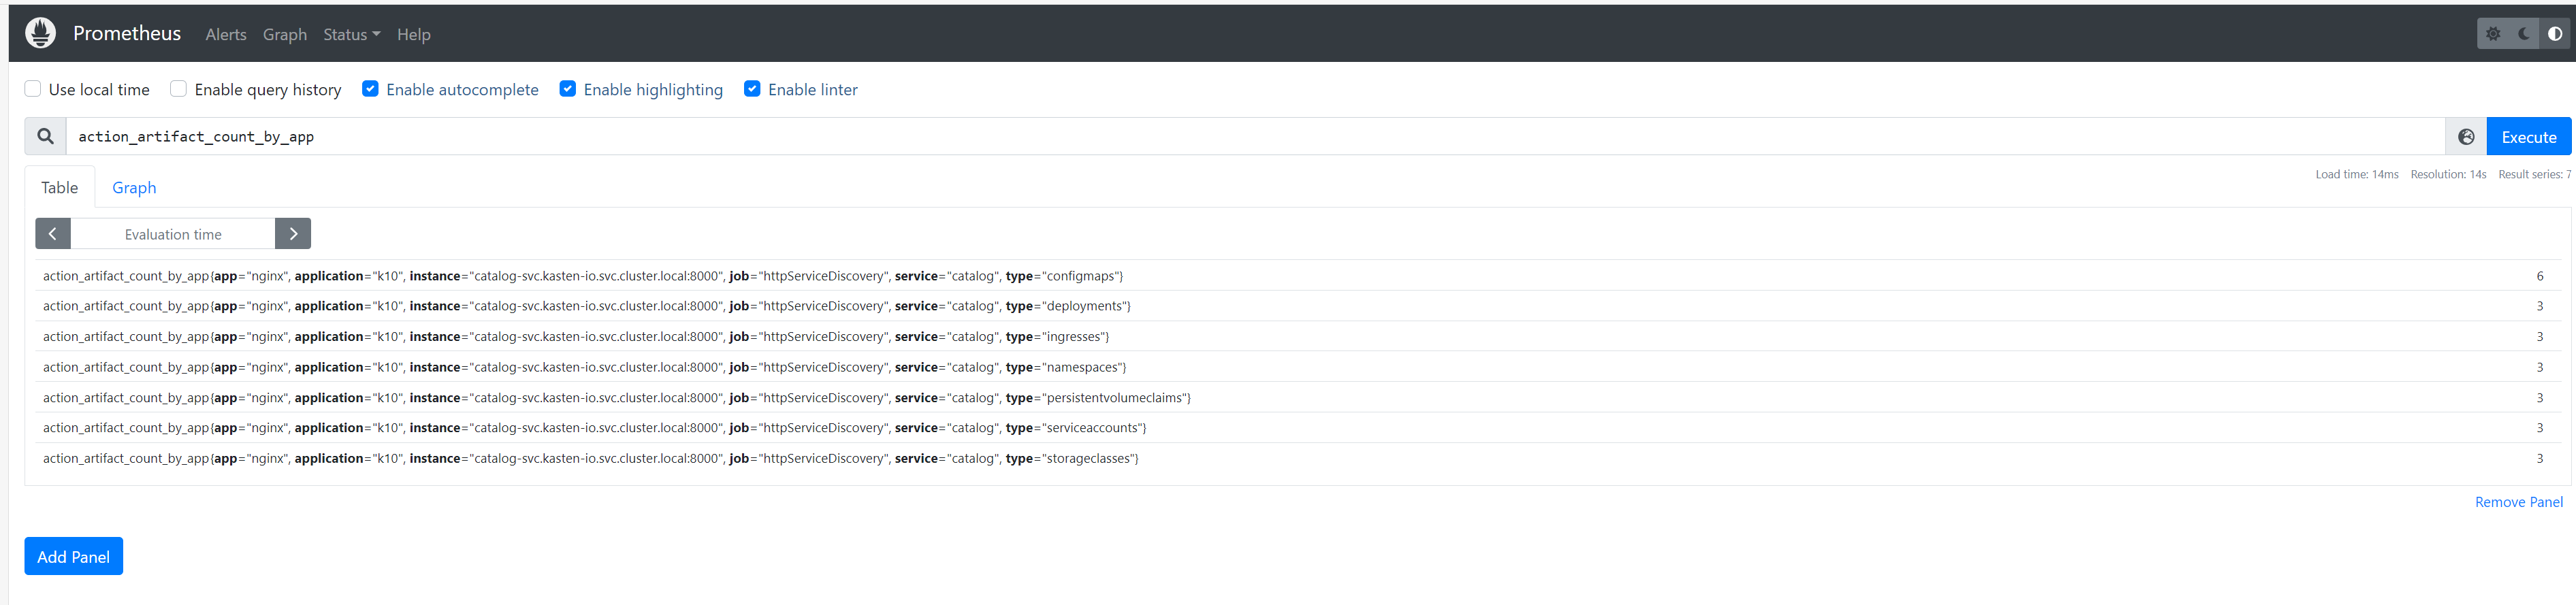
How about action_artifact_count_by_app

Finally snapshot_storage_size_bytes:

Nice. 

This was just a fun walkthrough at a glance. Prometheus is incredibly powerful and to be honest the more I study it the more I find I don’t know :). The journey never ends!


Going forward I will try to post more on what you can do with Prometheus, stay tuned!


4 comments

Userlevel 7
Badge +20

Very cool article and interesting product for sure.

Userlevel 7
Badge +8

Nice Job buddy!

a very nice swimming pool read these days!

🏖️

cheers!

Userlevel 7
Badge +6

Great stuff Geoff, I should come and hang around in here more often. 


Something I have not had a chance to look at yet is the integration of exporting those metrics to DataDog as well. https://docs.kasten.io/latest/operating/external_tools/datadog.html


Also, what if you already had a cluster wide Prometheus instance running, we could integrate into that as well - https://docs.kasten.io/latest/operating/monitoring.html#integrating-external-prometheus-with-k10 


There are some great things you can also do within Grafana but it feels like you might have been leading that way for another post so don’t want to steal the thunder there. 


Userlevel 7
Badge +22

As always I am swimming in 10 different directions at once and trying to figure out why I am stuck in the same spot in the pool :). Well not really, progress in increments. I have already setup a Prometheus monitoring system and am expanding my exporters that are deployed. As far as Kuberenetes is concerned when it comes to Prometheus Service Discovery is the gold gem so that is coming next. 

I spoke to Datadog a few times at conferences and seems very interesting… again time issues. 

I wish I could just Kubectl scale deploy Geoffburke --replicas=6 and then I could get so much more done :)


Comment