I have an issue on our Veeam ONE server and I could not find the root cause of performance charts delay. The server has been upgraded to Veeam ONE v11 recently and the issue happened after upgrade.
There is no performance issue on the server. Monitoring server and database server are placed on Flash datastore.
Could you please help me to resolve the issue if there is misconfiguration?
Best answer by Davoud Teimouri
Hi guys,
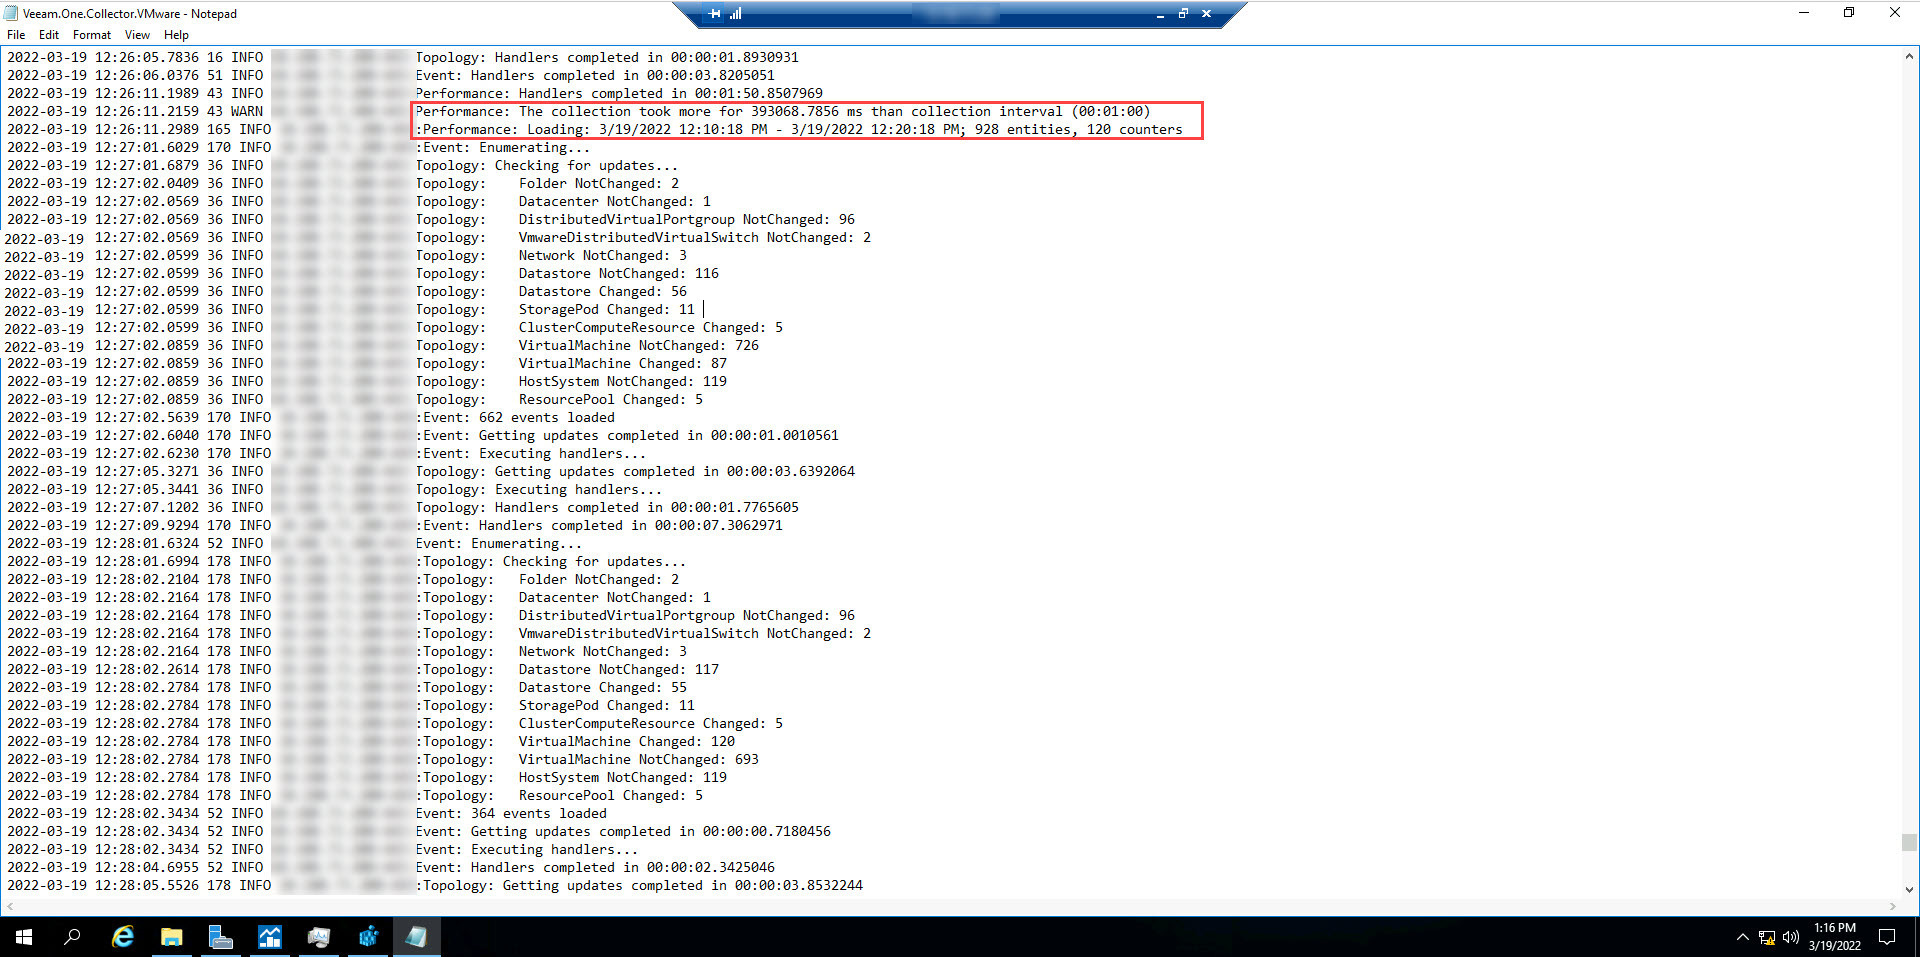
The issue is resolved. After finding the below line in “Veeam.One.Collector.VMware”:
Collecting performance data took more than 393000ms, so there were some problems.
I have checked our vCenter performance and also database servers but all were healthy and also the servers have enough resources and located on AFA storage.
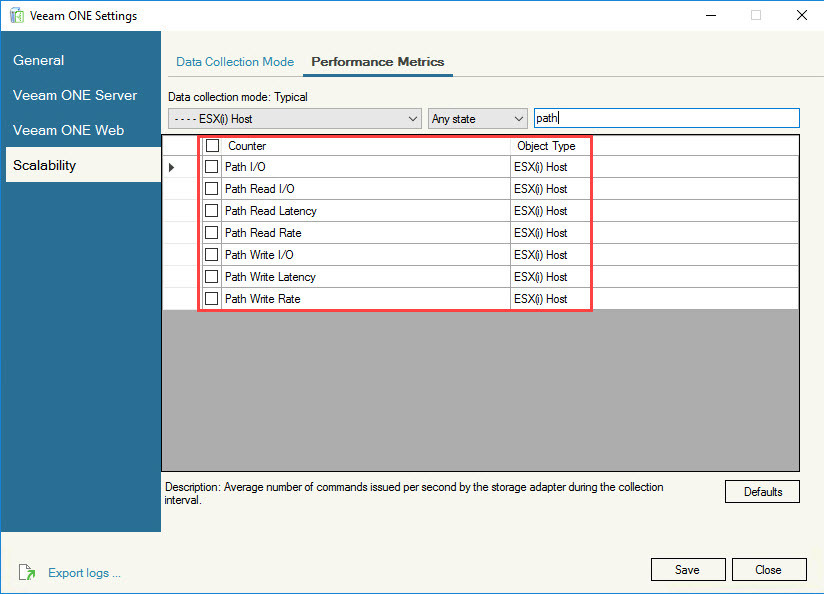
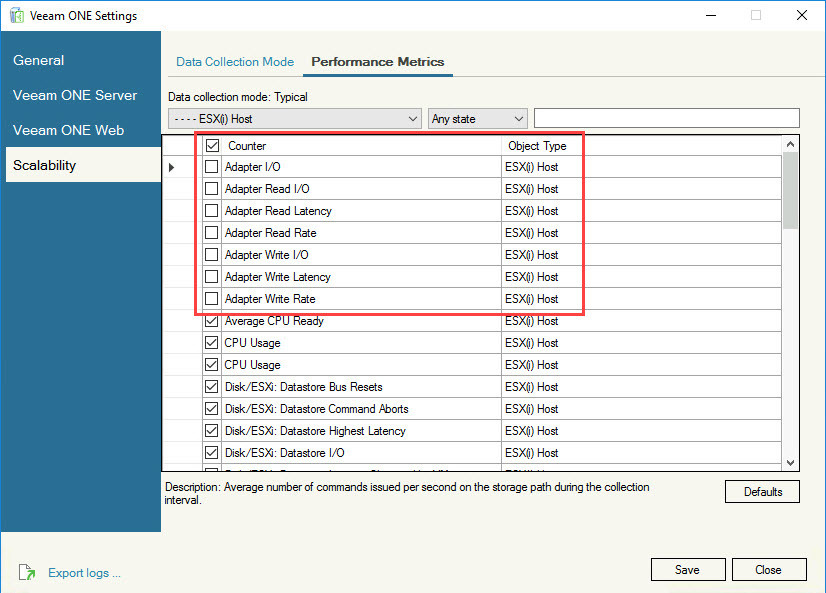
There was 120 counters for collecting performance data so I deselect some metrics in “Veeam ONE Settings” tool. Because our server is monitoring large environment and we have lots of datastore and storage LUNs, I have deselected all metrics for storage paths and storage adapters.
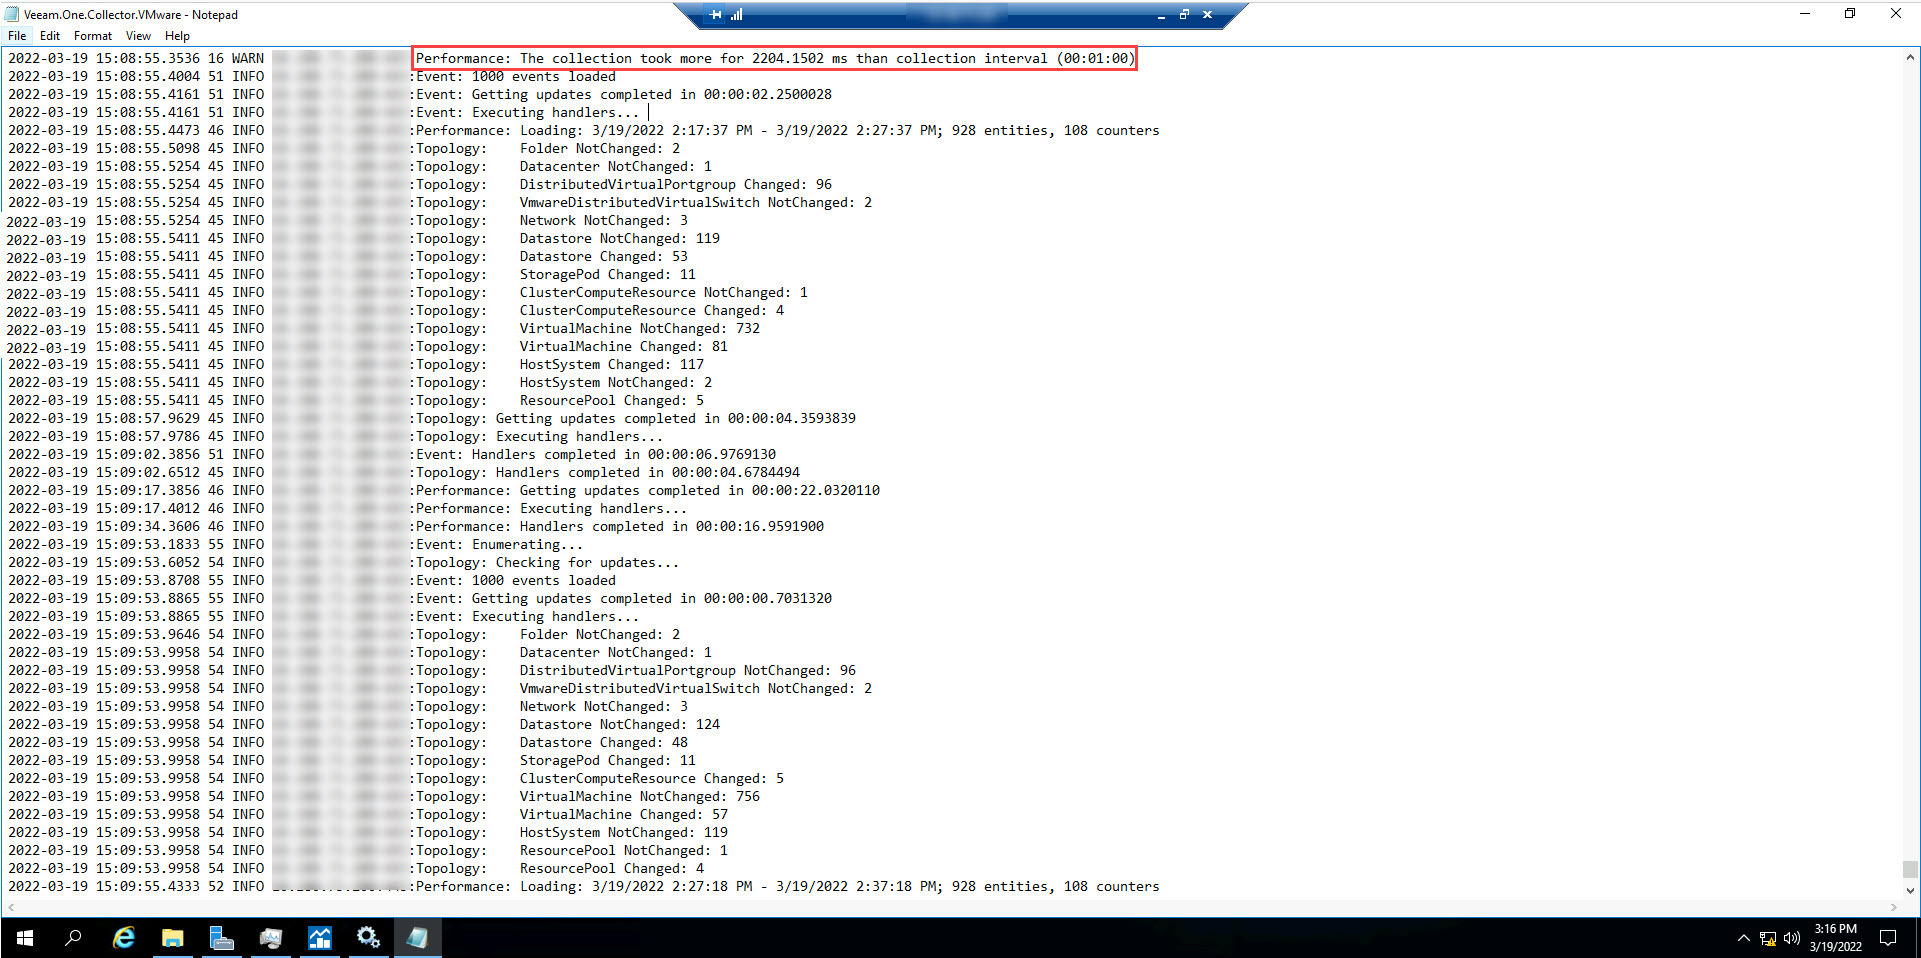
After service restart, the charts are near real-time and performance collector takes less than 10 seconds to collecting performance data.
I did some another changes but the above change was the solution for me:
Change deployment type
Remove backup server and re-add
Change reporting service schedule
I think that Veeam should check the issue because as I said, there was no bottleneck on our management servers and we have lots of storage paths and LUNs.
How long ago did you upgrade? I know right after it takes some time for VONE to collect data again and update itself but probably not the cause. This could be many things so not sure where to start at the moment.
Did you upgrade from 10 to 11? Because the screen you posted mention version 11 and not 11a, so maybe last patch isn’t the upgrade you’re referring to. Let us know.
Also the version you listed is v11 not v11a. You may want to update to 11a as there are many enhancements and fixes that might address this issue you are seeing. Check here -
The issue is resolved. After finding the below line in “Veeam.One.Collector.VMware”:
Collecting performance data took more than 393000ms, so there were some problems.
I have checked our vCenter performance and also database servers but all were healthy and also the servers have enough resources and located on AFA storage.
There was 120 counters for collecting performance data so I deselect some metrics in “Veeam ONE Settings” tool. Because our server is monitoring large environment and we have lots of datastore and storage LUNs, I have deselected all metrics for storage paths and storage adapters.
After service restart, the charts are near real-time and performance collector takes less than 10 seconds to collecting performance data.
I did some another changes but the above change was the solution for me:
Change deployment type
Remove backup server and re-add
Change reporting service schedule
I think that Veeam should check the issue because as I said, there was no bottleneck on our management servers and we have lots of storage paths and LUNs.