I want to introduce you to another community project I worked on: The Veeam Data Platform Content Pack for Graylog. Graylog is a Security Information and Event Management (SIEM) solution that enables the efficient collection, search, analysis, and alerting of various types of machine-generated data. More details about their products can be found on the official website.
Content Pack Description
The first version of the Content Pack enables the visualization of security-relevant events transmitted by Veeam Backup & Replication via Syslog. In addition to a pre-configured Dashboard, further information is extracted from the Syslog data, which allows the ingested data to be analyzed further. For more details about the Content Pack, see README.md on GitHub.
Download & Install the Content Pack
The following steps describe how to download and install the Content Pack.
Download
Download the Content Pack from GitHub.
Graylog Upload & Installation
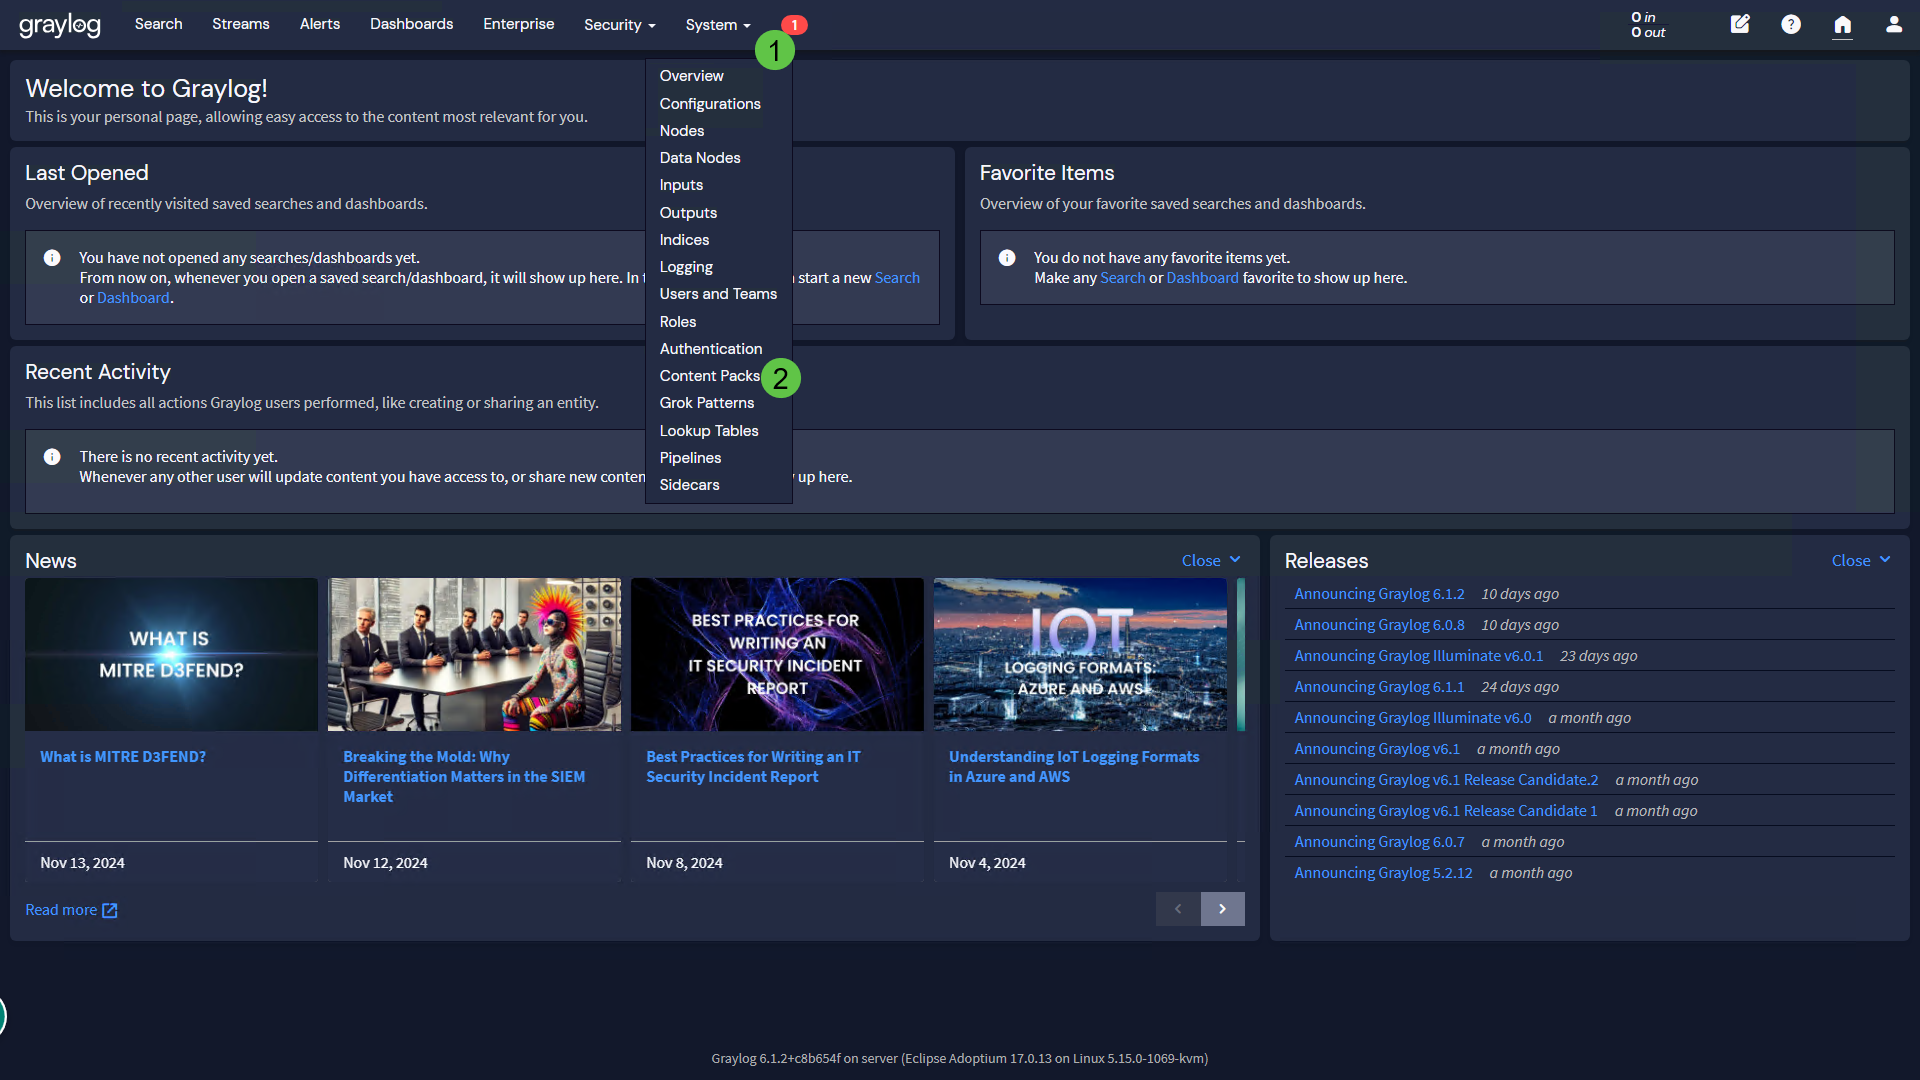
After downloading, log in to the Graylog web console and perform the following steps:
- Select Content Packs in the System Menu
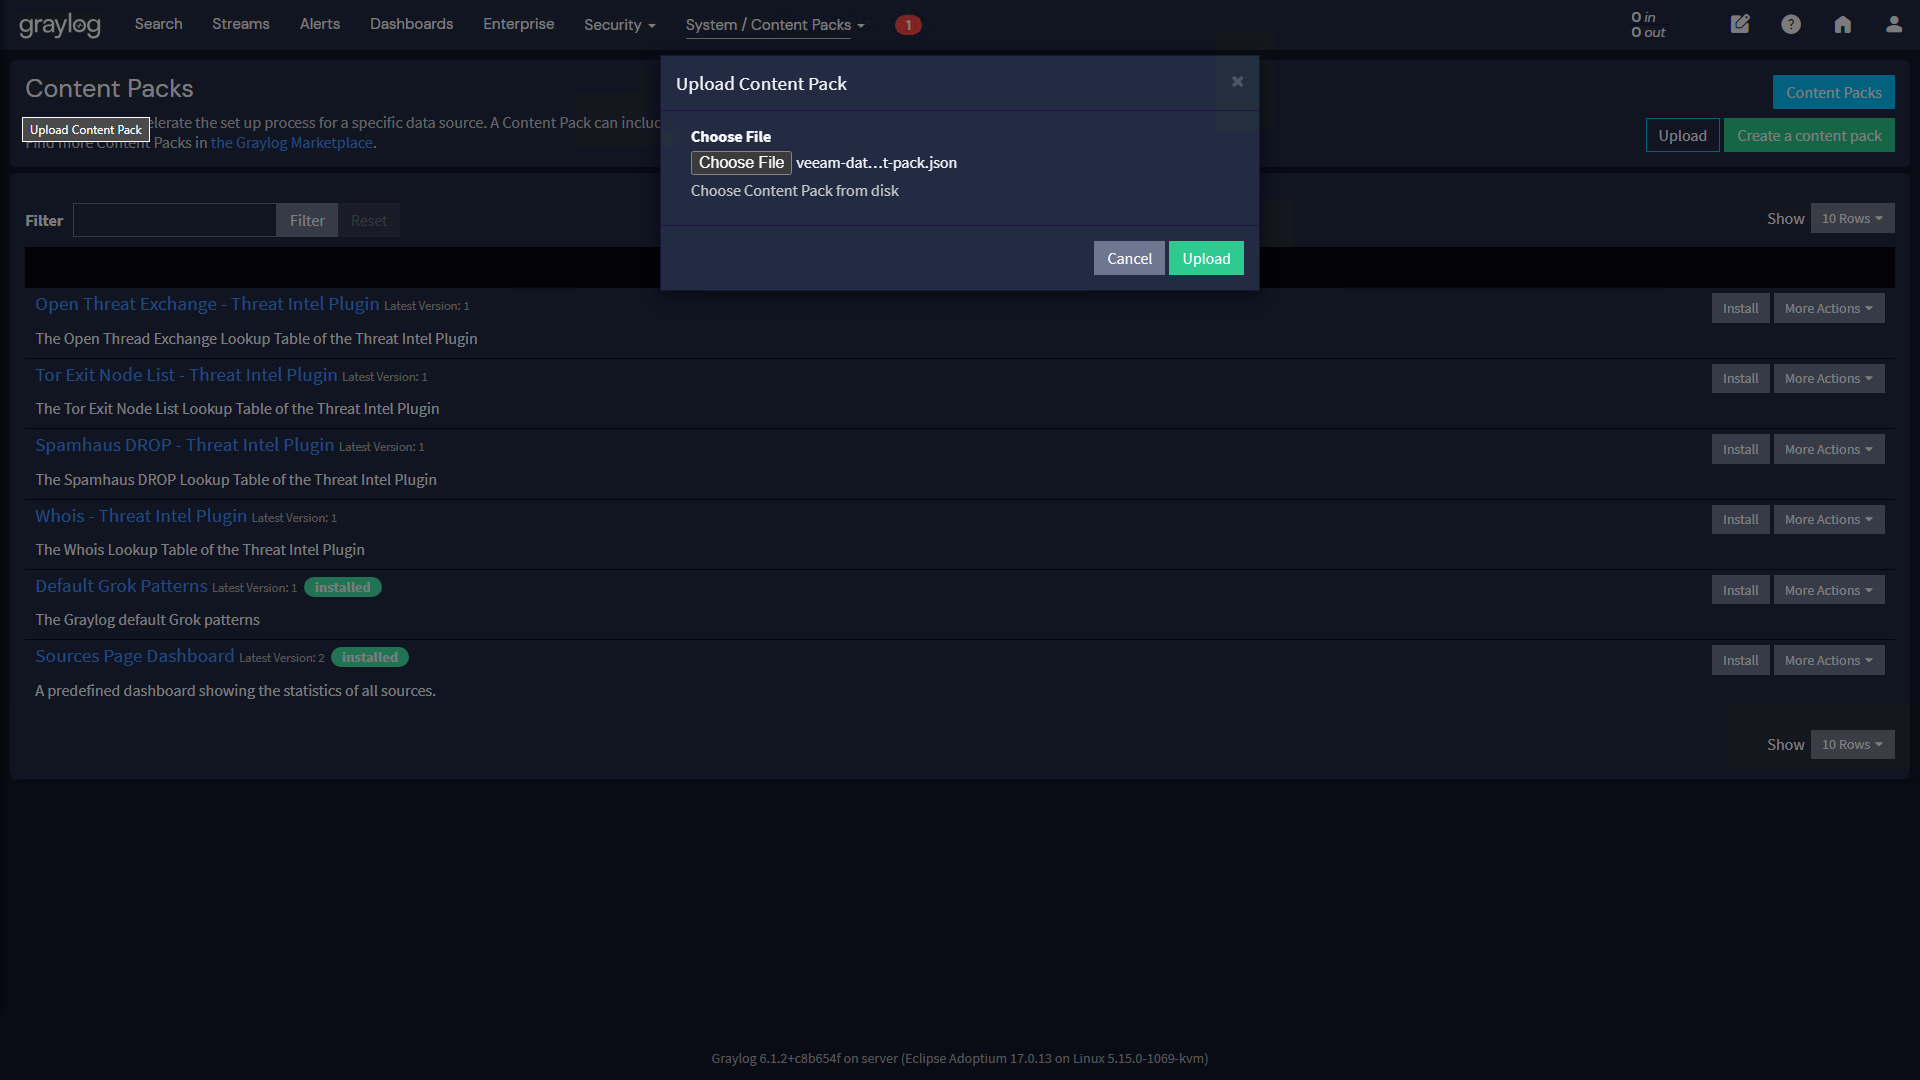
- Click on the Upload button
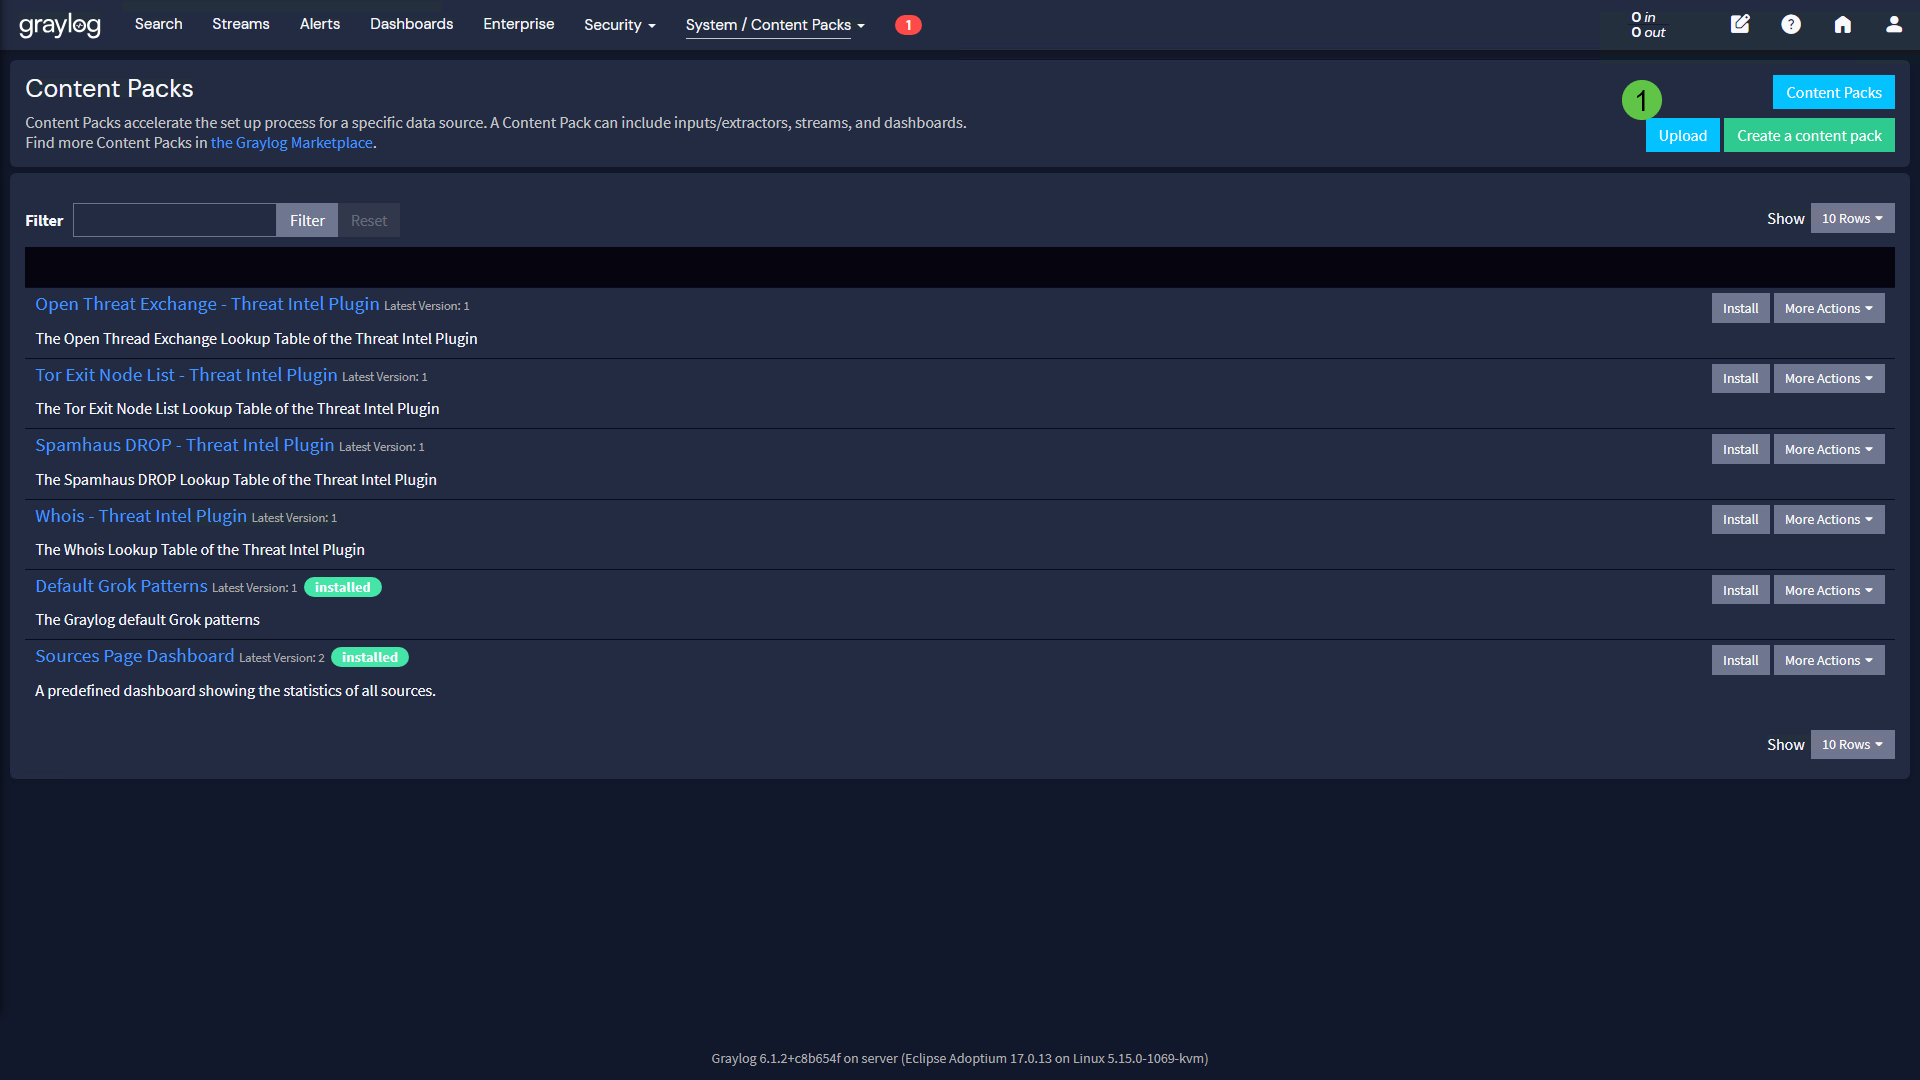
- Click on Choose File and select the previously downloaded JSON file. Next, click on the Upload button
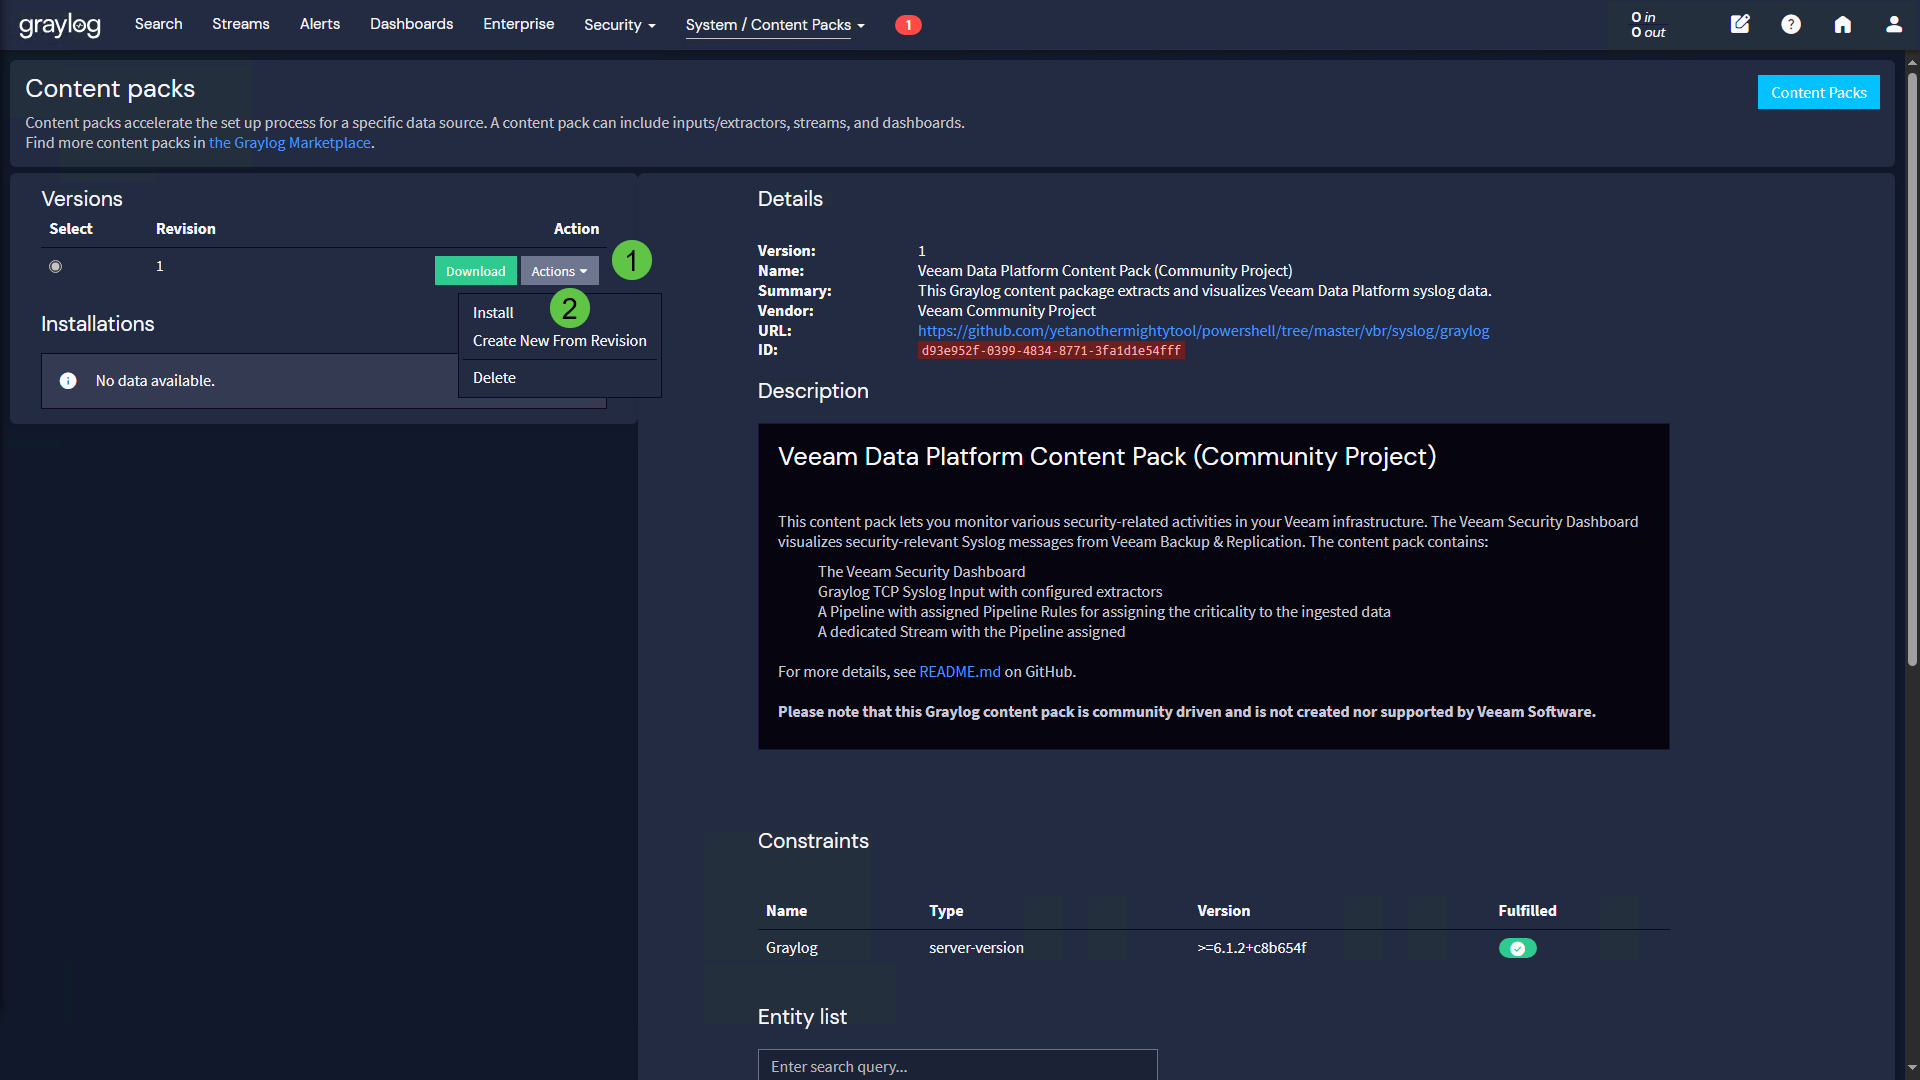
- The content pack is displayed in the list of available content packs. Click on the Veeam Data Platform Content Pack
- Click on the Actions drop-down menu and select Install
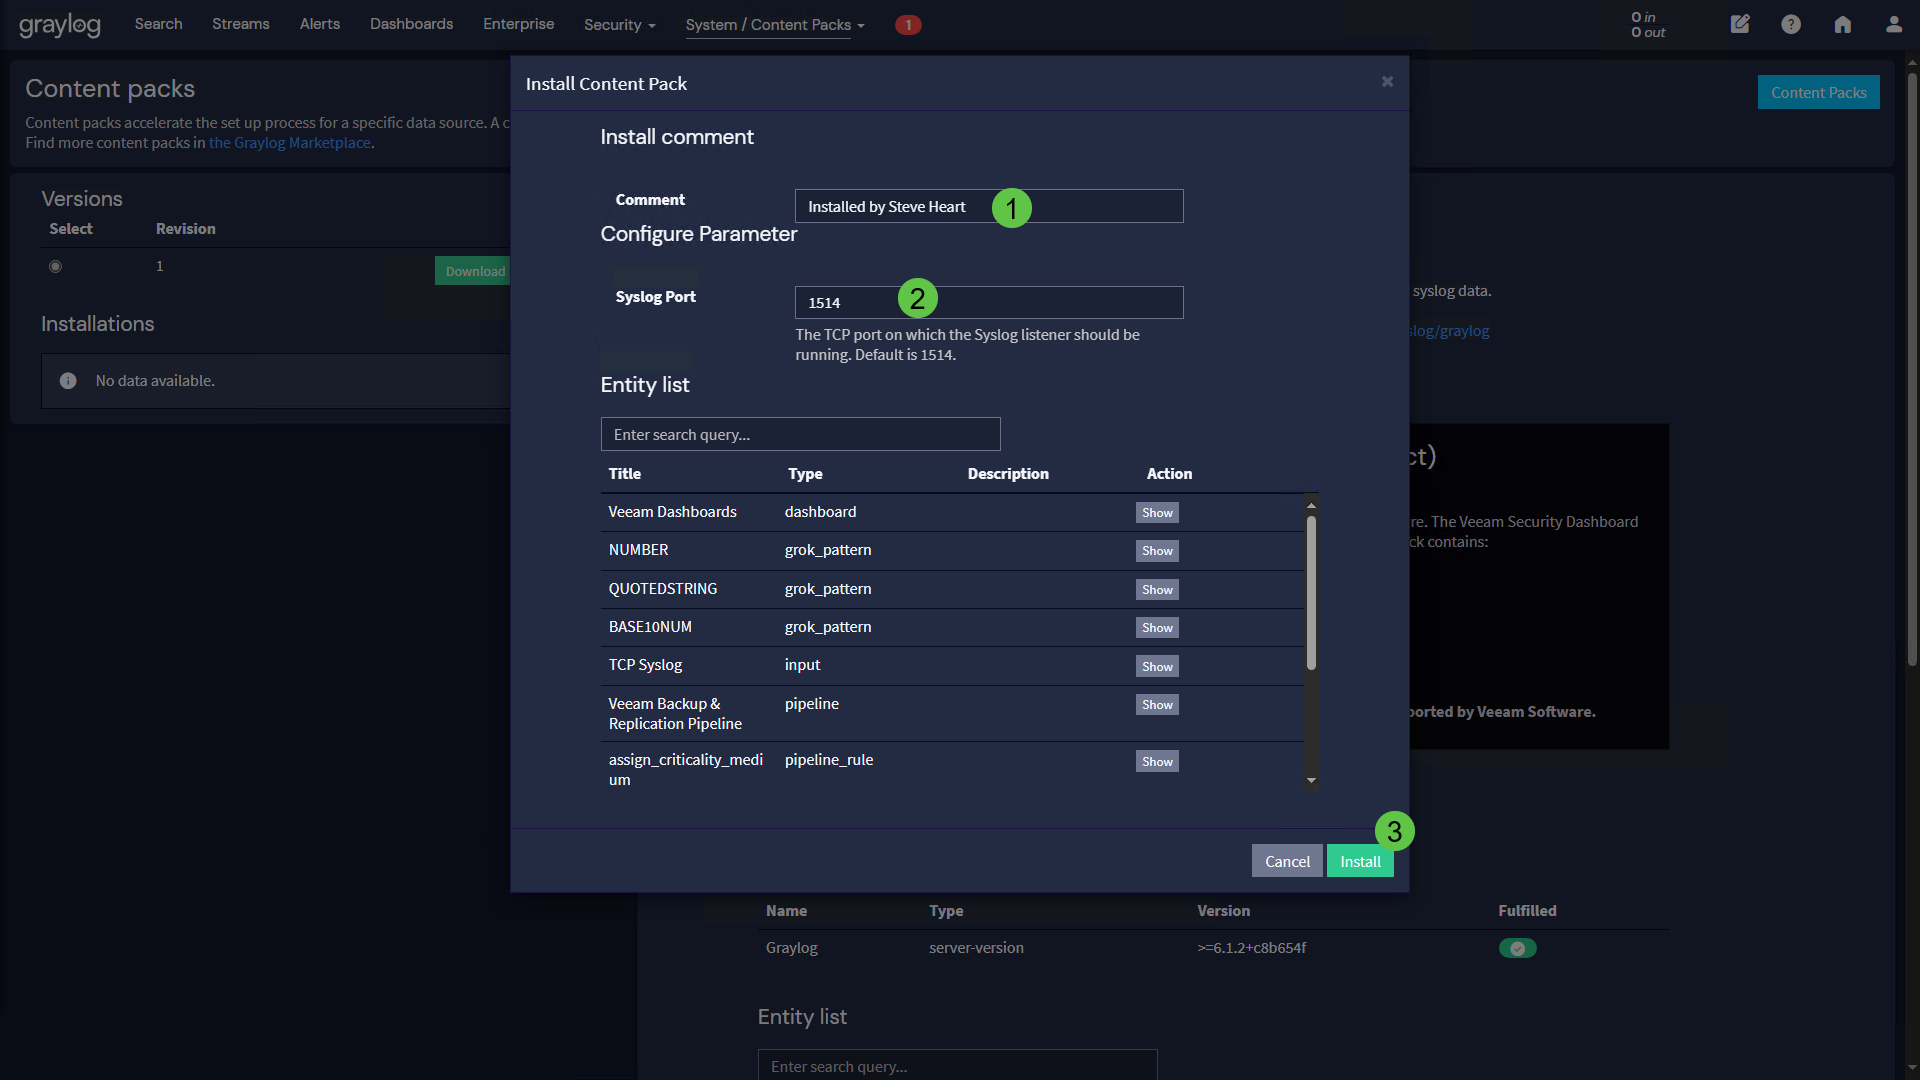
- Enter a Comment and the desired Syslog Port in the corresponding fields and then click the Install button
VBR Syslog Settings
Next, the Graylog server must be configured with the corresponding port in the Event Forwarding settings of Veeam Backup & Replication, as documented here.
Visualization & Search
Veeam Security Dashboard
The Veeam Security Dashboard will display values once security-relevant Syslog data has been transmitted.
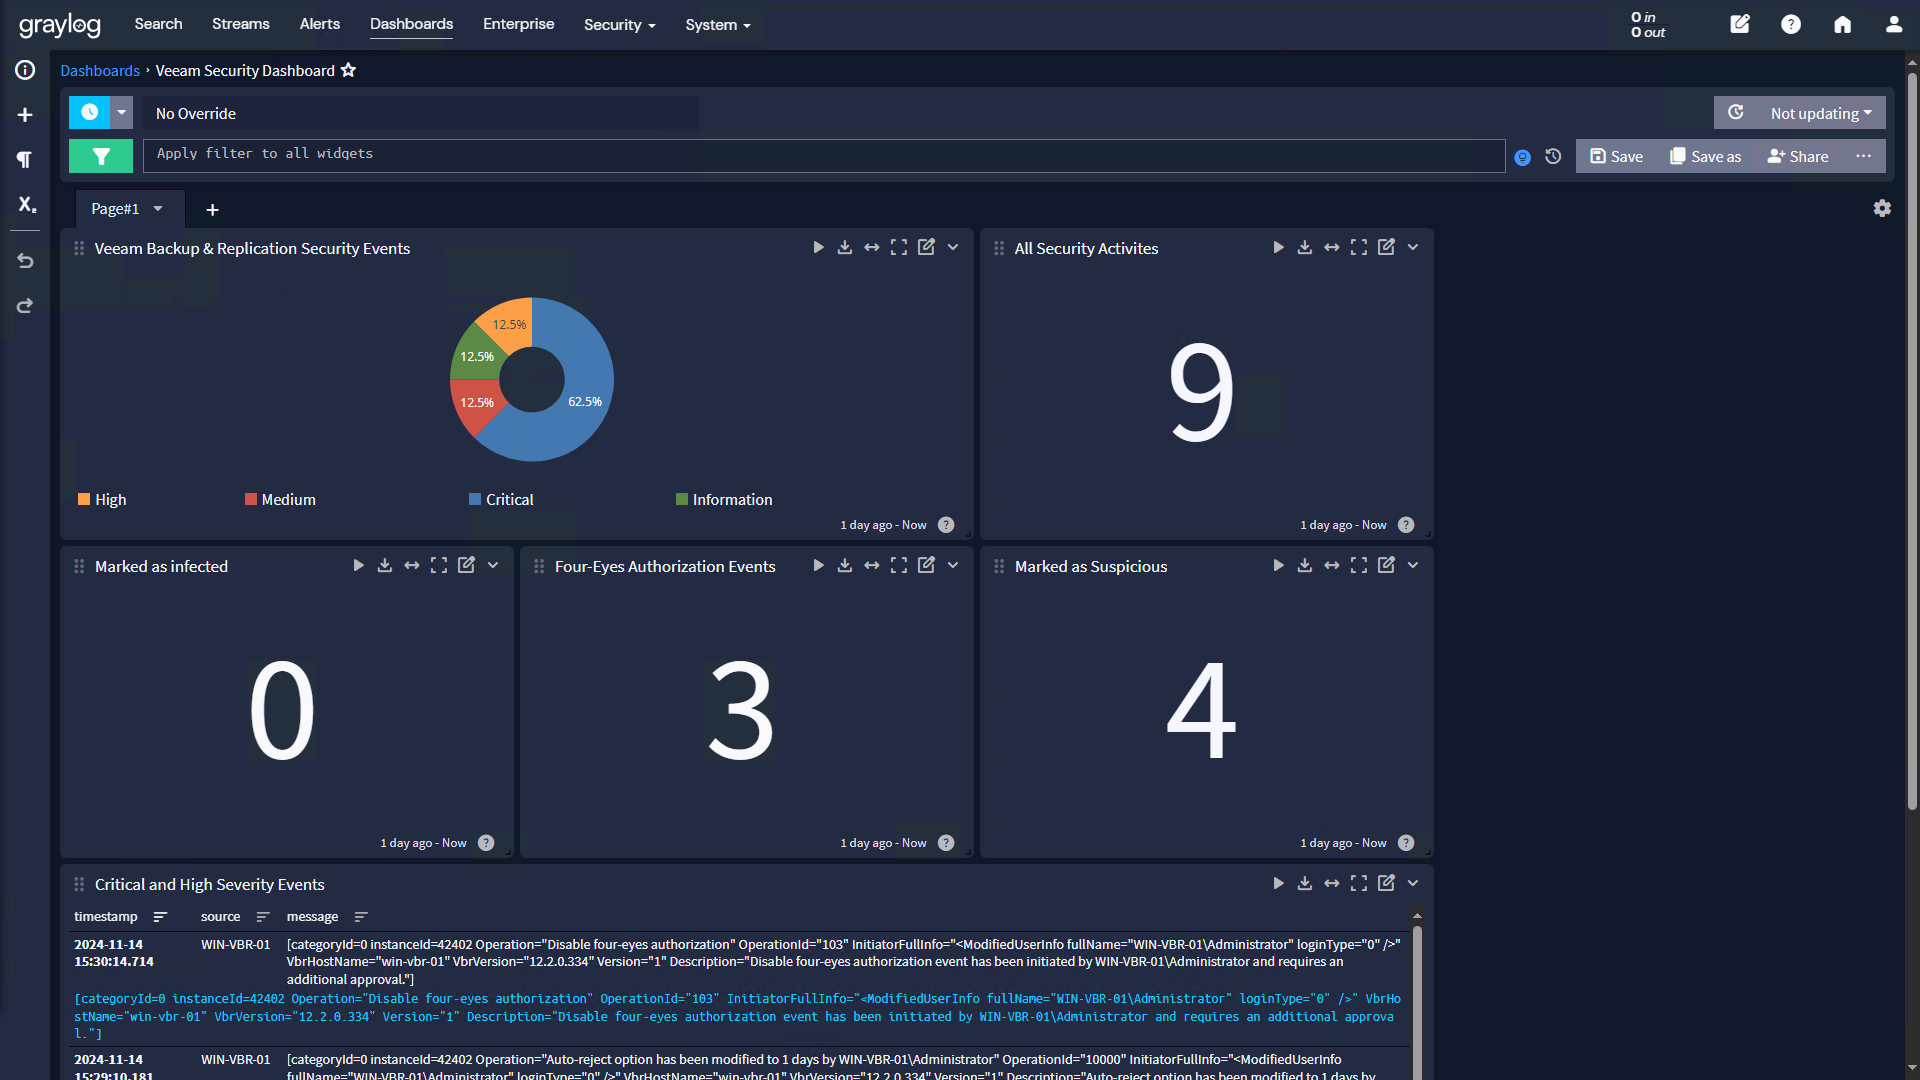
The dashboard contains the following widgets:
- Veeam Backup & Replication Security Events
A pie chart with the percentage breakdown of incoming messages by severity level - All Security Activities
All security-relevant activities during the past 24 hours - Marked as infected
The total amount of objects that were marked as Infected during the past 24 hours - Four-Eyes Authorization Events
The total amount of four-eyes authorization events - Marked as Suspicious
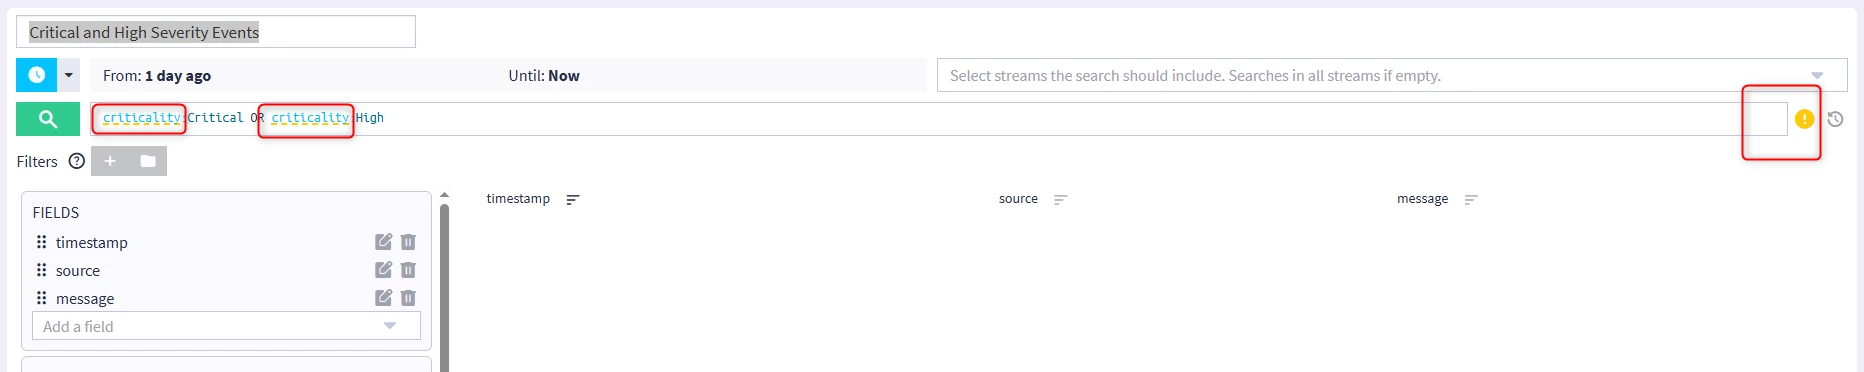
The total amount of objects that were marked as Suspicious during the past 24 hours - Critical and High Severity Events
Tabular view of events with the severity Critical or High
Searching Logs
You can also search for other events on the Graylog search page. Enter a search query in the search bar and adjust the time range for your search if necessary. The example below shows how to search for all completed backup jobs with the status “Failed” during the last 7 days.
instanceId:190 AND JobResult:2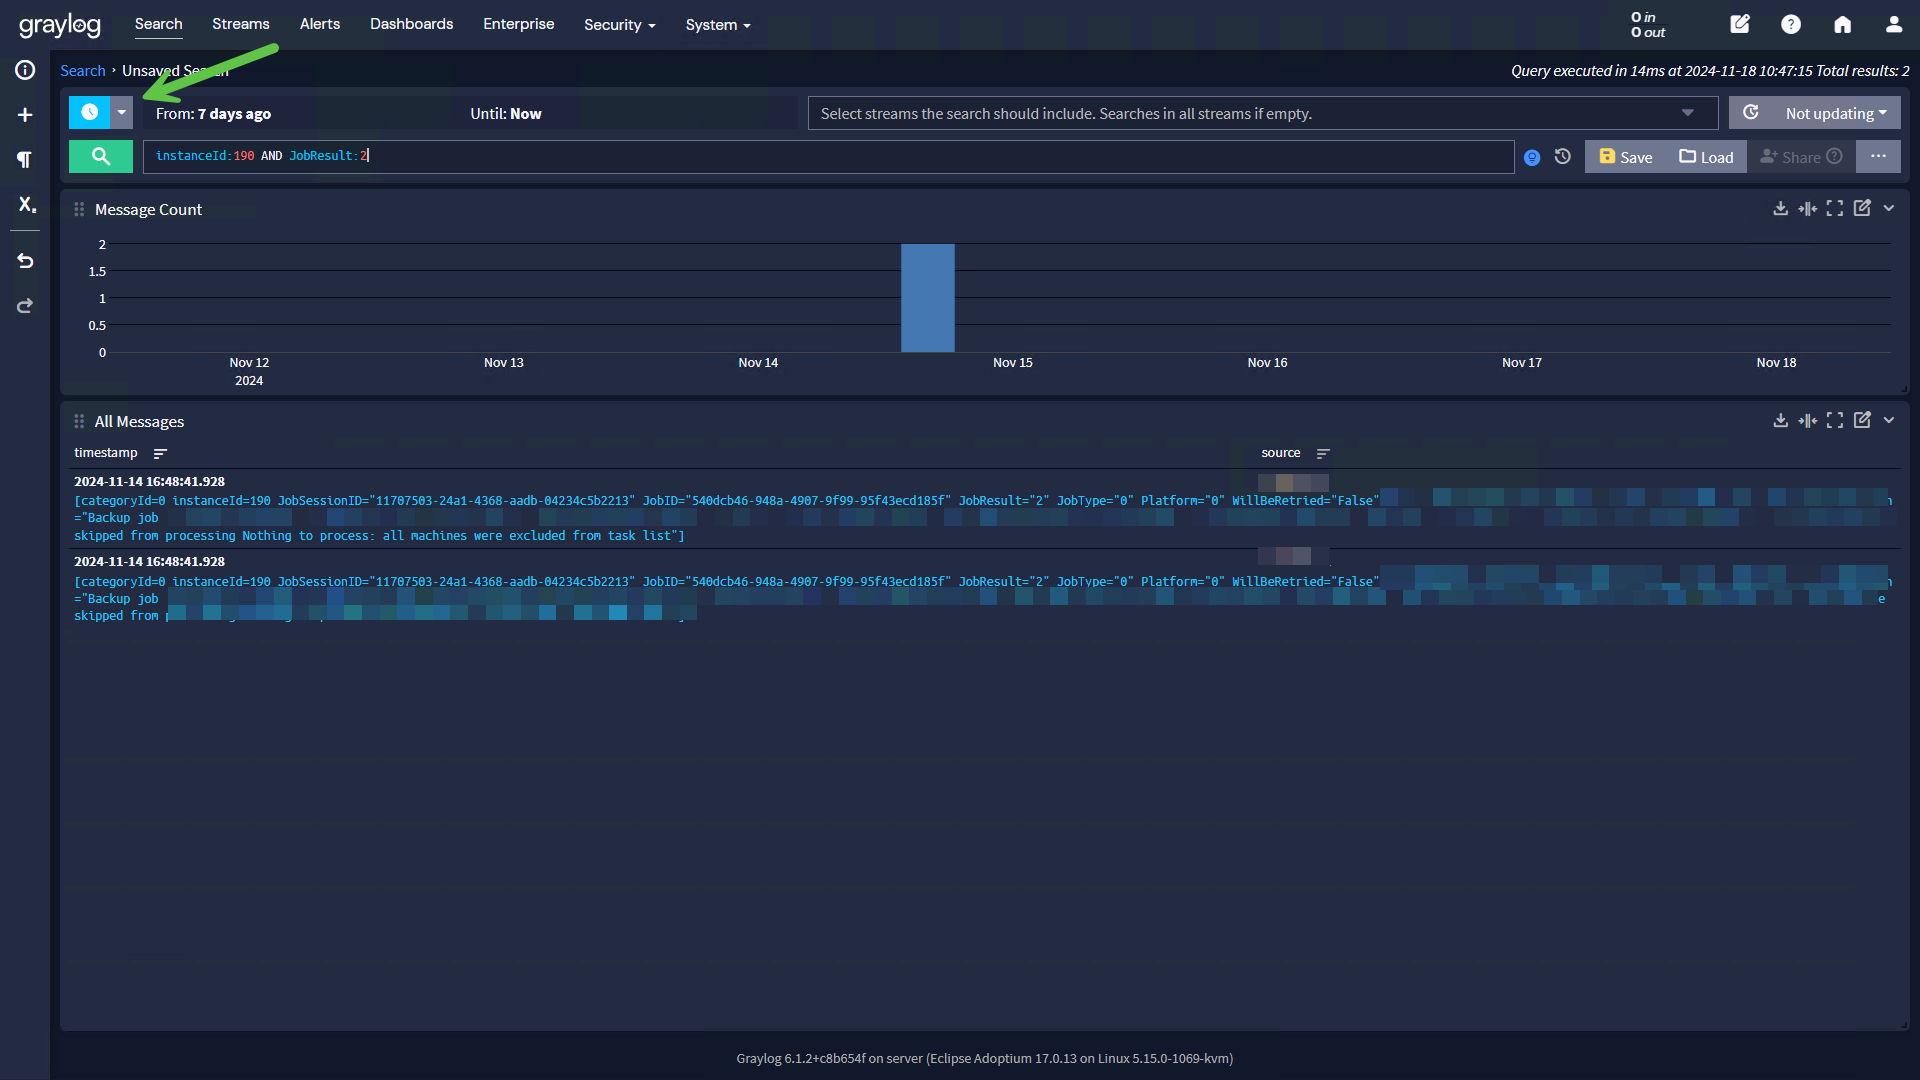
Notes
Please provide feedback. Depending on your feedback, I will try to add enhancements in my free time.