
Greetings, friends! I want to share with you the new Grafana Dashboard for Veeam Backup & Replication, no Enterprise Manager is needed, and it uses 100% VBR API.

Small note: For those familiar with the data protection scene, you might recall that we’ve already got a Grafana Dashboard dedicated to the Veeam Enterprise Manager API since 2020.


Grafana Dashboard for Veeam Backup & Replication API


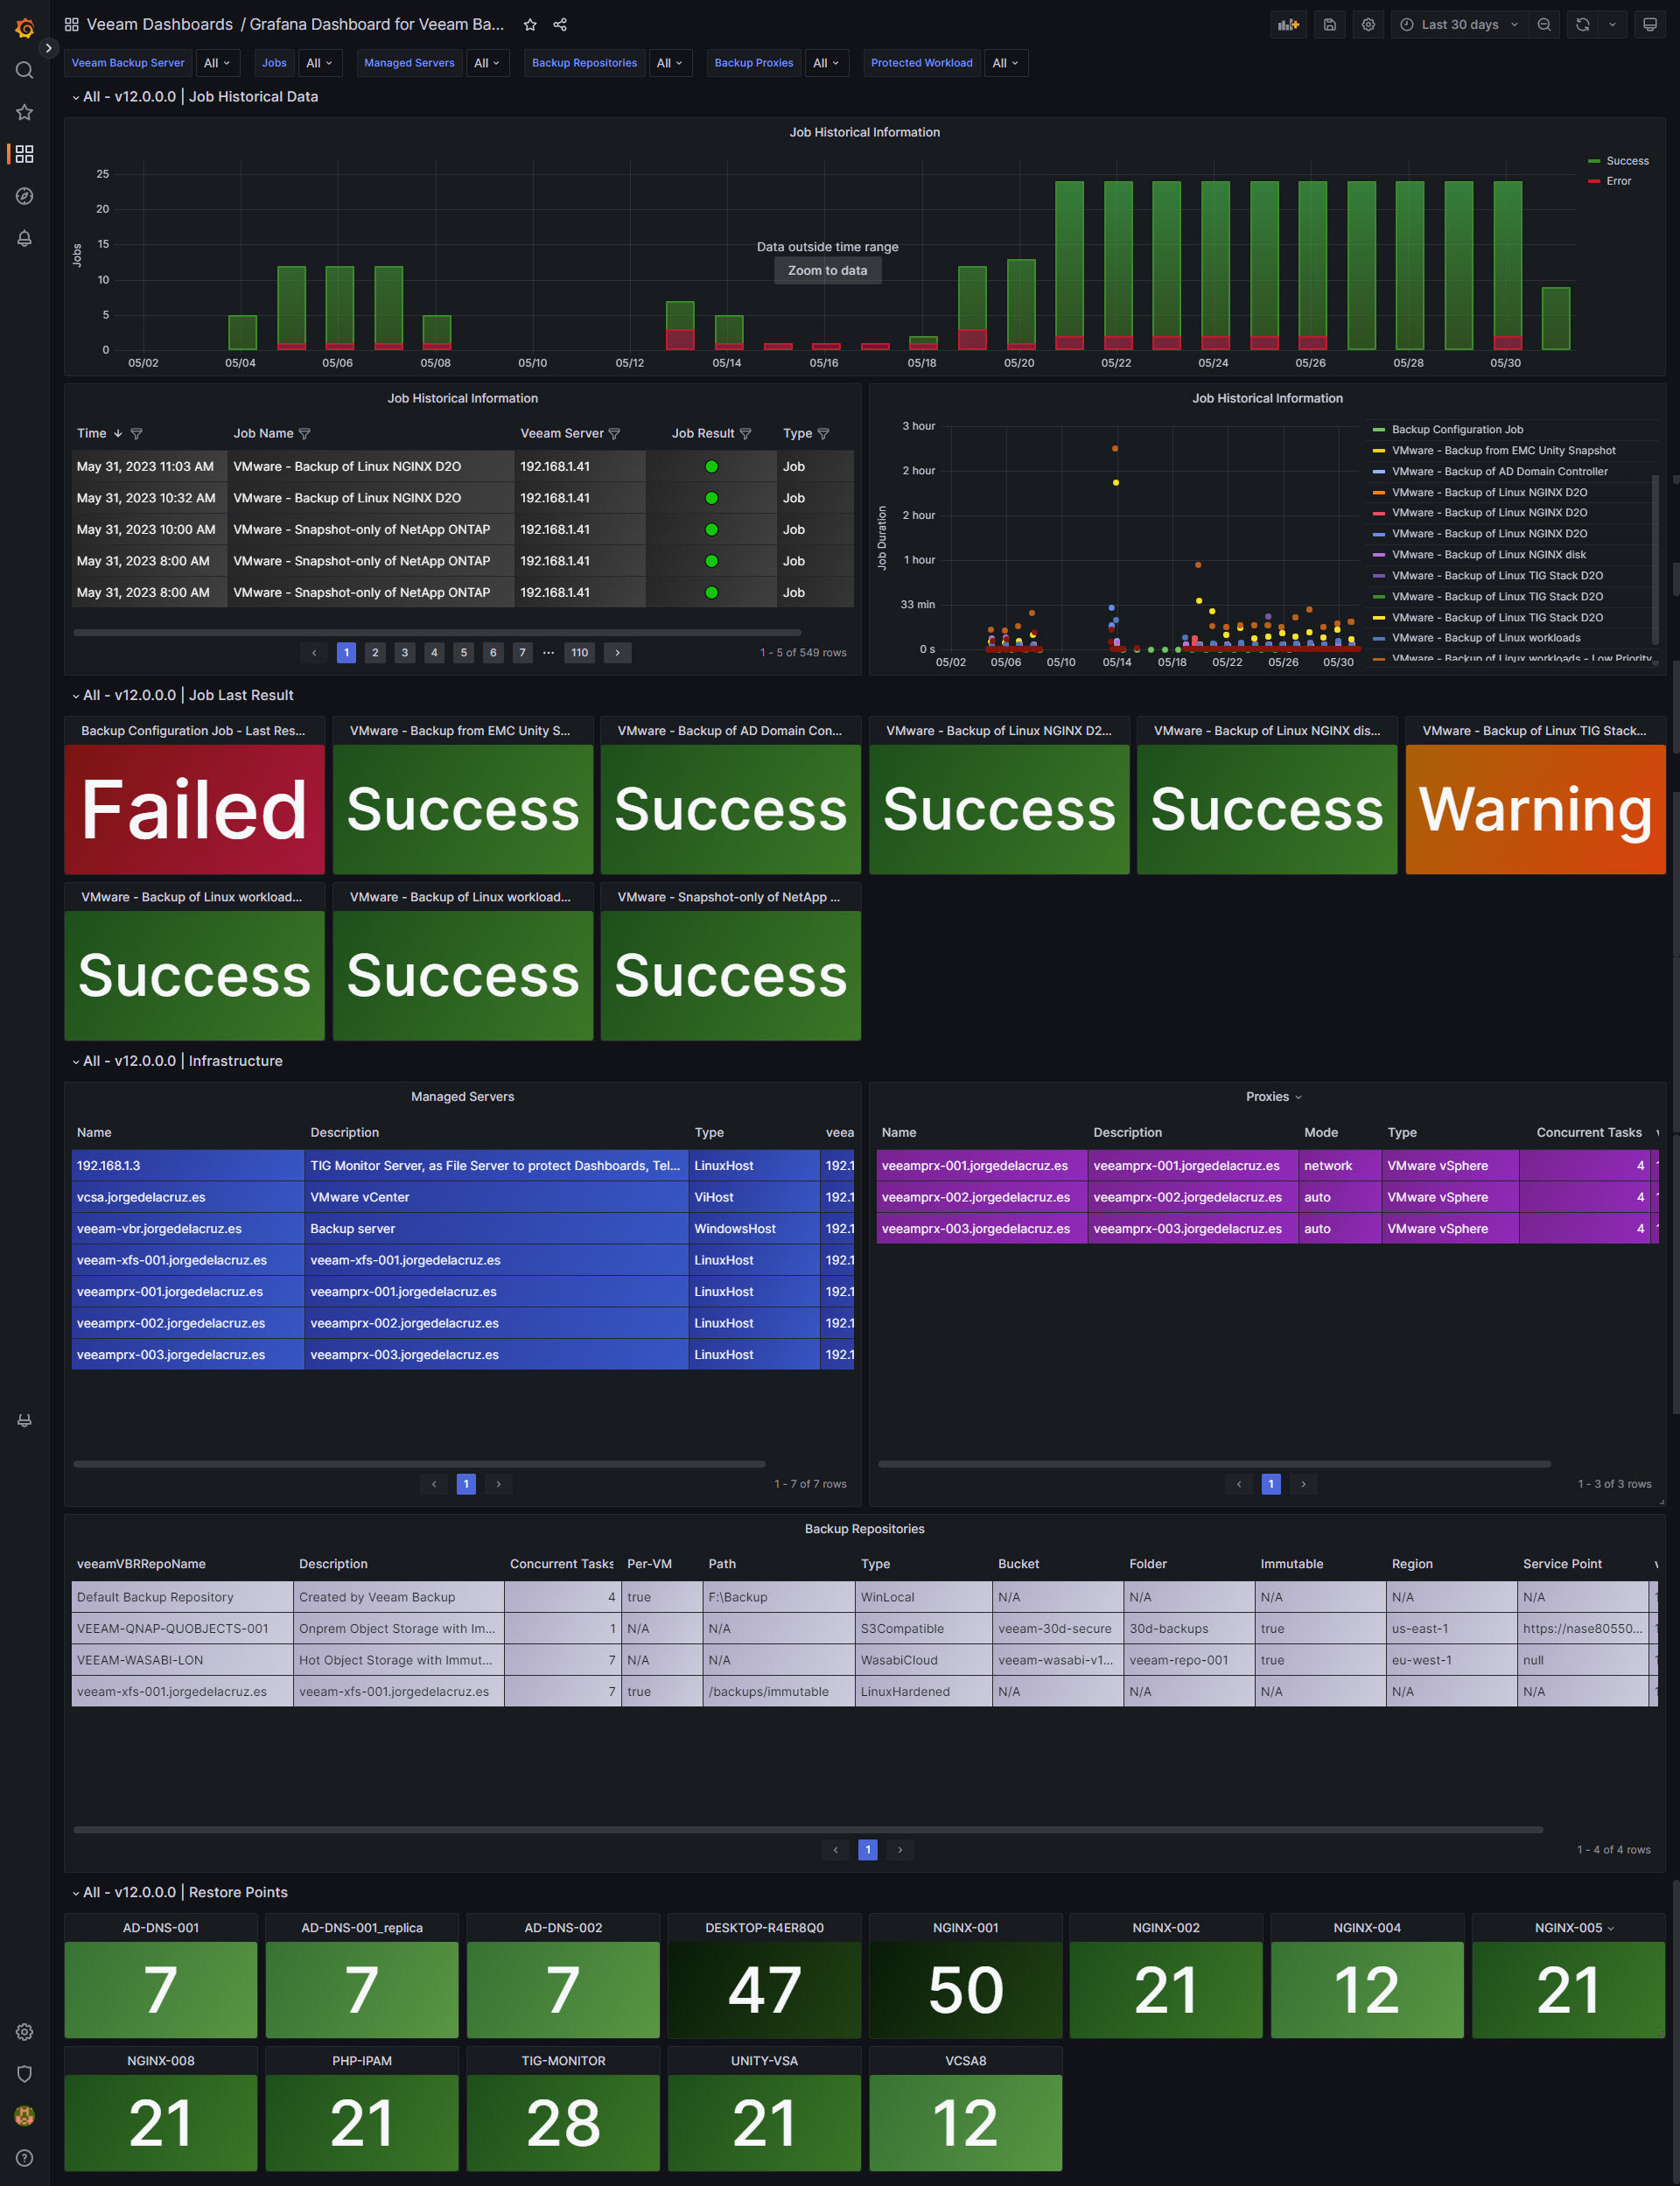
When you finish this article, if you follow all the steps, you should have something similar to this. It might be different according to your environment, number of days you select, protected workloads, jobs, etc.

Dashboard – Summary

  • Job Historical Information – The very first graph. The most important one in my opinion. Grouped by 24 hours, get to know the status of your policies per day, on a range in time.
  • Job Historical Information Table – Very similar to the previous panel, but this time with more details about job name, status, date, etc.
  • Job Historical Information Duration – Very similar to previous panels, but this time showing in a bubble way, how much every job has taken to execute. A very cool way to see what jobs are taking the longer, trends, etc.
  • Job Last Result – BIG COLORED PANELS, what everyone I talk about is asking for. Get to know the last status across all jobs, and focus only on the ones are yellow/red.
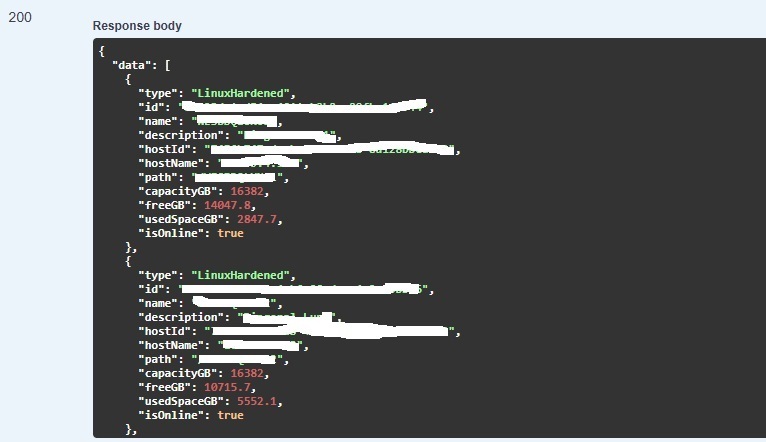
  • Infrastructure – A few tables that shows some Infrastructure data across the Veeam Backup & Replication. A lot to improve here, but so far the VBR API doesn't give us much more details.
  • Restore Points – More big panels in colors. The more points, the darker the green becomes. This is a list of all your workloads, or the selected workload on top, with the amount of restore points to date.

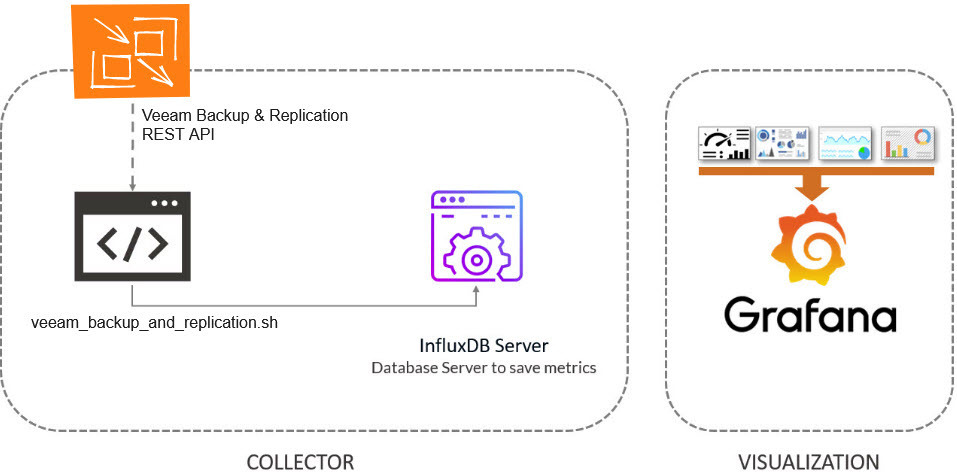
Topology with all logical components

Very simple way of working, we will use a bash shell script that connects to our Veeam Backup & Replication Servers, using the REST API, and then it will send the metrics to InfluxDB, and visualize them with Grafana. The design would be something similar to this:


Download and configure the veeam_backup_and_replication.sh script

We have almost everything ready, we have one last step, the script that will make all this work, we will download the latest version from the Github repository:

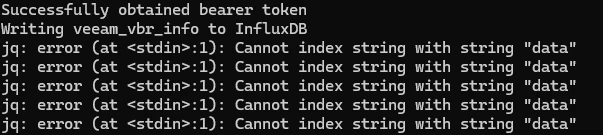
You will need jq, so please go ahead and install it first (apt-get install jq, or yum install jq)

This shell script can be downloaded and run from the telegraf server, InfluxDB, or any other Linux. We will have to edit the configuration parameters:

##
# Configurations
##
# Endpoint URL for InfluxDB
veeamInfluxDBURL="http://YOURINFLUXSERVERIP" #Your InfluxDB Server, http://FQDN or https://FQDN if using SSL
veeamInfluxDBPort="8086" #Default Port
veeamInfluxDBBucket="veeam" # InfluxDB bucket name (not ID)
veeamInfluxDBToken="TOKEN" # InfluxDB access token with read/write privileges for the bucket
veeamInfluxDBOrg="ORG NAME" # InfluxDB organisation name (not ID)

# Endpoint URL for login action
veeamJobSessions="1000"
veeamUsername="YOURVBRUSER"
veeamPassword="YOURVBRPASSWORD"
veeamBackupServer="YOURVBRAPIPORT"
veeamBackupPort="9419" #Default Port

Once the changes are done, make the script executable with chmod:

chmod +x veeam_backup_and_replication.sh

The output of the command should be something like the next, without errors:

Writing veeam_vbr_info to InfluxDB
Writing veeam_vbr_sessions to InfluxDB

If so, please now add this script to your crontab, like for example every 30 minutes:

*/30 * * * * /home/oper/veeam_backup_and_replication.sh >> /var/log/veeam_backup_and_replication.log 2>&1

Grafana Dashboards

I have already spend the time building all the queries, variables etc for you. Just go to Grafana and download it, or use the ID:

Import Grafana Dashboards easily

Knowing the Grafana dashboard ID, we can just import it:18854:

And that’s it. With the menus on the top you can display and adjust the Dashboard to your different choices, like jobs, workloads, etc.:

Please leave your feedback in the comments, or on GitHub.

Hello,

Do you mind sharing the output of the JSON, please? removing the names and other private data.

Sorry, didnt’t see your post. BTW, I’ve only paste the capacities fields, as you can see, it shows 16Tb


Here are more details.


Hi all, i’m try to execute script on a ubuntu 20.04 and only result is: “Forbidden” without any other info.

But if i try to connect on port 9419 via https, VBR reply me with:

“HTTP request sent, awaiting response... 403 Forbidden”

Please, can you help me?

Kind regards


Hi all, i’m try to execute script on a ubuntu 20.04 and only result is: “Forbidden” without any other info.

But if i try to connect on port 9419 via https, VBR reply me with:

“HTTP request sent, awaiting response... 403 Forbidden”

Please, can you help me?

Kind regards

Hello,

If you cannot even connect using the normal swagger described here - https://helpcenter.veeam.com/docs/backup/vbr_rest/evaluation_swagger_ui.html?ver=120

Make sure your VBR API service is up, check that everything is up and running, and please open a support ticket, not for the Grafana part, but just accessing the Swagger, etc.


Thank you

Great suggest to use Swagger integrate into VBR interface Jorge, thank you a lot.

In fact in that instance, API portal not running correctly.

In another instance, all fine.

Thank you :)


Seems like services are down, but it can also be something else, I would suggest you to open a support ticket.


For the VBR that works, give the script a try, working all fine on my end.


@jorge.delacruz Thank you Jorge, very nice article. realy liked it.


Hi all, i’m try to execute script on a ubuntu 20.04 and only result is: “Forbidden” without any other info.

But if i try to connect on port 9419 via https, VBR reply me with:

“HTTP request sent, awaiting response... 403 Forbidden”

Please, can you help me?

Kind regards

Hello,

If you cannot even connect using the normal swagger described here - https://helpcenter.veeam.com/docs/backup/vbr_rest/evaluation_swagger_ui.html?ver=120

Make sure your VBR API service is up, check that everything is up and running, and please open a support ticket, not for the Grafana part, but just accessing the Swagger, etc.


Thank you

Great suggest to use Swagger integrate into VBR interface Jorge, thank you a lot.

In fact in that instance, API portal not running correctly.

In another instance, all fine.

Thank you :)


Seems like services are down, but it can also be something else, I would suggest you to open a support ticket.


For the VBR that works, give the script a try, working all fine on my end.

Hi Jorge,
thank you.
Script working fine, only not recognize correctly backup repo, only “Default Backup Repository” (not used) but not others like my SOBR, linux repo and so one.
Into log file find “Unknown repository type:” and no more.


Hello,

Try using this script I modified yesterday, please:

https://github.com/jorgedlcruz/veeam-backup-and-replication-grafana


Let me know


Hello,

Try using this script I modified yesterday, please:

https://github.com/jorgedlcruz/veeam-backup-and-replication-grafana


Let me know

Hello Jorge

I’ll confirm, i’m using your last script release on 31.01.2025

Thank you


Hello Gabriele, and with the latest script, you still face the same issues? Please go to the swagger as mentioned above, and send me the output on private message so I can debug.


Hello everyone,

I'm currently working on a lab as part of my Veeam studies. While trying to follow the procedure as instructed, I'm encountering some errors when running the provided script.


Could you please help me with this issue?

Kind regards,


Hello everyone,

I'm currently working on a lab as part of my Veeam studies. While trying to follow the procedure as instructed, I'm encountering some errors when running the provided script.


Could you please help me with this issue?

Kind regards,

Hello, what VBR Version are you running? Also, what license do you have in Veeam Backup & Replication? Do you have jobs configured?

I’m using the version 12.3 community.
Yes , i have some jobs configured.