

In my previous article, I walked through the process of setting up Microsoft Sentinel and configuring Azure Arc and Azure Monitor Agent to collect Veeam application events using syslog. It had a great response from the Veeam community both externally and internally, and I’m happy to share part two with you today. Let’s dive right in.
Analytics rules
Now that you have your Veeam events ingesting into Sentinel, it’s time to define the business logic that scans the data for notable events. These are called analytics rules. Based on the rules you define, Sentinel will create alerts and incidents based on the events occurring in your environment.
You have a few options to create rules. For our example, we’ll use the scheduled query rule option to run a query every 15 minutes. However, as with many cybersecurity scenarios, time is of the essence, and the sooner you are aware of an event, the sooner you can respond and minimize impact.
Accordingly, Microsoft provides an option for an NRT query rule, or near-real-time query rule, that runs once every minute. There are important limitations and considerations for this rule type you should be aware of that are beyond the scope of this article to address and explain. You can find the details in Microsoft’s Sentinel documentation under Near-real-time (NRT) analytics rules.
Although I won’t be covering this rule type in this article, I want you to be aware of it so you can employ it as befits your security requirements.
Notable events
A new feature added in Veeam Backup & Replication 12.1 called four-eyes authorization requires another Veeam Backup Administrator or Veeam Security Administrator to approve certain sensitive operations like deleting backup files. This enhancement serves to protect you against a single compromised account wreaking havoc in your backups.
Turning off a security feature like this could signal suspicious activity as disabling it requires approval from another Veeam administrator. We would want to be alerted of this event. For our Sentinel analytics rule example, we’re going to do just that—create a rule that triggers an alert and corresponding incident when this feature is disabled.
To create a rule that searches for this event, we must first know how the event is logged and formatted in the syslog output and its unique identifiers. You’ll be glad to know that as of the release of Veeam Data Platform 12.2, there is now a dedicated help center guide for events called the Event Reference.
The reference guide includes columns on the Event IDs List page for MITRE ATT&CK tactics and techniques. Events which include tactic and technique identifiers are those which we’ve reviewed and determined should be used in security queries and analytics. This article will focus on just one event and example as a starting point for building out your Veeam security monitoring solution with Microsoft Sentinel.
Back in the event reference guide, searching for “four-eyes” yields a page for the Four-Eyes Authorization Disabled event. Open this page in a new tab and keep it handy. Now let’s jump into Azure and create the rule.
Create a scheduled query rule
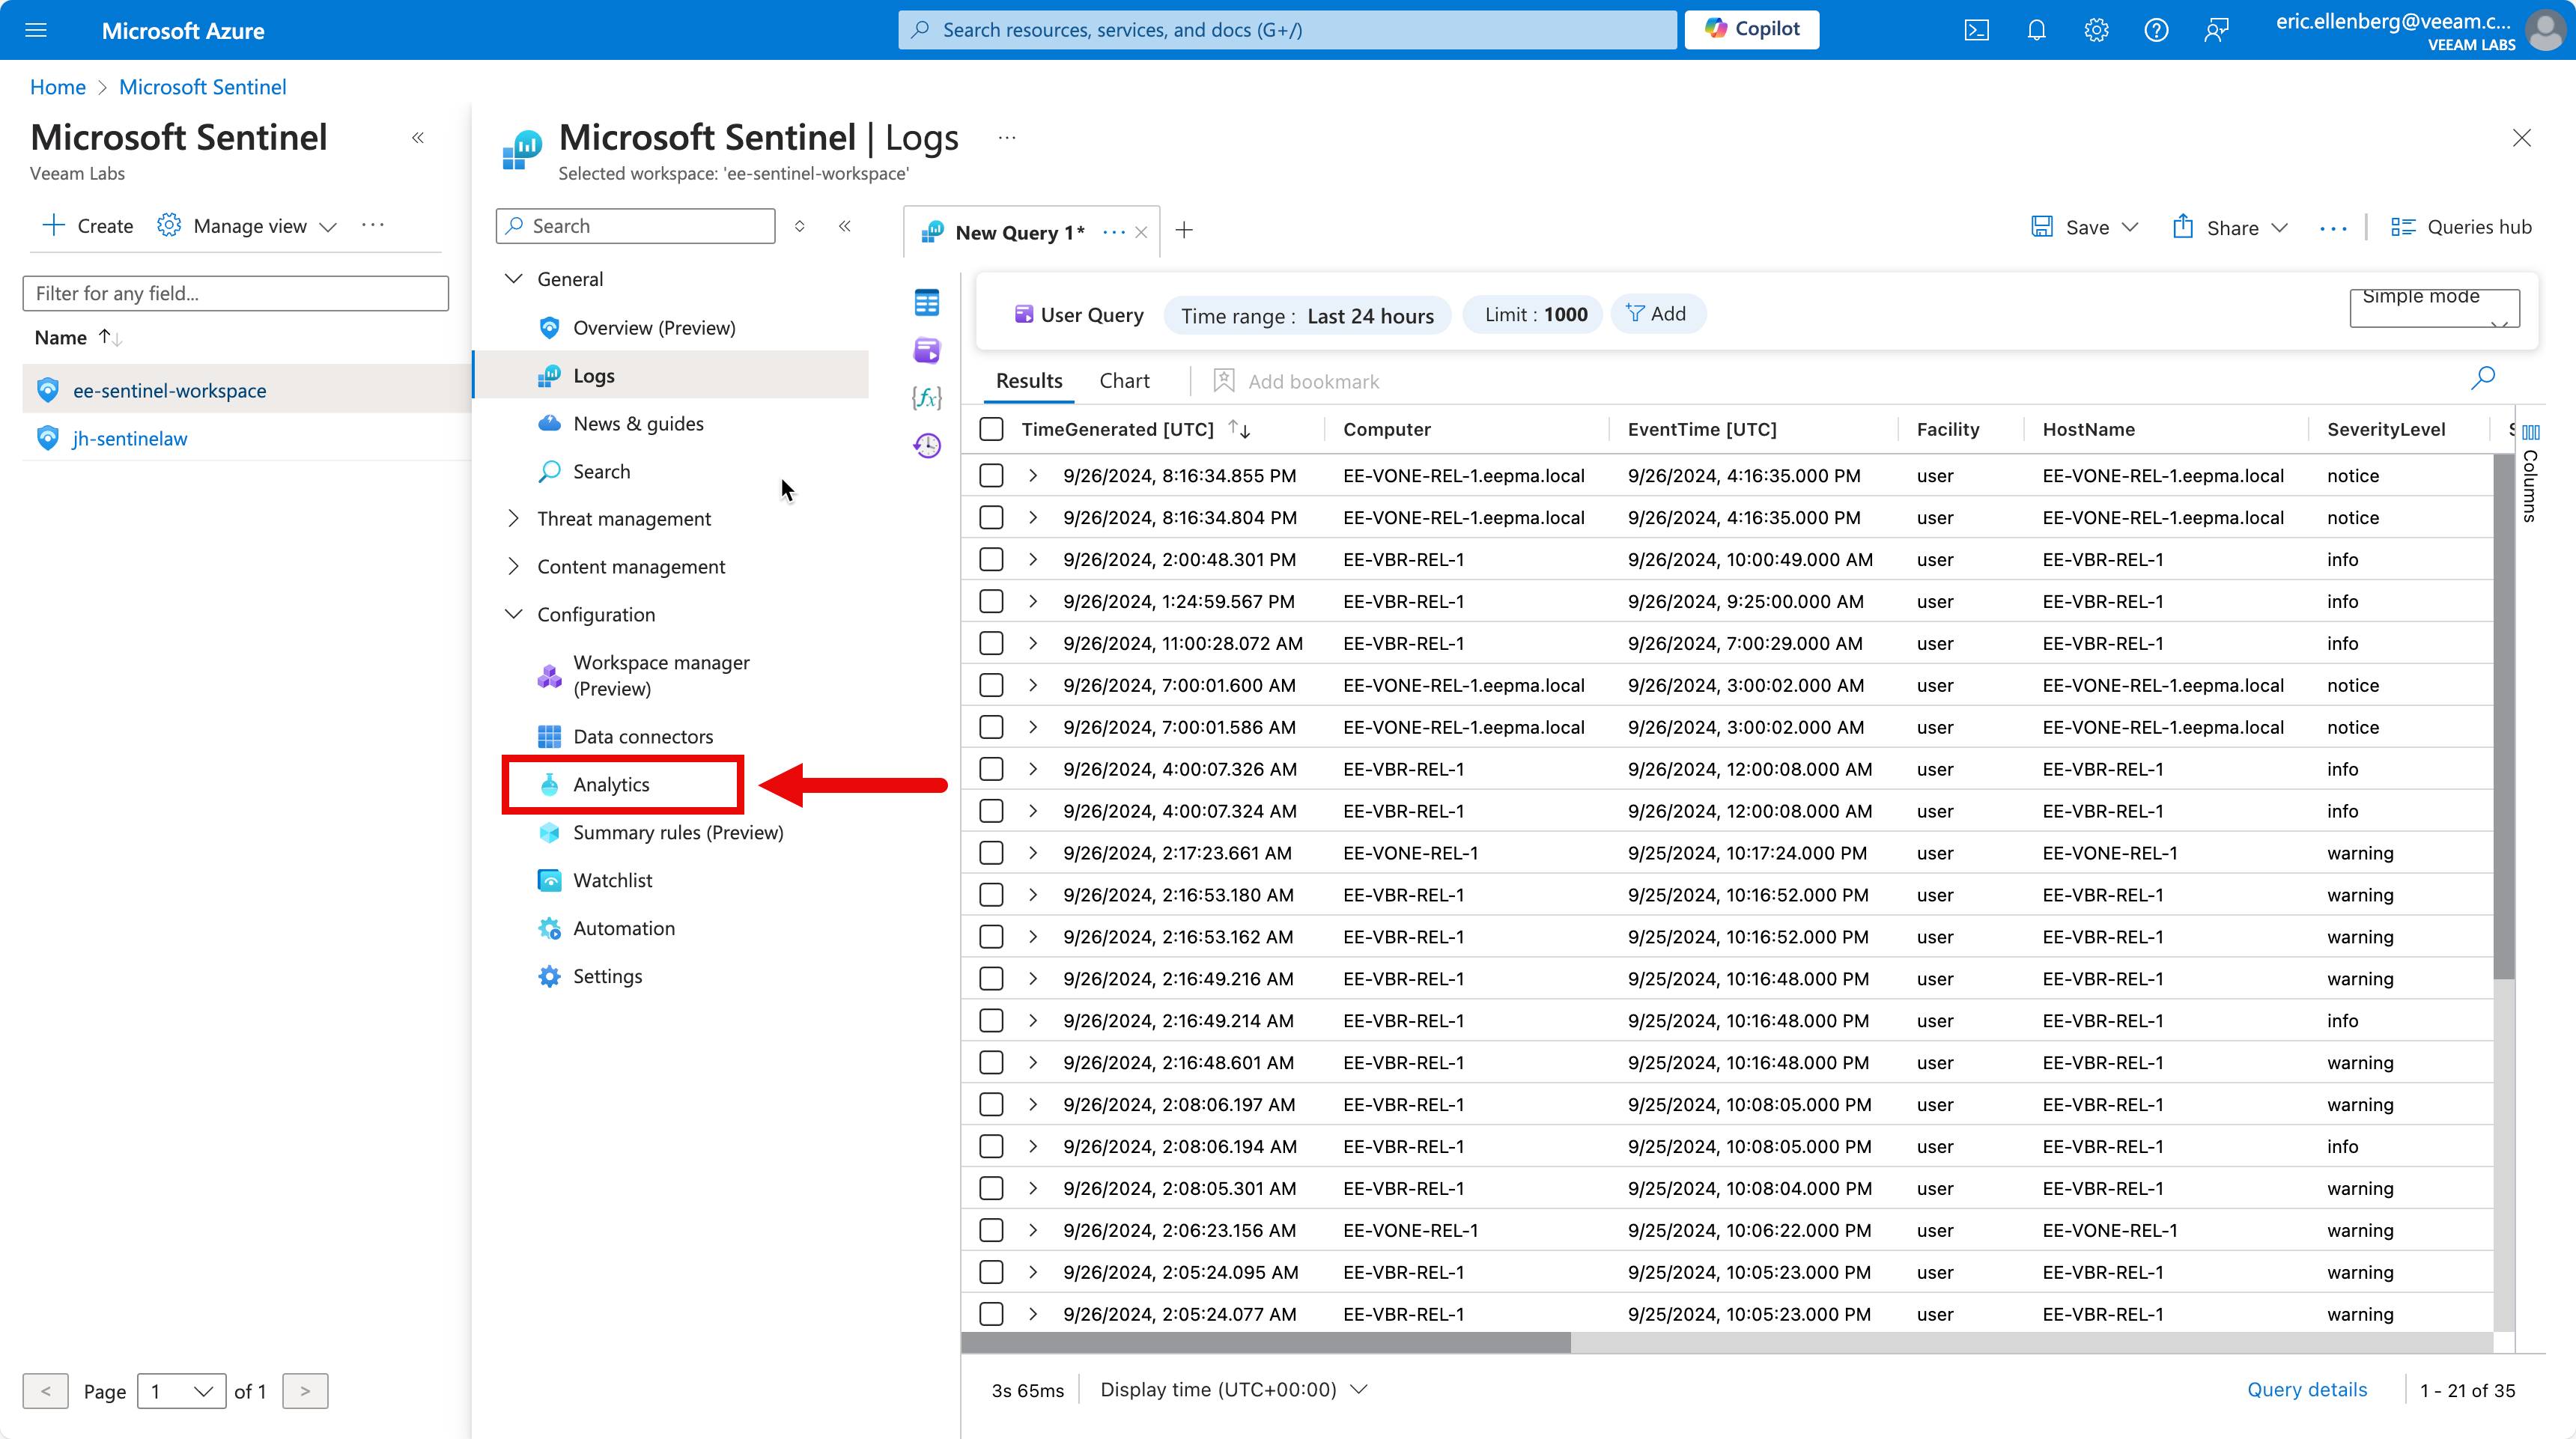
- Log into the Azure portal and go to the Microsoft Sentinel service.
- Select your workspace, then expand Configuration in the left menu and select Analytics.
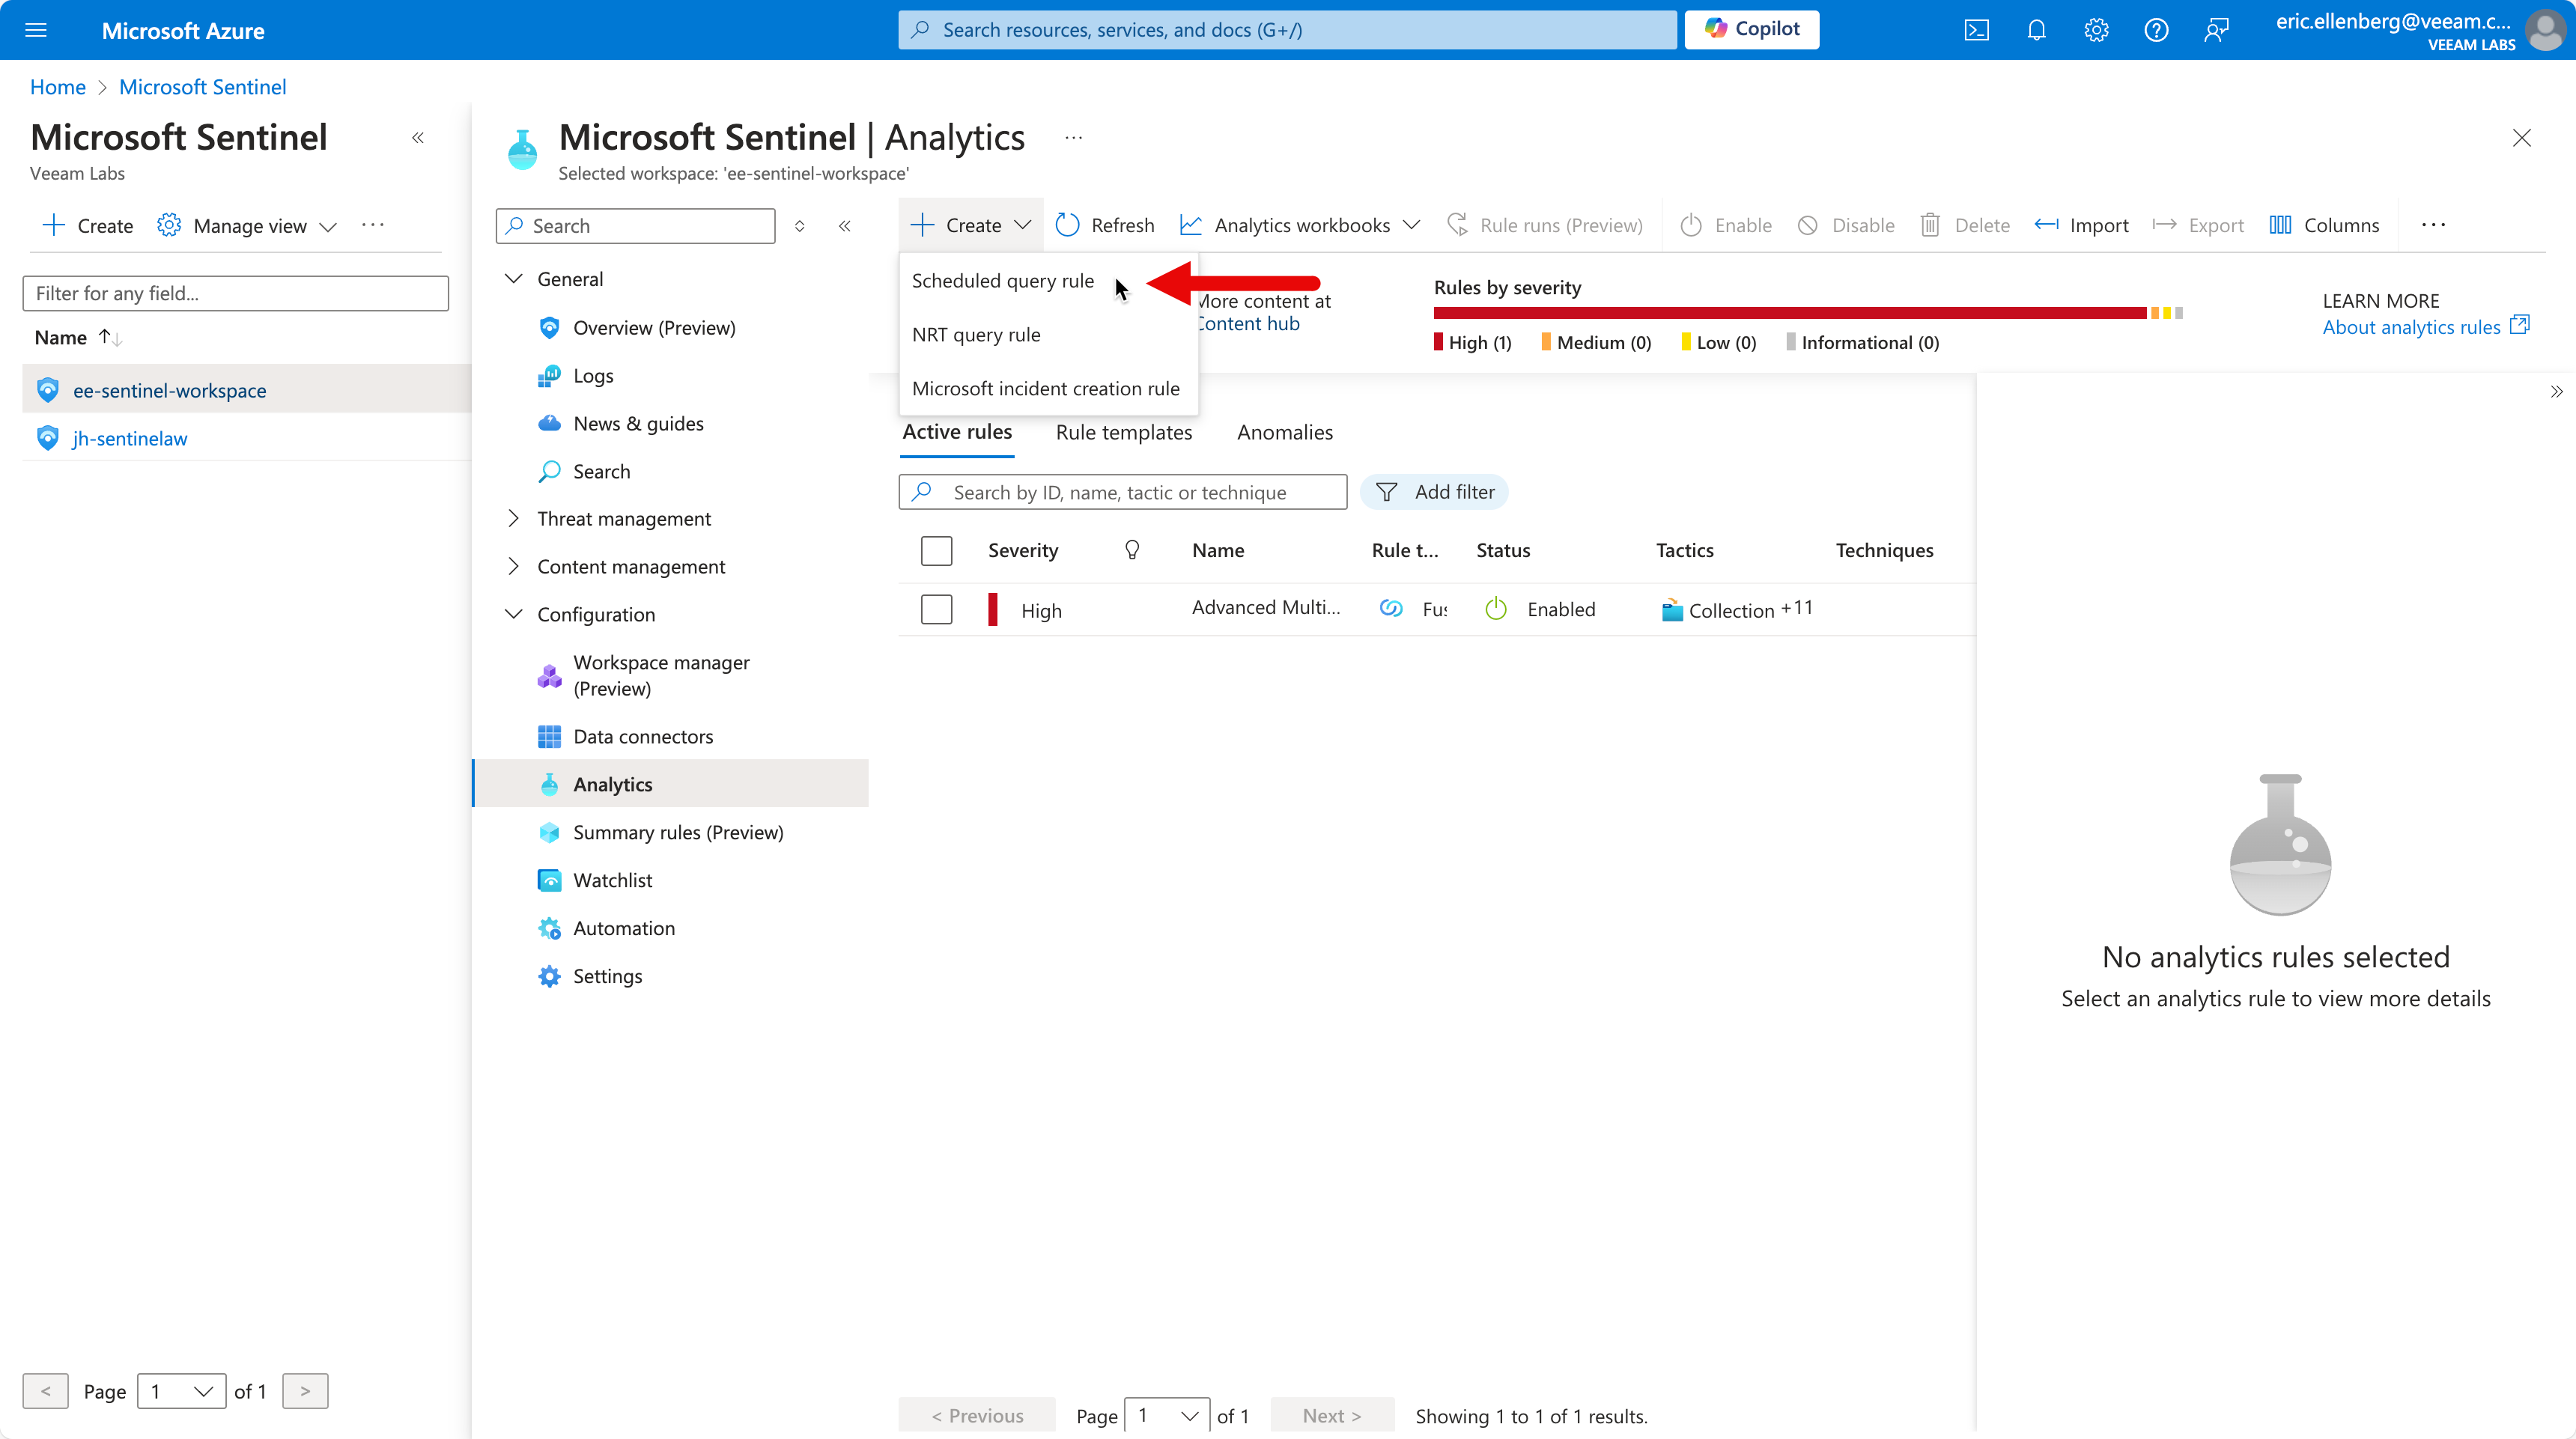
- Select Create in the top nav, then select Scheduled query rule.
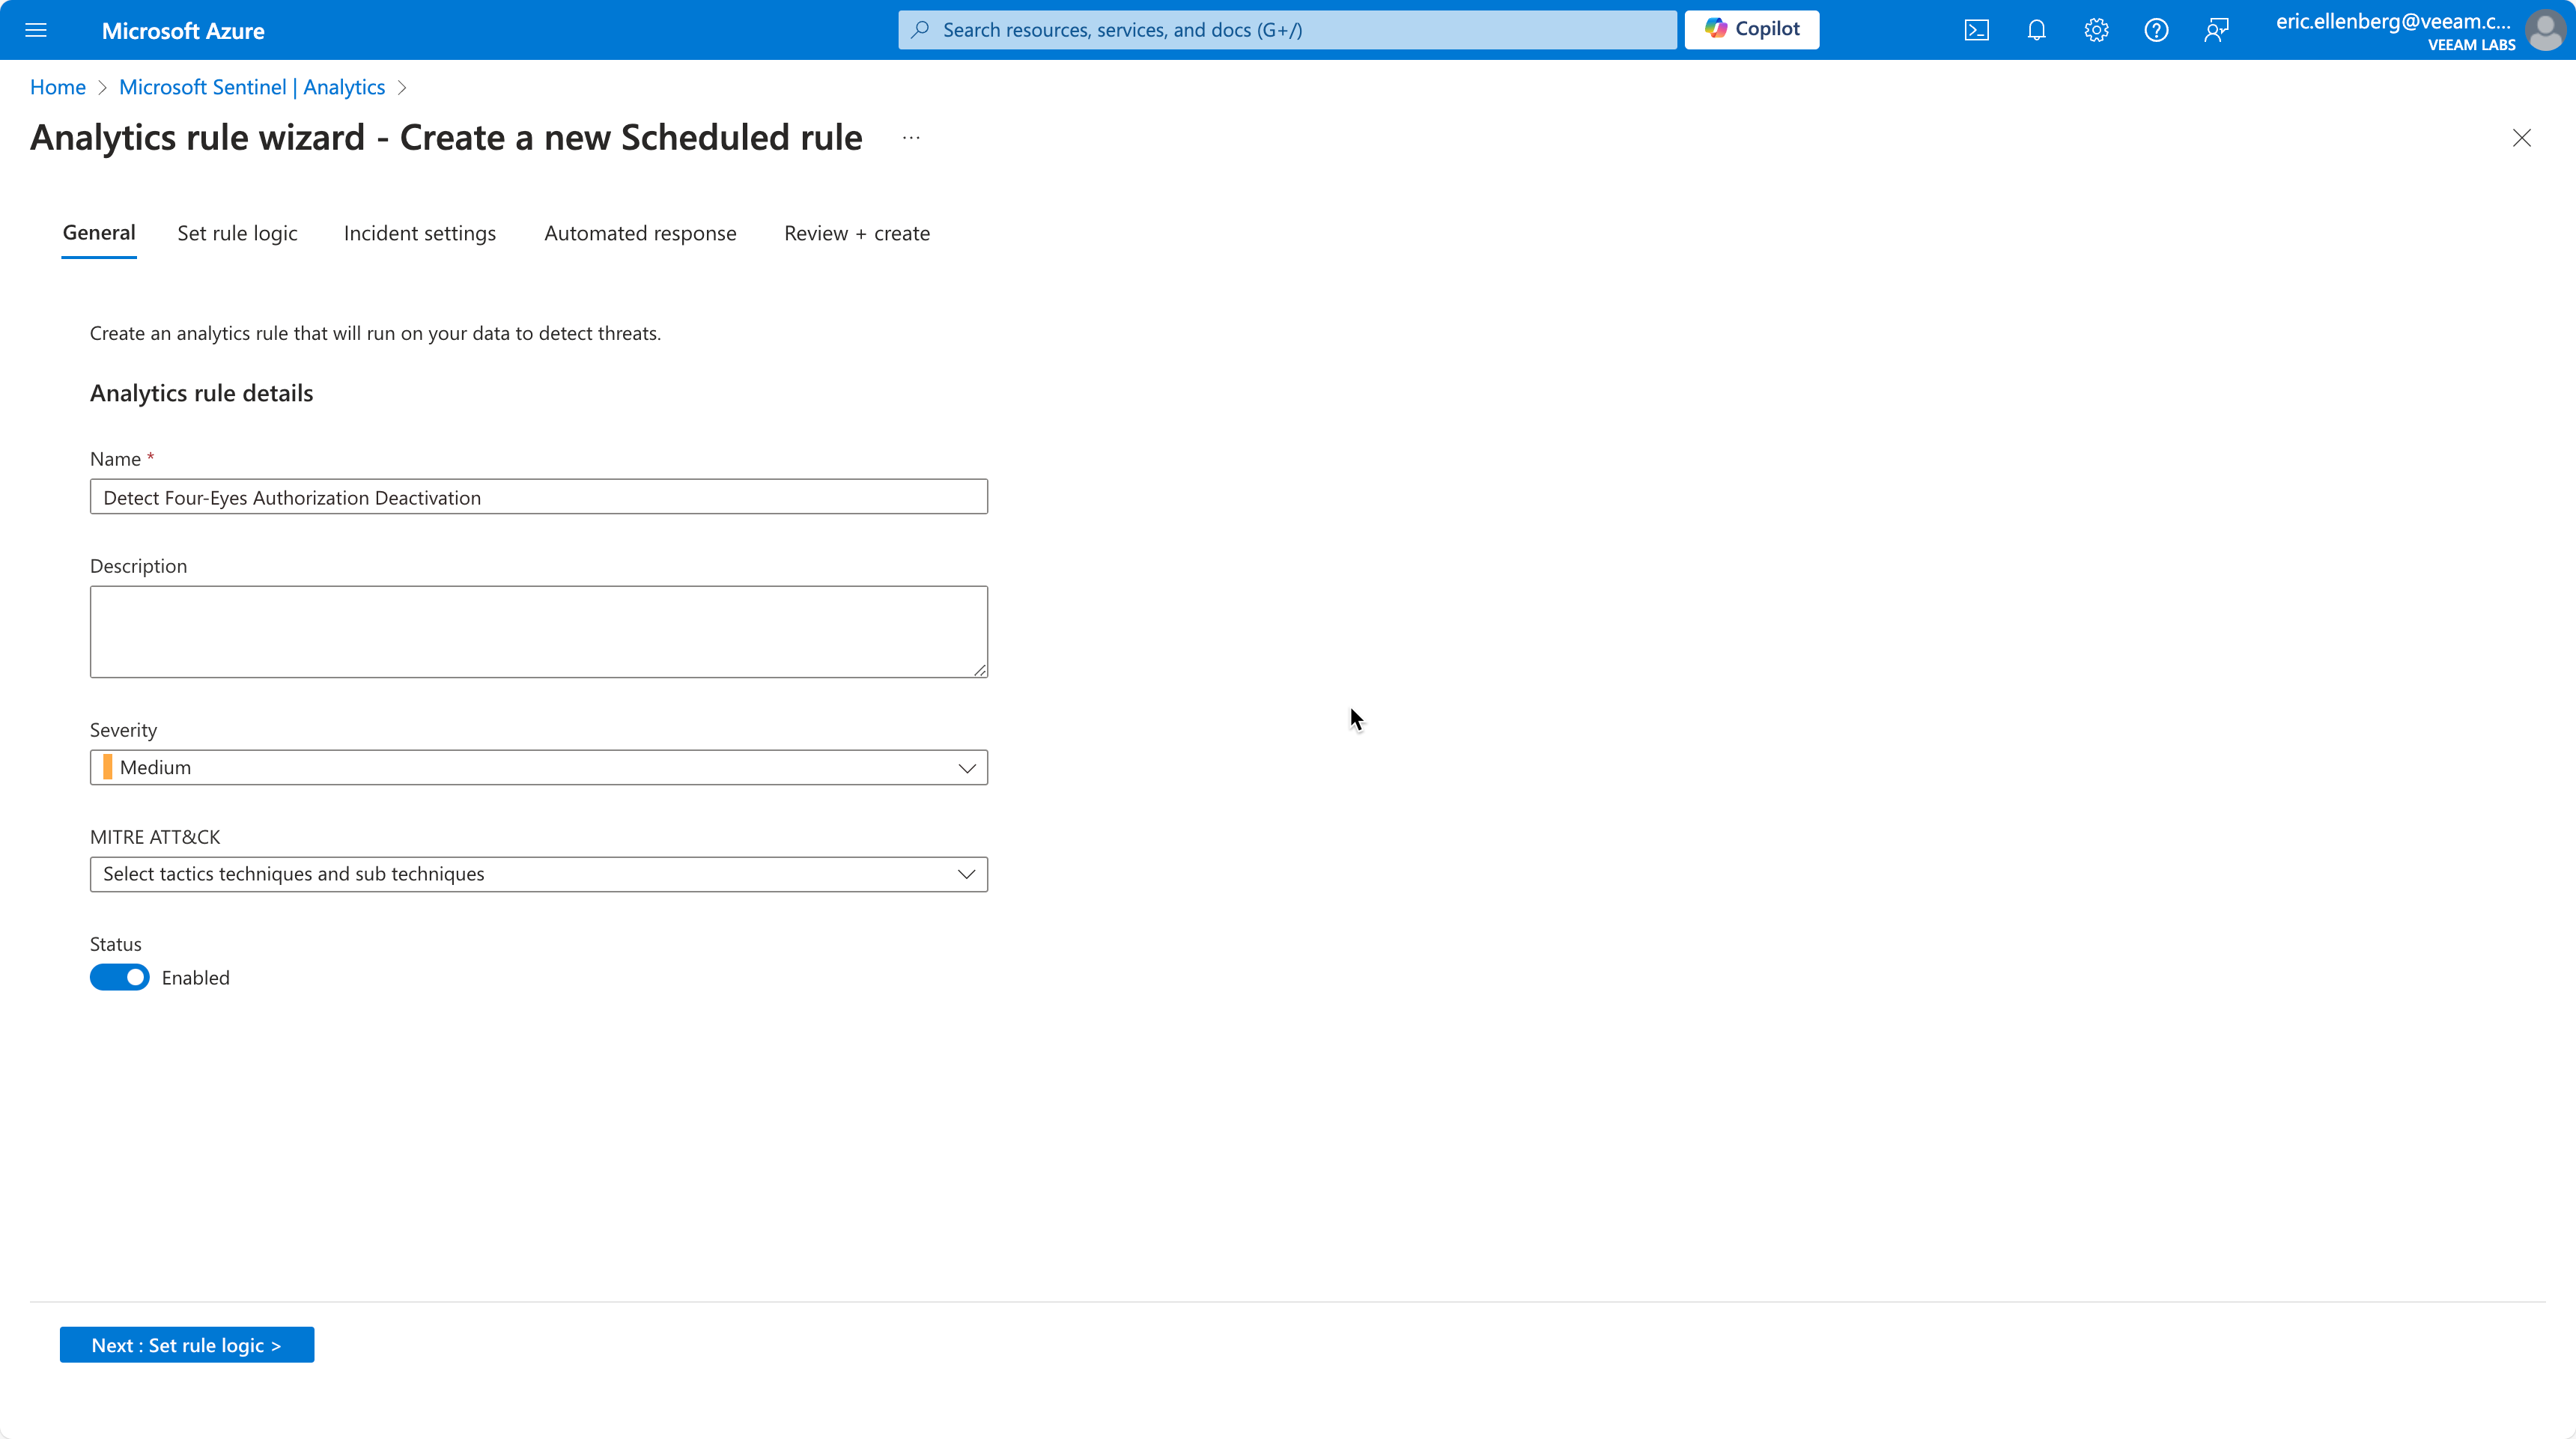
- Give your rule a name and set a severity level. If you use the MITRE ATT&CK framework to classify events, refer to the Event IDs List page in the Event Reference for classification recommendations.
Select Next: Set rule logic > to proceed.
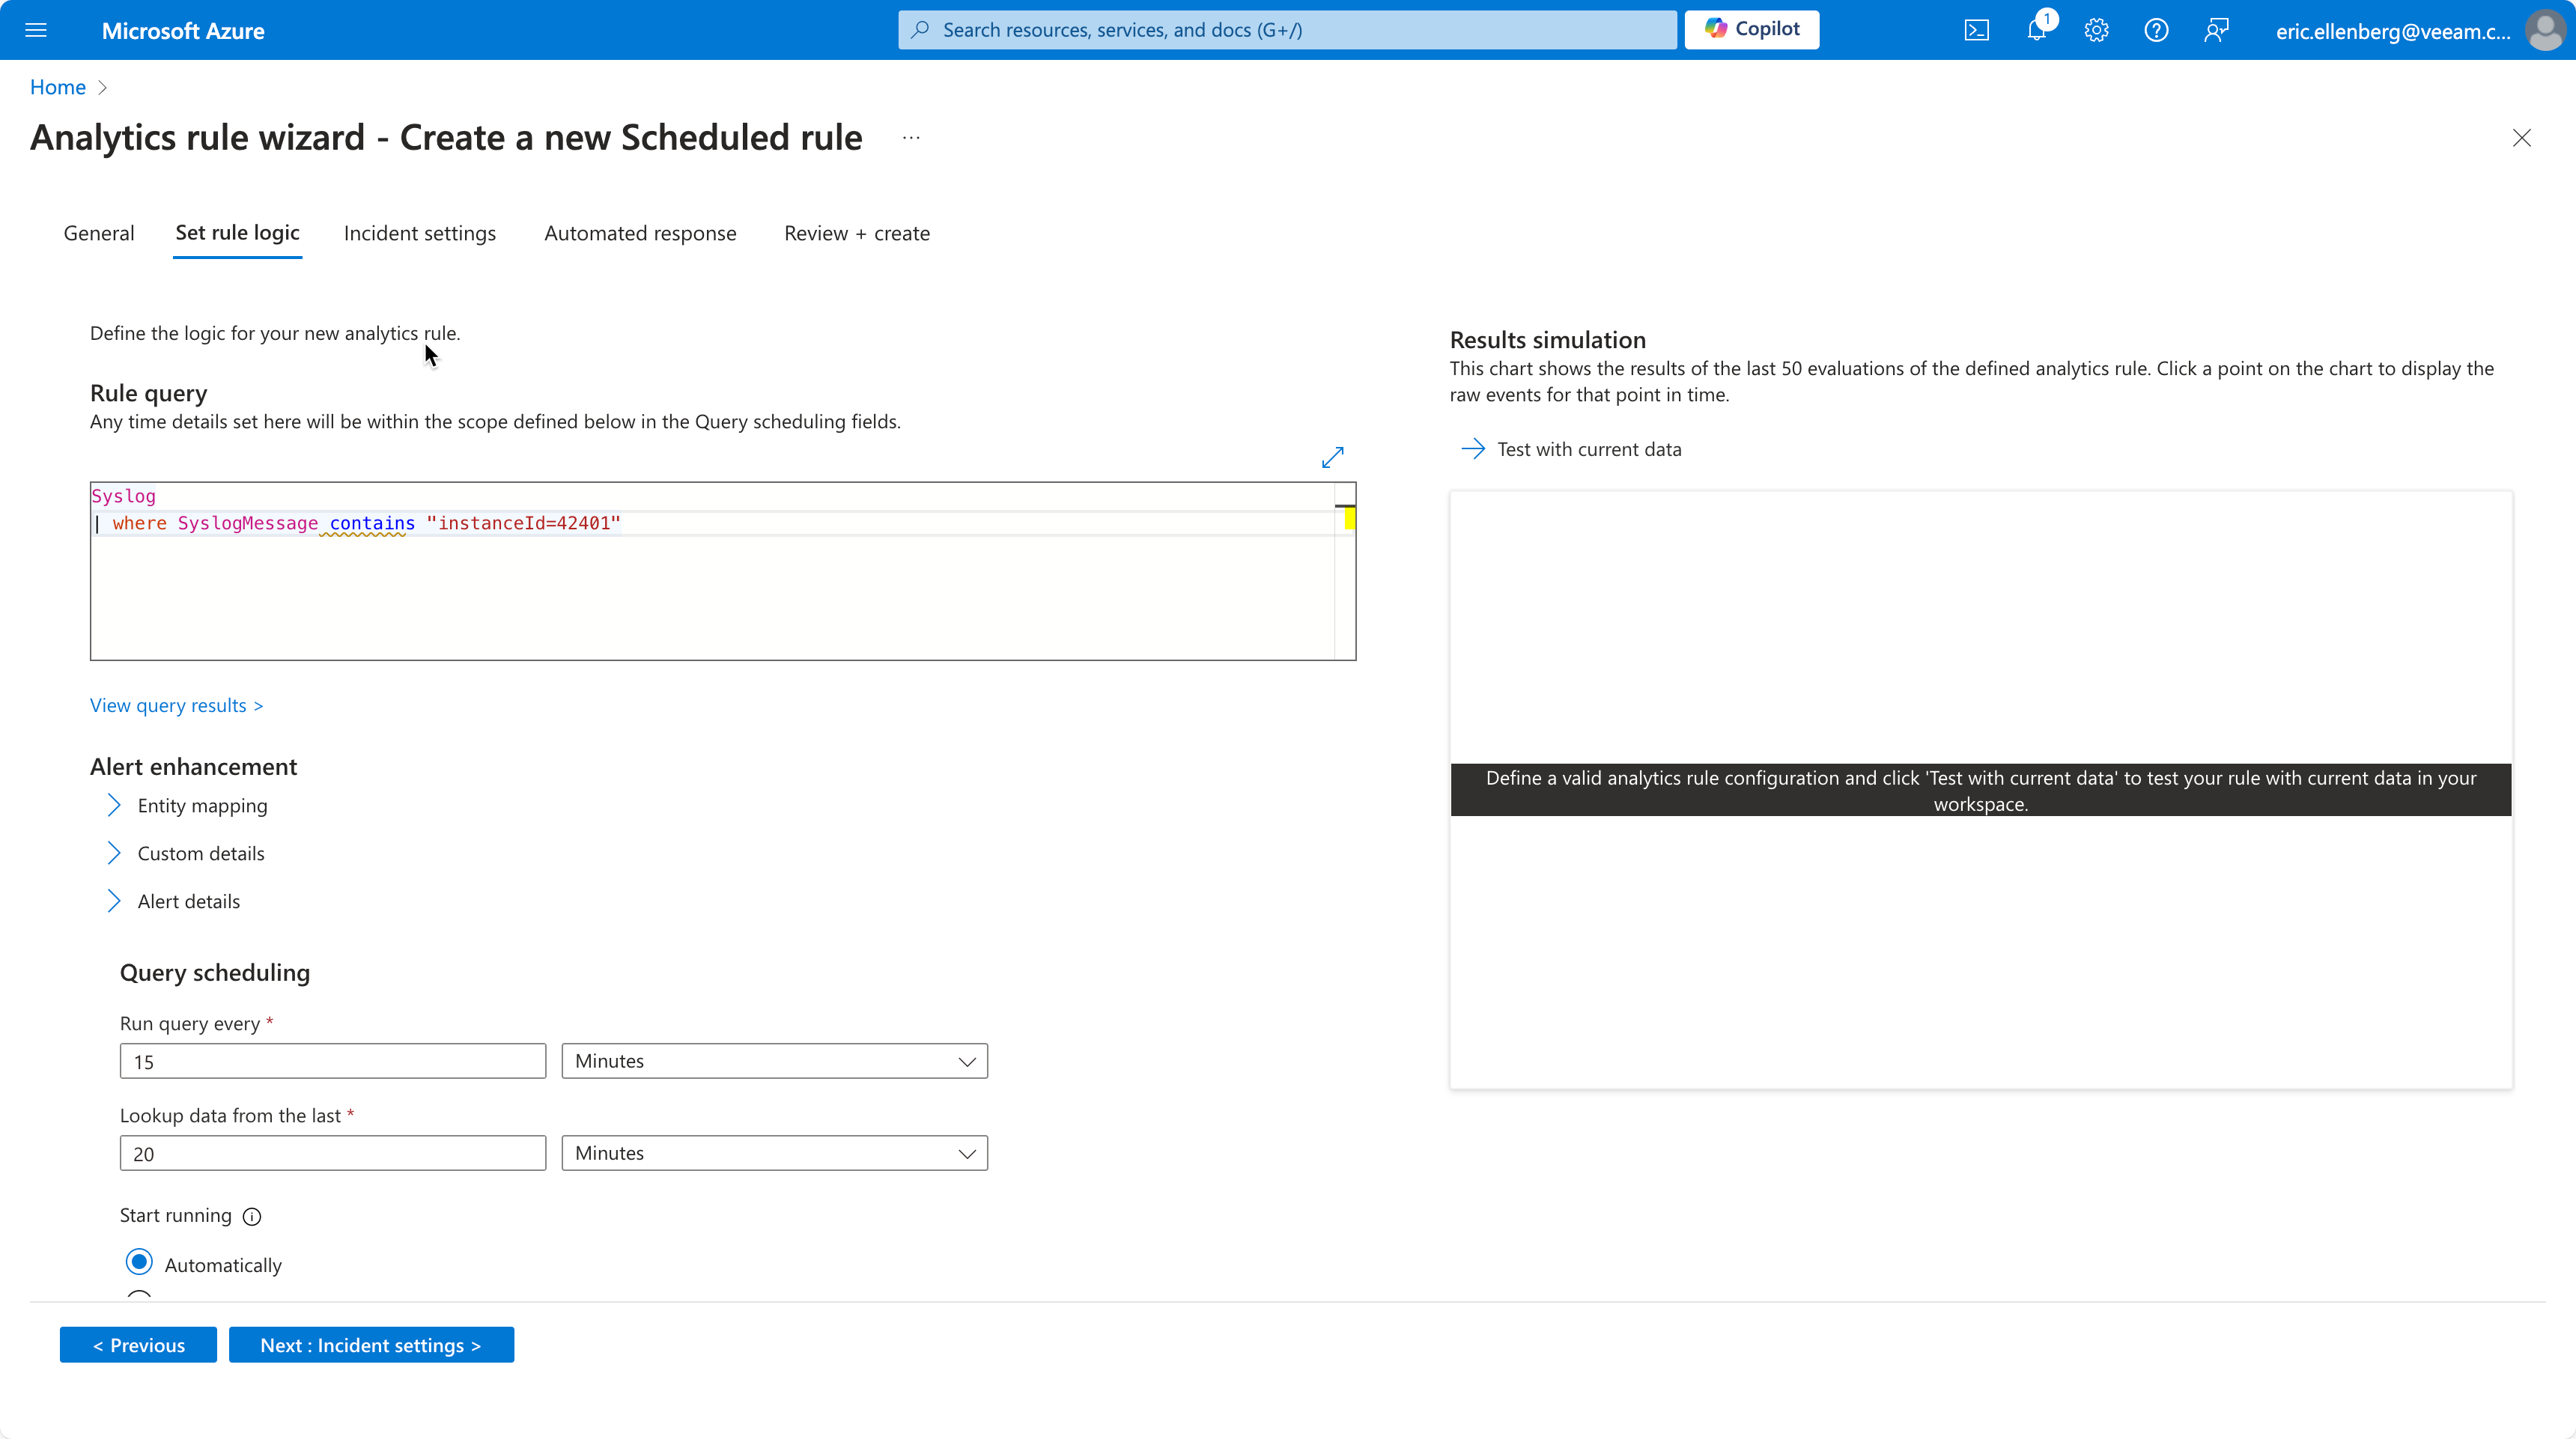
- This step is where you define the query for the analytics rule. For our example, we will keep it as simple as possible and use the following query.
Syslog | where SyslogMessage contains "instanceId=42401"
The full background on the Kusto Query Language that Sentinel uses is beyond the scope of this article. For our use cases, you will generally begin with the Syslog data source and create a filter that searches for a particular instance ID as defined in the Veeam Event Reference guide. - With your query in place, now configure the schedule. For our example, use 15 minutes for the Run query every field and 20 minutes for the Lookup data from the last field.
- The topic of rule scheduling requires some additional detail to ensure you do not miss any notable events.
There are two components to a rule schedule: the frequency and the lookback window.
The frequency is simple enough: how often the query will run. In our example, we are specifying 15 minutes. For a scheduled query rule, the lowest possible value is 5 minutes—anything lower than 5 minutes requires an NRT rule.
The lookback window defines a time filter for how far back to search for the data in the query. The purpose of the lookback window is to account for the latency between when an event is generated and when it is ingested by Sentinel. This is important to factor into your rule schedules because scheduled queries filter based on the event’s TimeGenerated property, not the time the event was ingested by Sentinel. Consequently, if an event is not ingested within the lookback window of the current rule evaluation run, the next rule evaluation run will not register the event as having occurred because it was generated during a previous run’s lookback window. This would result in no alert for a notable event.
This is explained in further detail in the Microsoft Sentinel documentation on how to handle ingestion delay. Be mindful of this when you’re creating your rules. In our example, I’ve adjusted the lookback window +5 minutes over the frequency schedule to allow for a 5 minute ingestion delay.
- The topic of rule scheduling requires some additional detail to ensure you do not miss any notable events.
- There are a few additional fields and properties to finalize your rule logic on this page. In our example:
- Start running is set to Automatically
- Alert threshold is set to Is greater than 0, so that even the first instance of someone disabling this feature will trigger an alert
- Event grouping is set to Trigger an alert for each event as this is not an event that would occur multiple times in rapid succession where you’d want them grouped together
- Suppression is set to off so that if there were a scripted event that toggled this setting, your rule would alert for each time the event occurred rather than just the first time during a given interval
- Finally, click Next: Incident settings > to proceed onto the next step.
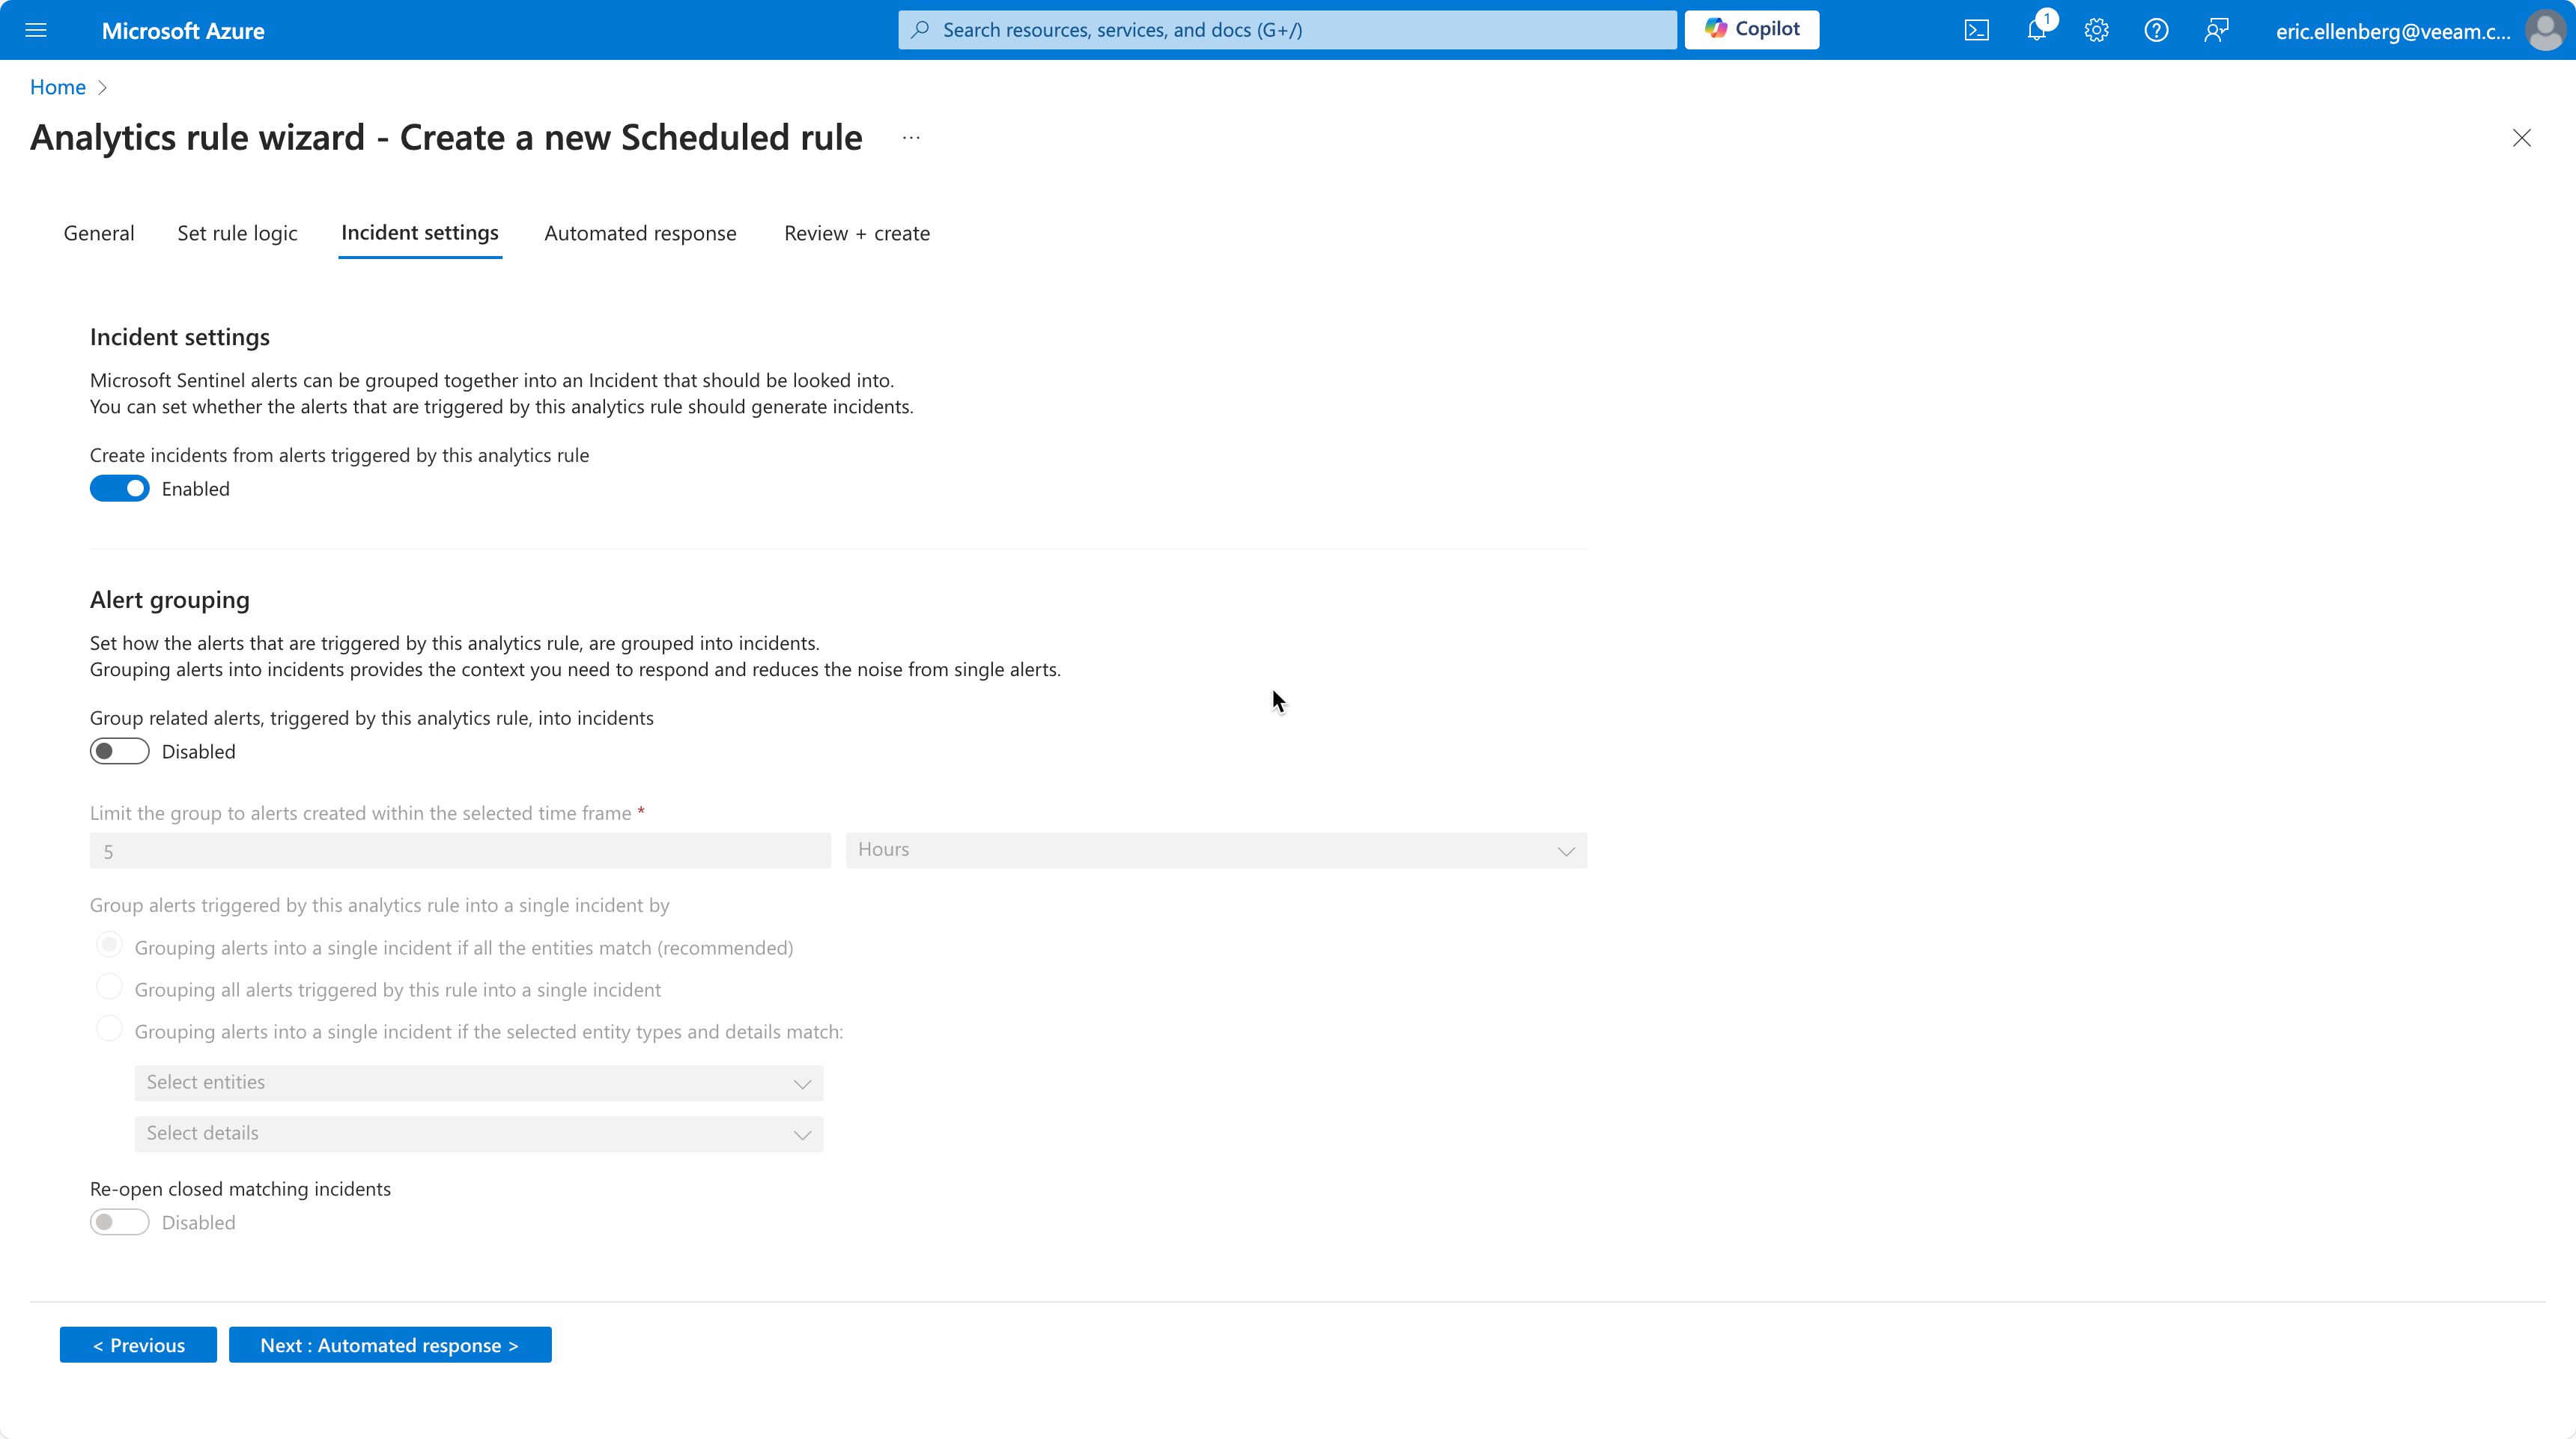
- Under Incident settings, select whether you want this alert to create an incident when it is triggered. In our example, we’re setting it to Enabled.
Where the previous page had a setting for event grouping, this page has a setting for Alert grouping to allow you to group multiple alerts into a single incident. For our example, we’re leaving this setting Disabled.
Select Next: Automated response > to proceed to the next step.
- As mentioned before, a prompt response to cybersecurity events is crucial to minimizing impact. This step is where you configure the automation rules you want to perform in response to changes in incident status. This is where you can begin to build workflows to streamline the operations and actions that need to happen in response to an event. For now, we’re going to skip this step.
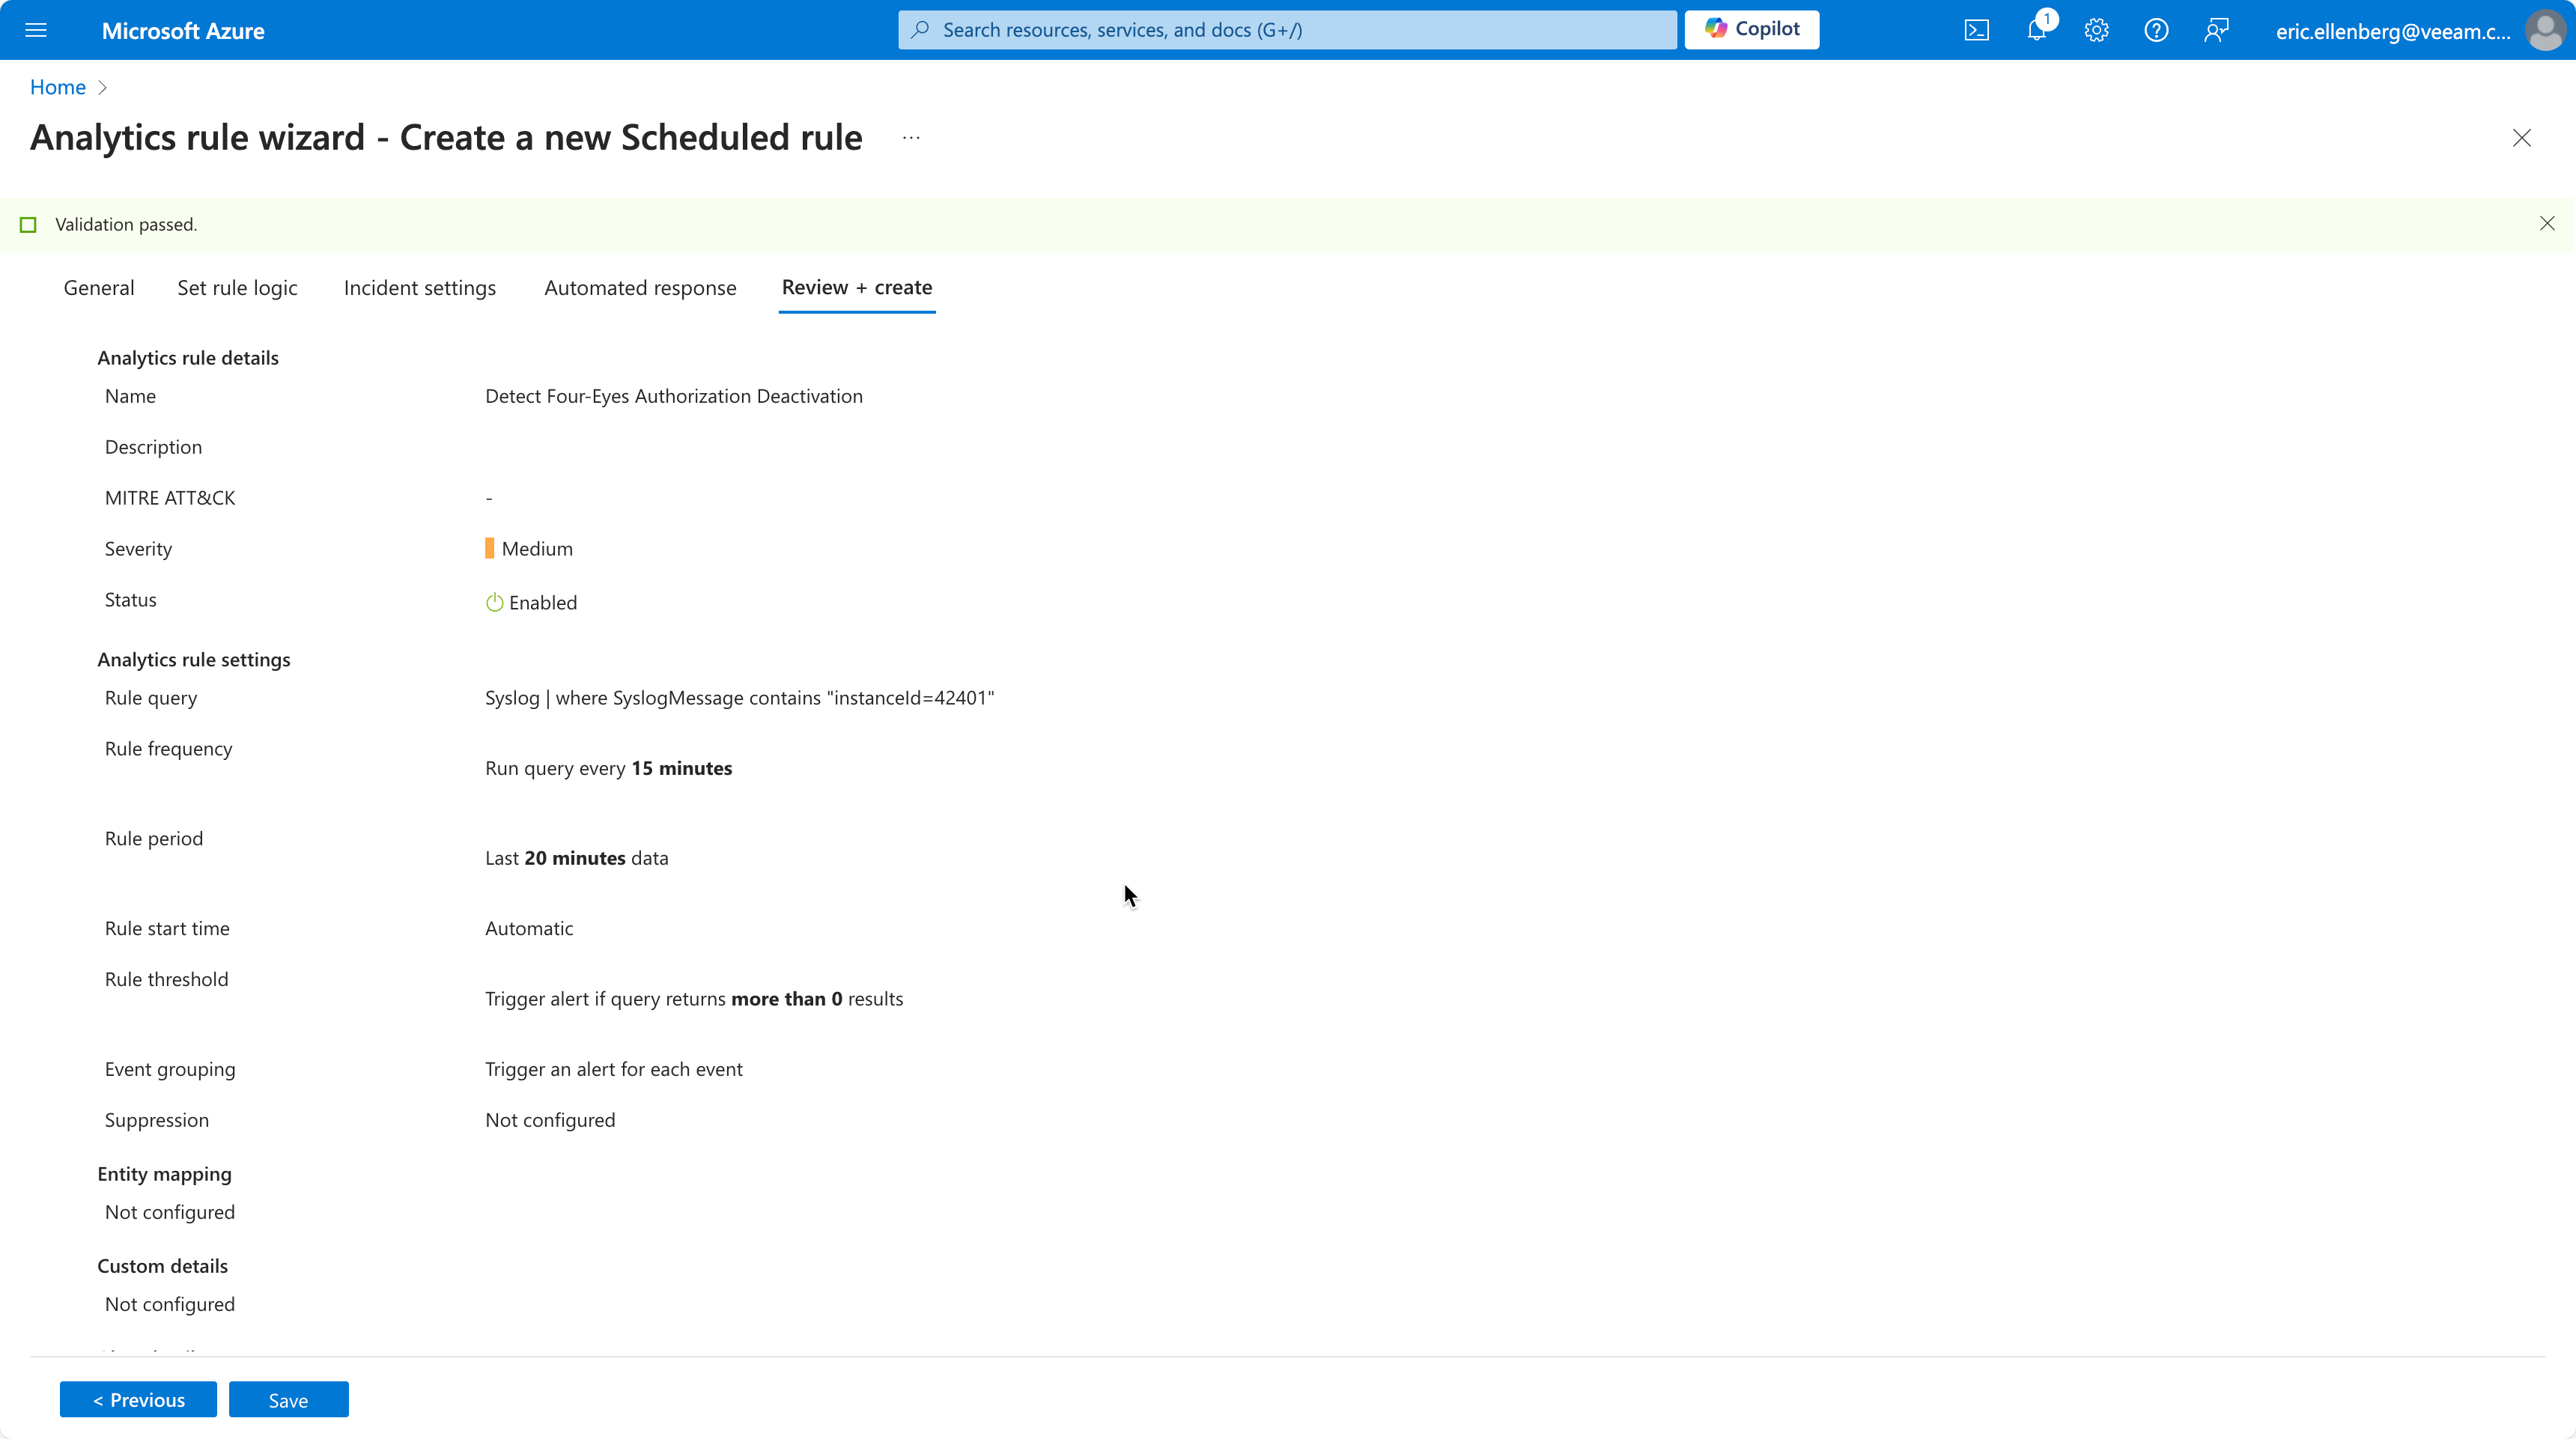
Click Next: Review + create >.
- On this last page, your rule settings will be validated and presented for your review. Click Save to finish.
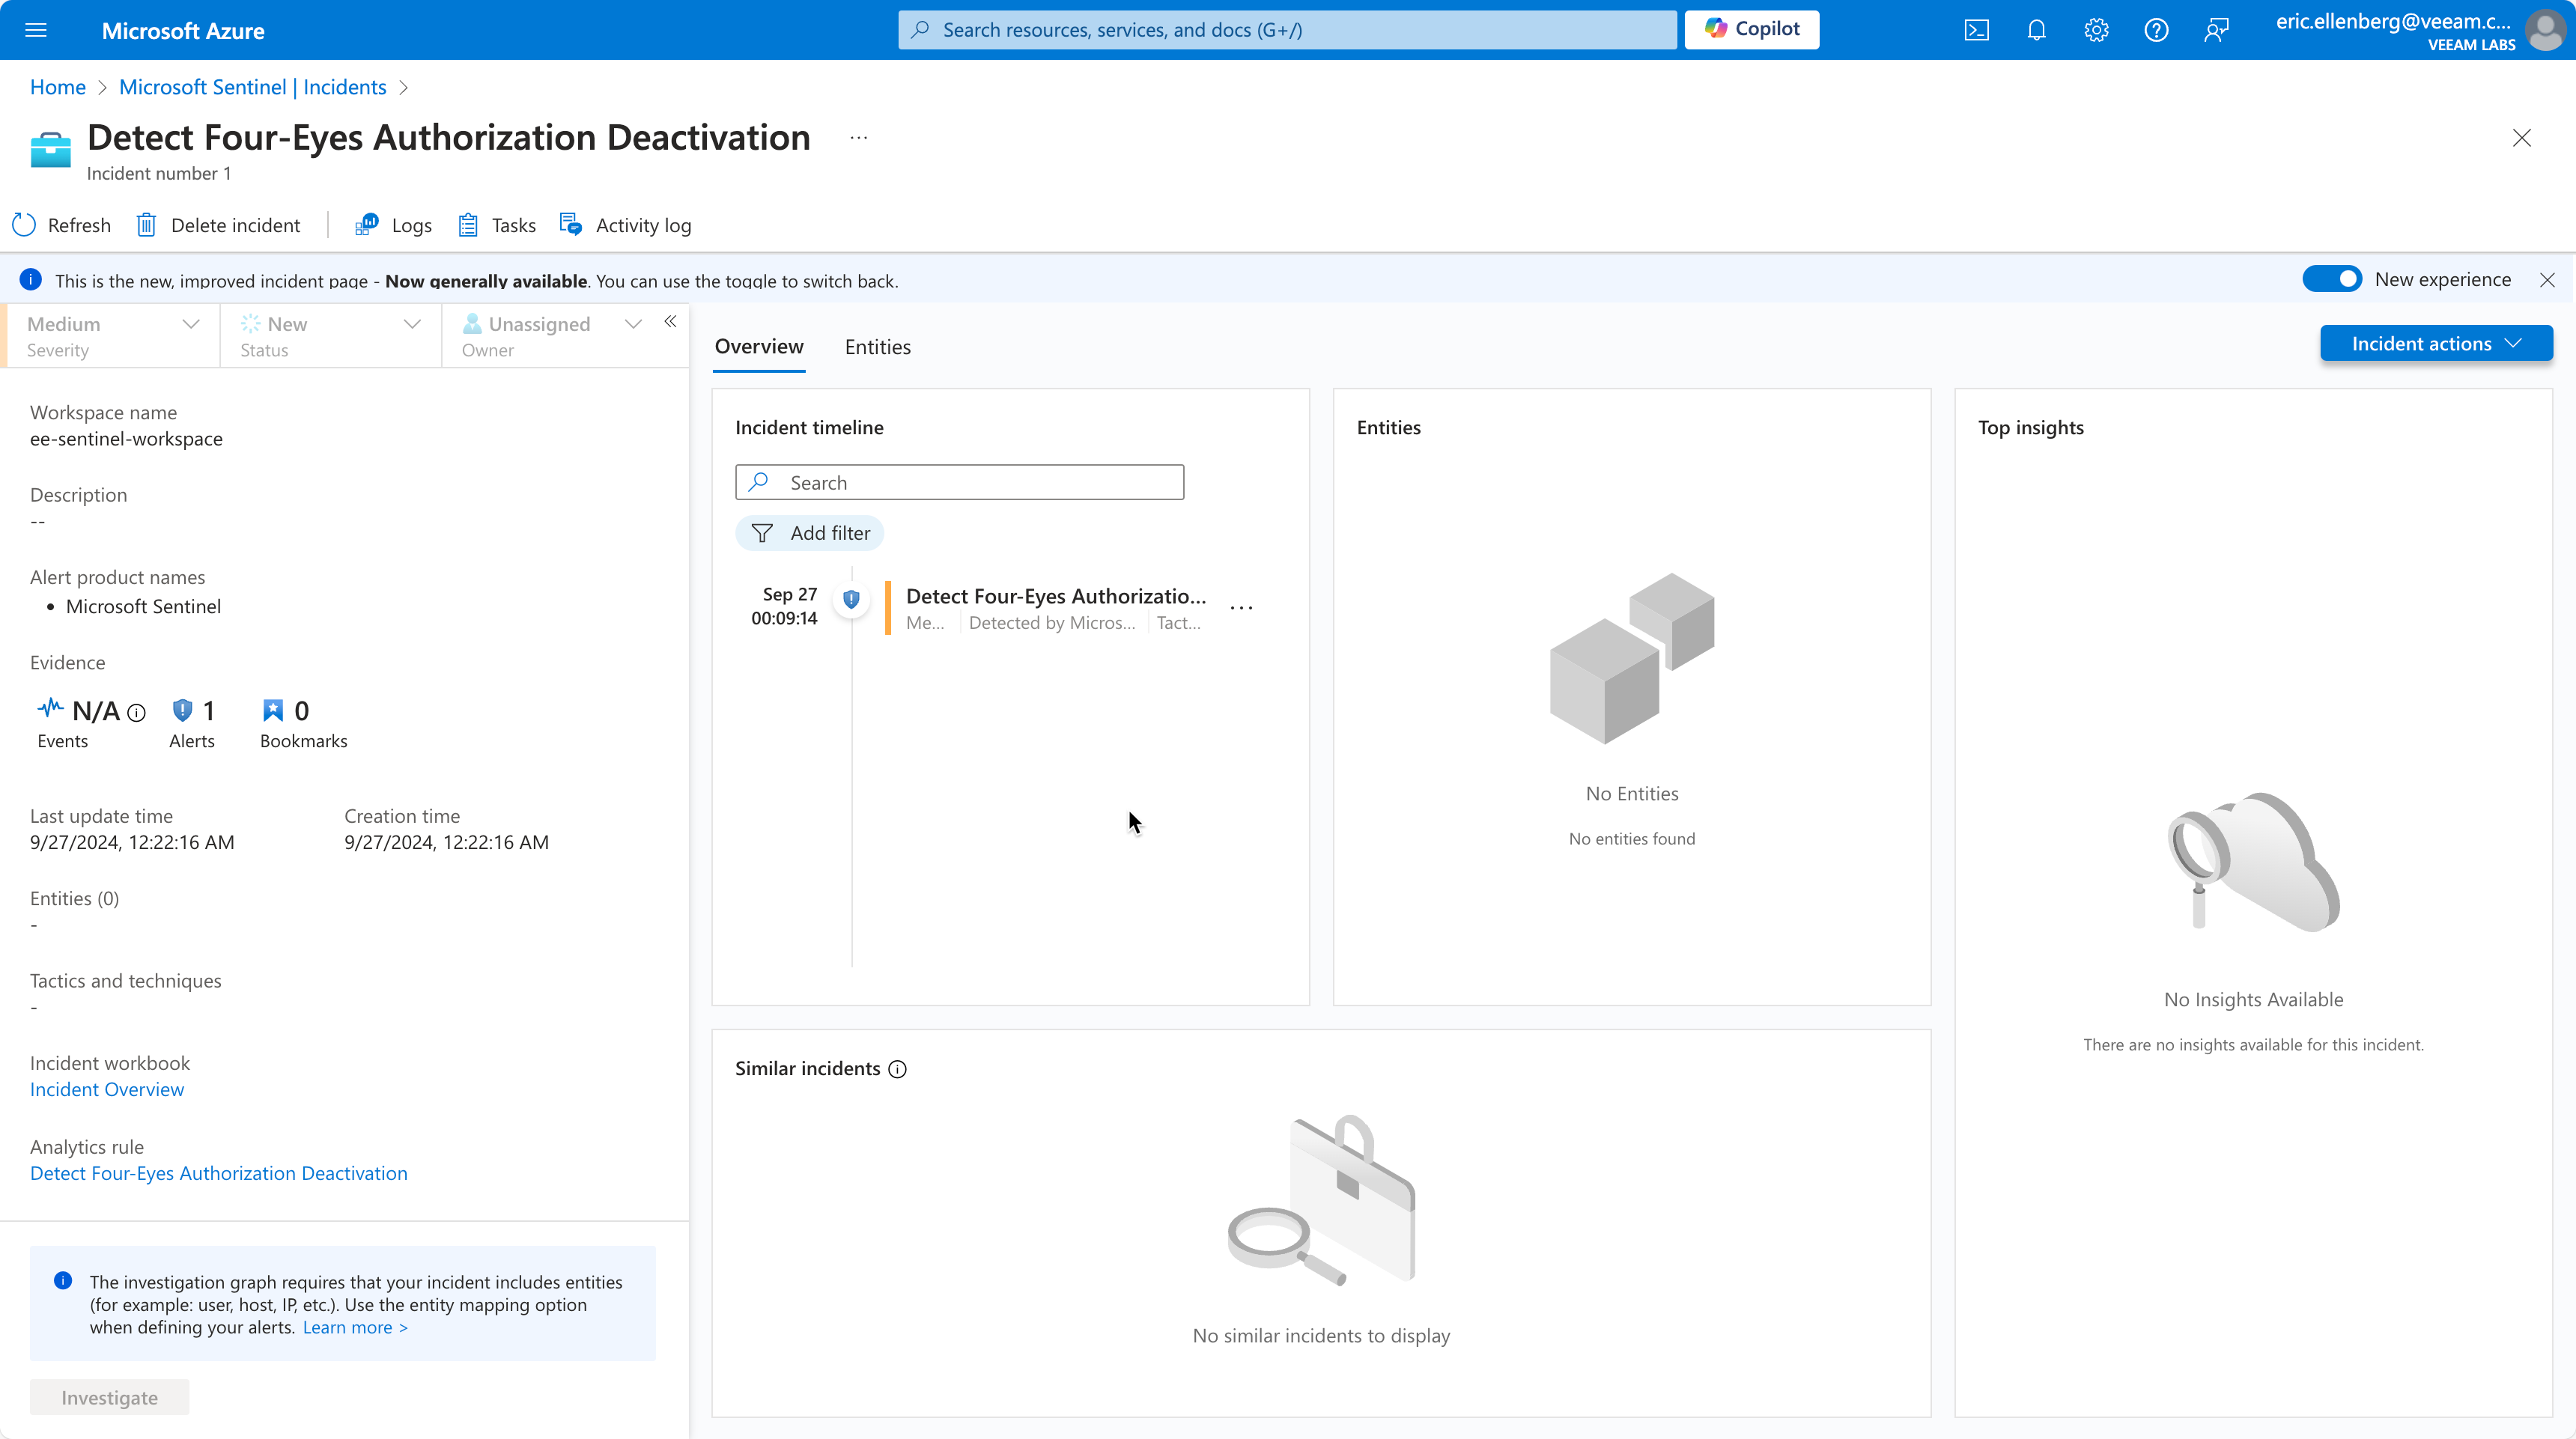
Congratulations, you’ve created your first analytics rule in Microsoft Sentinel. Should this event occur, now you will have an alert and associated incident to notify you.
More to come!
