I’d like to draw your attention to a small but significant feature that was introduced in Veeam Backup & Replication 12.1: Syslog support. As documented in the user guide (and in Veeam KB4522 with a few extra details), VBR 12.1’s syslog conforms to the industry standard RFC 5424 specification and supports UDP, TCP, and TLS transports.
This feature opens the door to a huge array of security solutions. As you’ll see, this creates new opportunities for customers to incorporate VBR’s application events and malware signals into their broader security architectures and workflows to fortify their digital immune system.
Veeam Backup & Replication, Meet Microsoft Sentinel
As an example of what’s possible with syslog, I will walk you through how to set up VBR to send events to Microsoft Sentinel, Microsoft’s cloud-native SIEM.
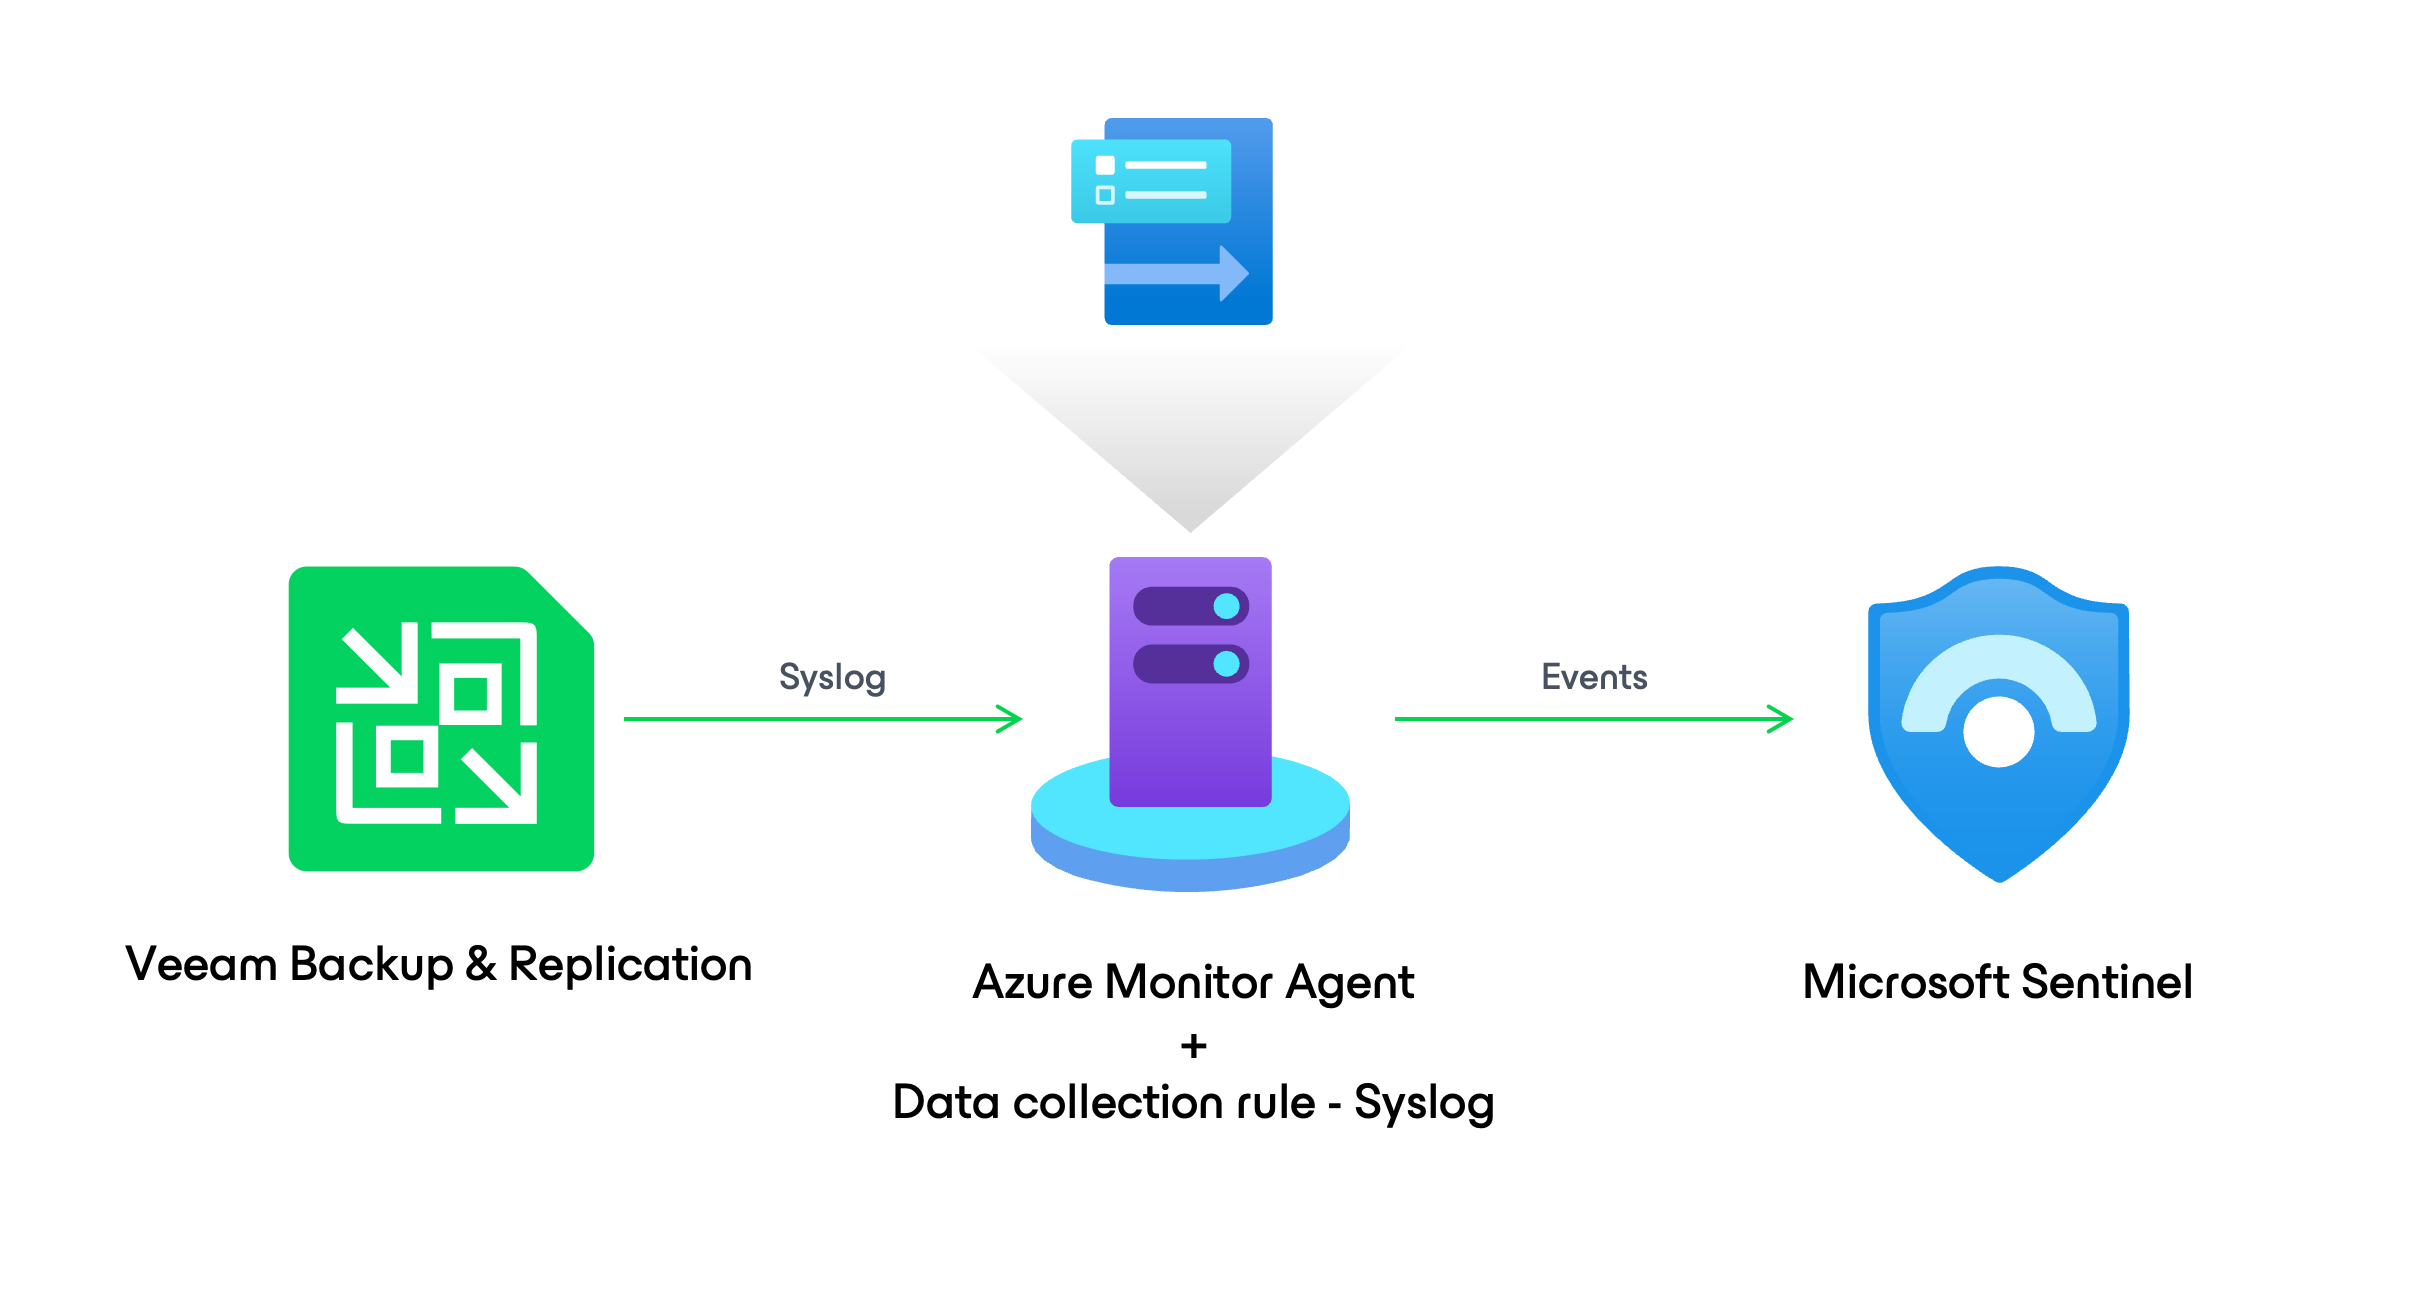
- Using Azure Arc and the Azure Monitor Agent on an Ubuntu server, VBR running on-premises sends events to Sentinel via syslog.
- Sentinel is configured to scan the incoming Veeam logs for security events, such as a malware detection.
- Finally, triggers are enabled to create an incident in Sentinel when a security event is detected to raise the alarm and initiate a response by the security team.
Note: Microsoft Sentinel is a paid service, but there is a trial period that provides 10 GB per day for 1 month. More details on the trial and pricing are available on the Microsoft Sentinel pricing page.
Laying the groundwork
To get started, we need to do a few things in Azure to get the backend online for Sentinel. The Microsoft docs are located here, but in short:
- Log in to your Azure portal.
- Go to the Microsoft Sentinel service.
- Select Create, then Create a new workspace.
- Specify resource group for the Log Analytics workspace Sentinel will use, and specify name and region.
- Select Review + create, then Create.
- When the Log Analytics workspace finishes deployment, refresh the page and add Sentinel to the workspace. Both deployments are fairly quick but times could vary.
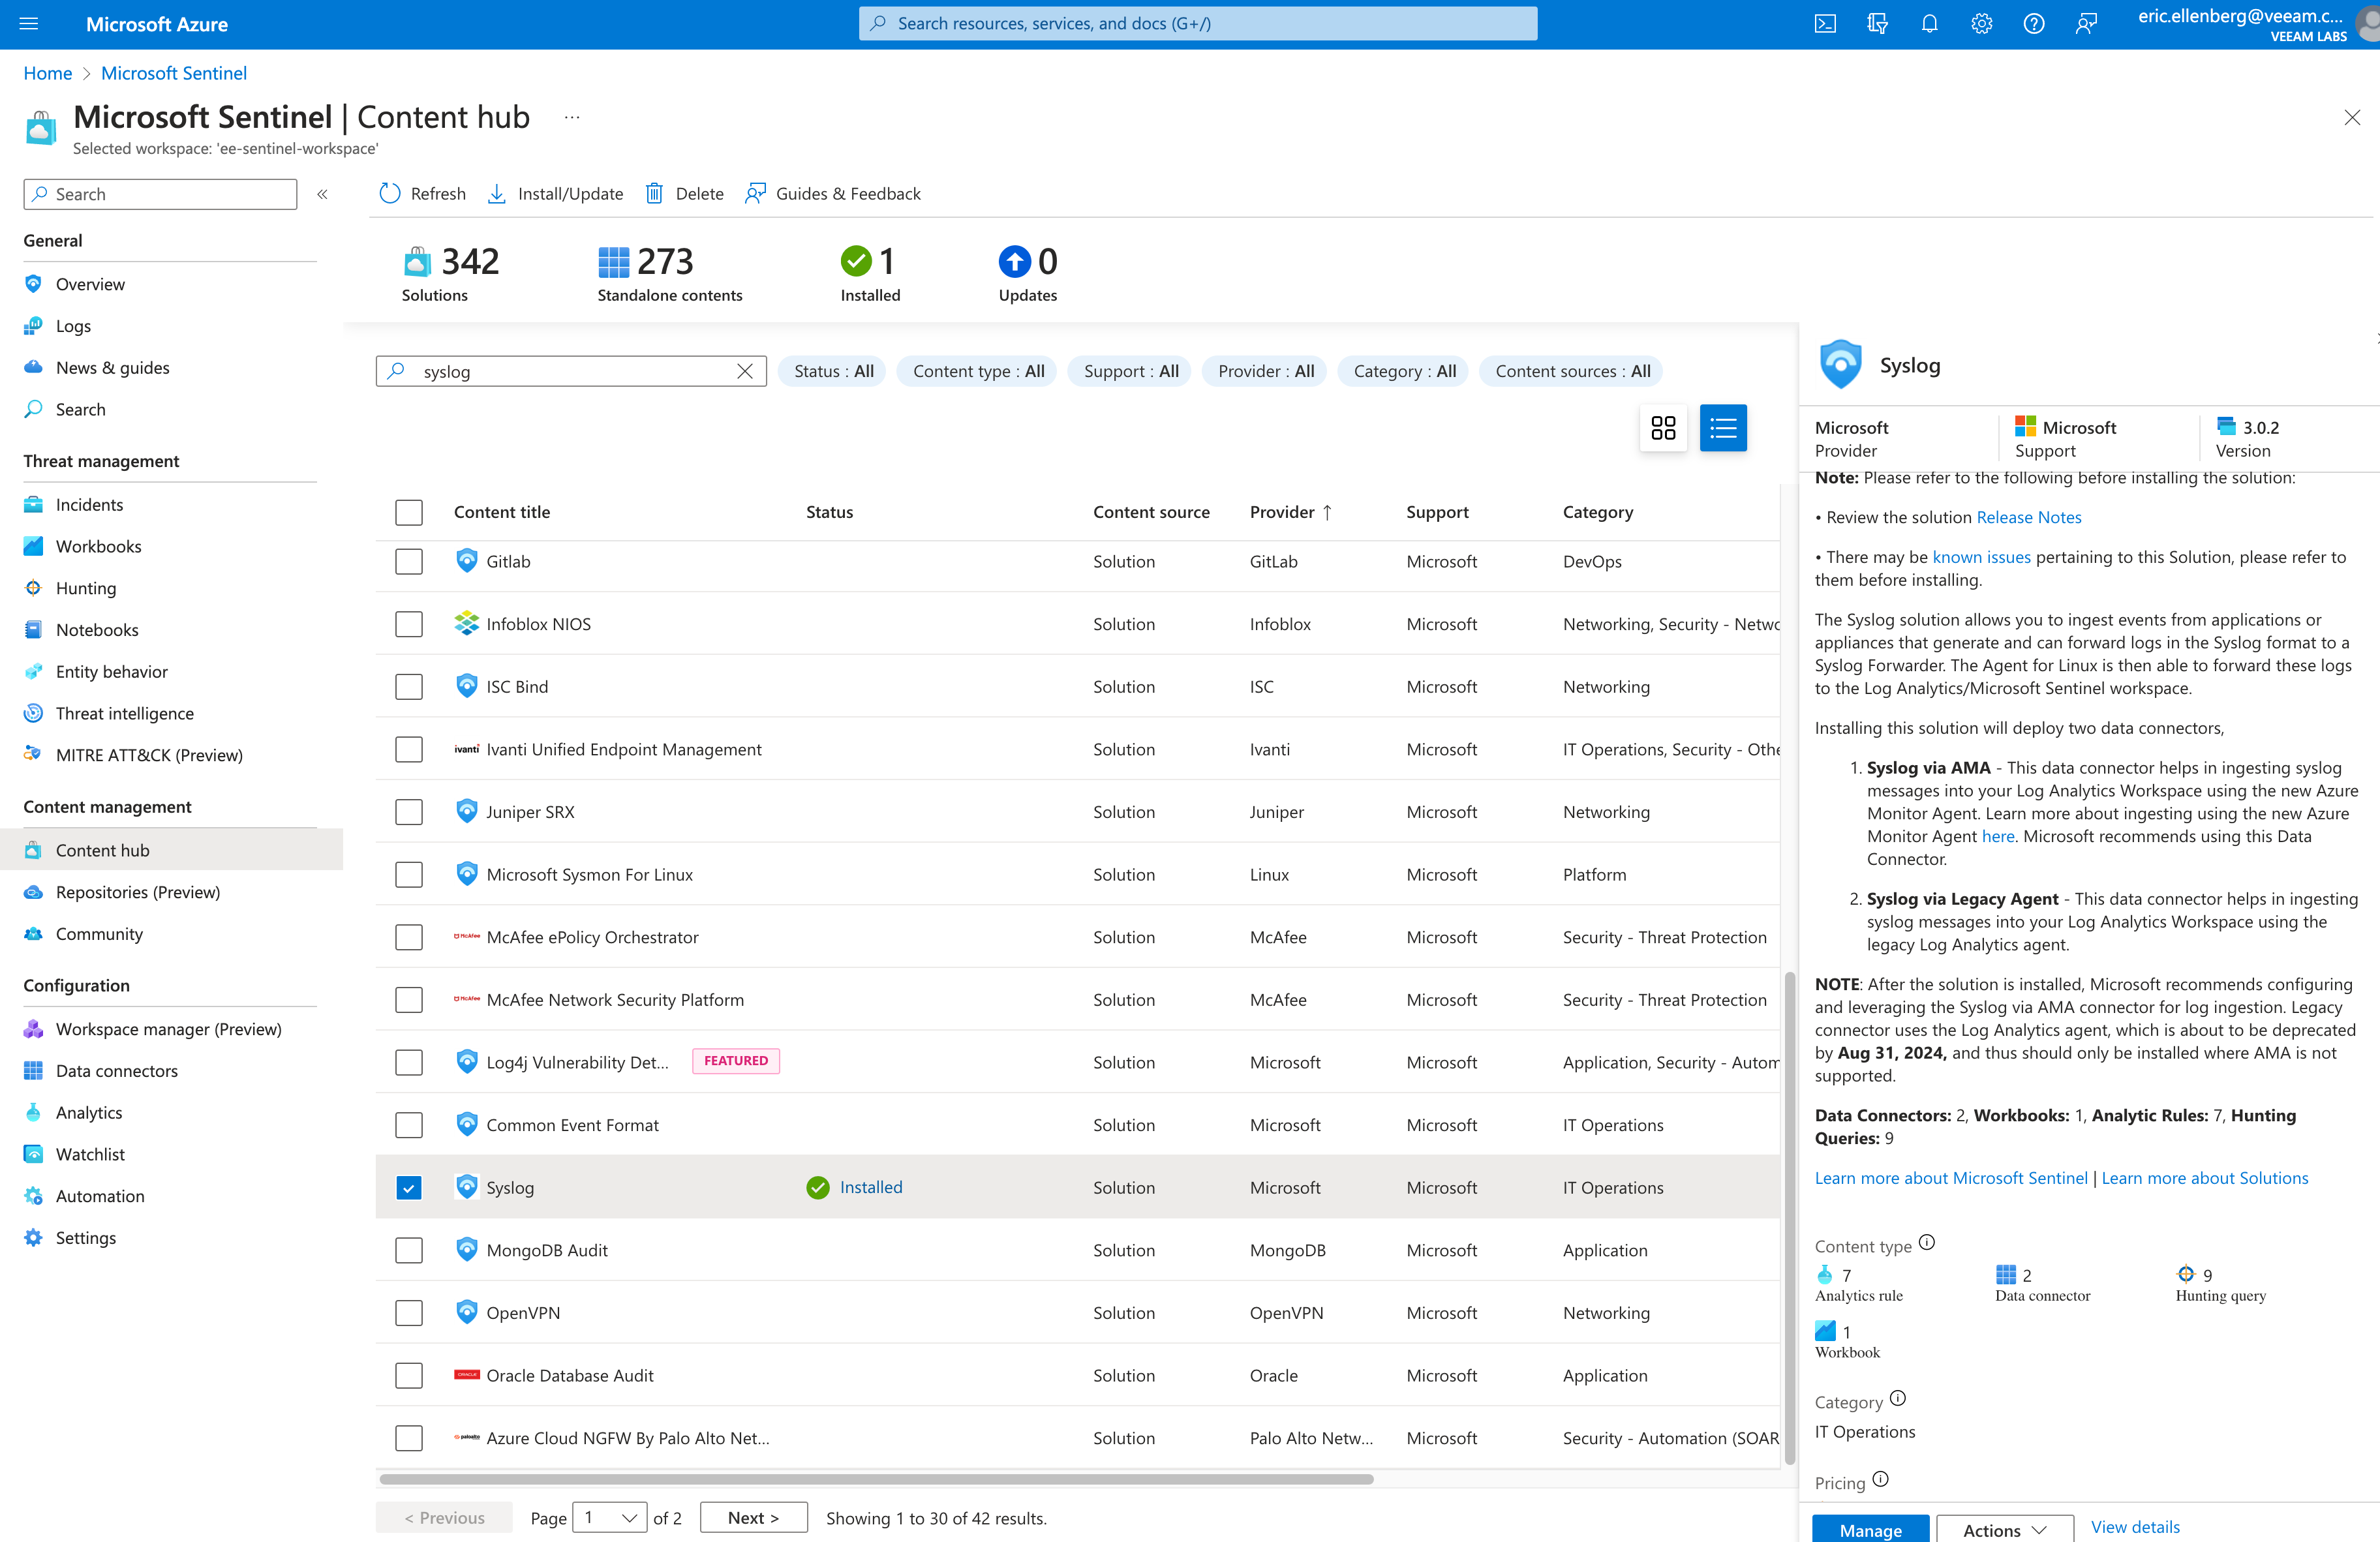
- Select your new Sentinel workspace and go to the Content hub, located in the left nav panel.
- Search for “syslog” and select the Syslog content title (provider name “Microsoft”), then select Install in the right panel.
You should be at a screen that looks like this.
Azure Arc agent setup
Now that your Sentinel-enabled Log Analytics workspace is online and has the Syslog content pack installed, the next thing you need to do is set up the Azure Arc agent on your syslog server. Azure Arc is used to deploy the Azure Monitor agent to the syslog server, which we’ll configure to collect the syslog data coming from VBR.
Follow the steps in this Microsoft quickstart guide to register your server with Azure Arc.
Quickstart: Connect hybrid machines with Azure Arc-enabled server
Tip: If you’re accessing the Ubuntu machine via SSH like me, I found it easier to copy the generated install script from the Azure Arc web page on my local system and paste it into the terminal rather than downloading the script and uploading via SFTP. Even if you’re not familiar with Linux, fear not, the steps are simple:
touch azure-arc-setup.sh && nano azure-arc-setup.shThis creates a file called azure-arc-setup.sh and then opens the file with the nano text editor.
Now paste the generated Azure Arc install script into nano; press Ctrl-O then Enter to save the file; Ctrl-X to exit nano; then run the script with:
bash ./azure-arc-setup.shIf you’re not already running as root you’ll be prompted for an admin password to install the packages. You’ll also need to login to your Azure account using the device login code process.
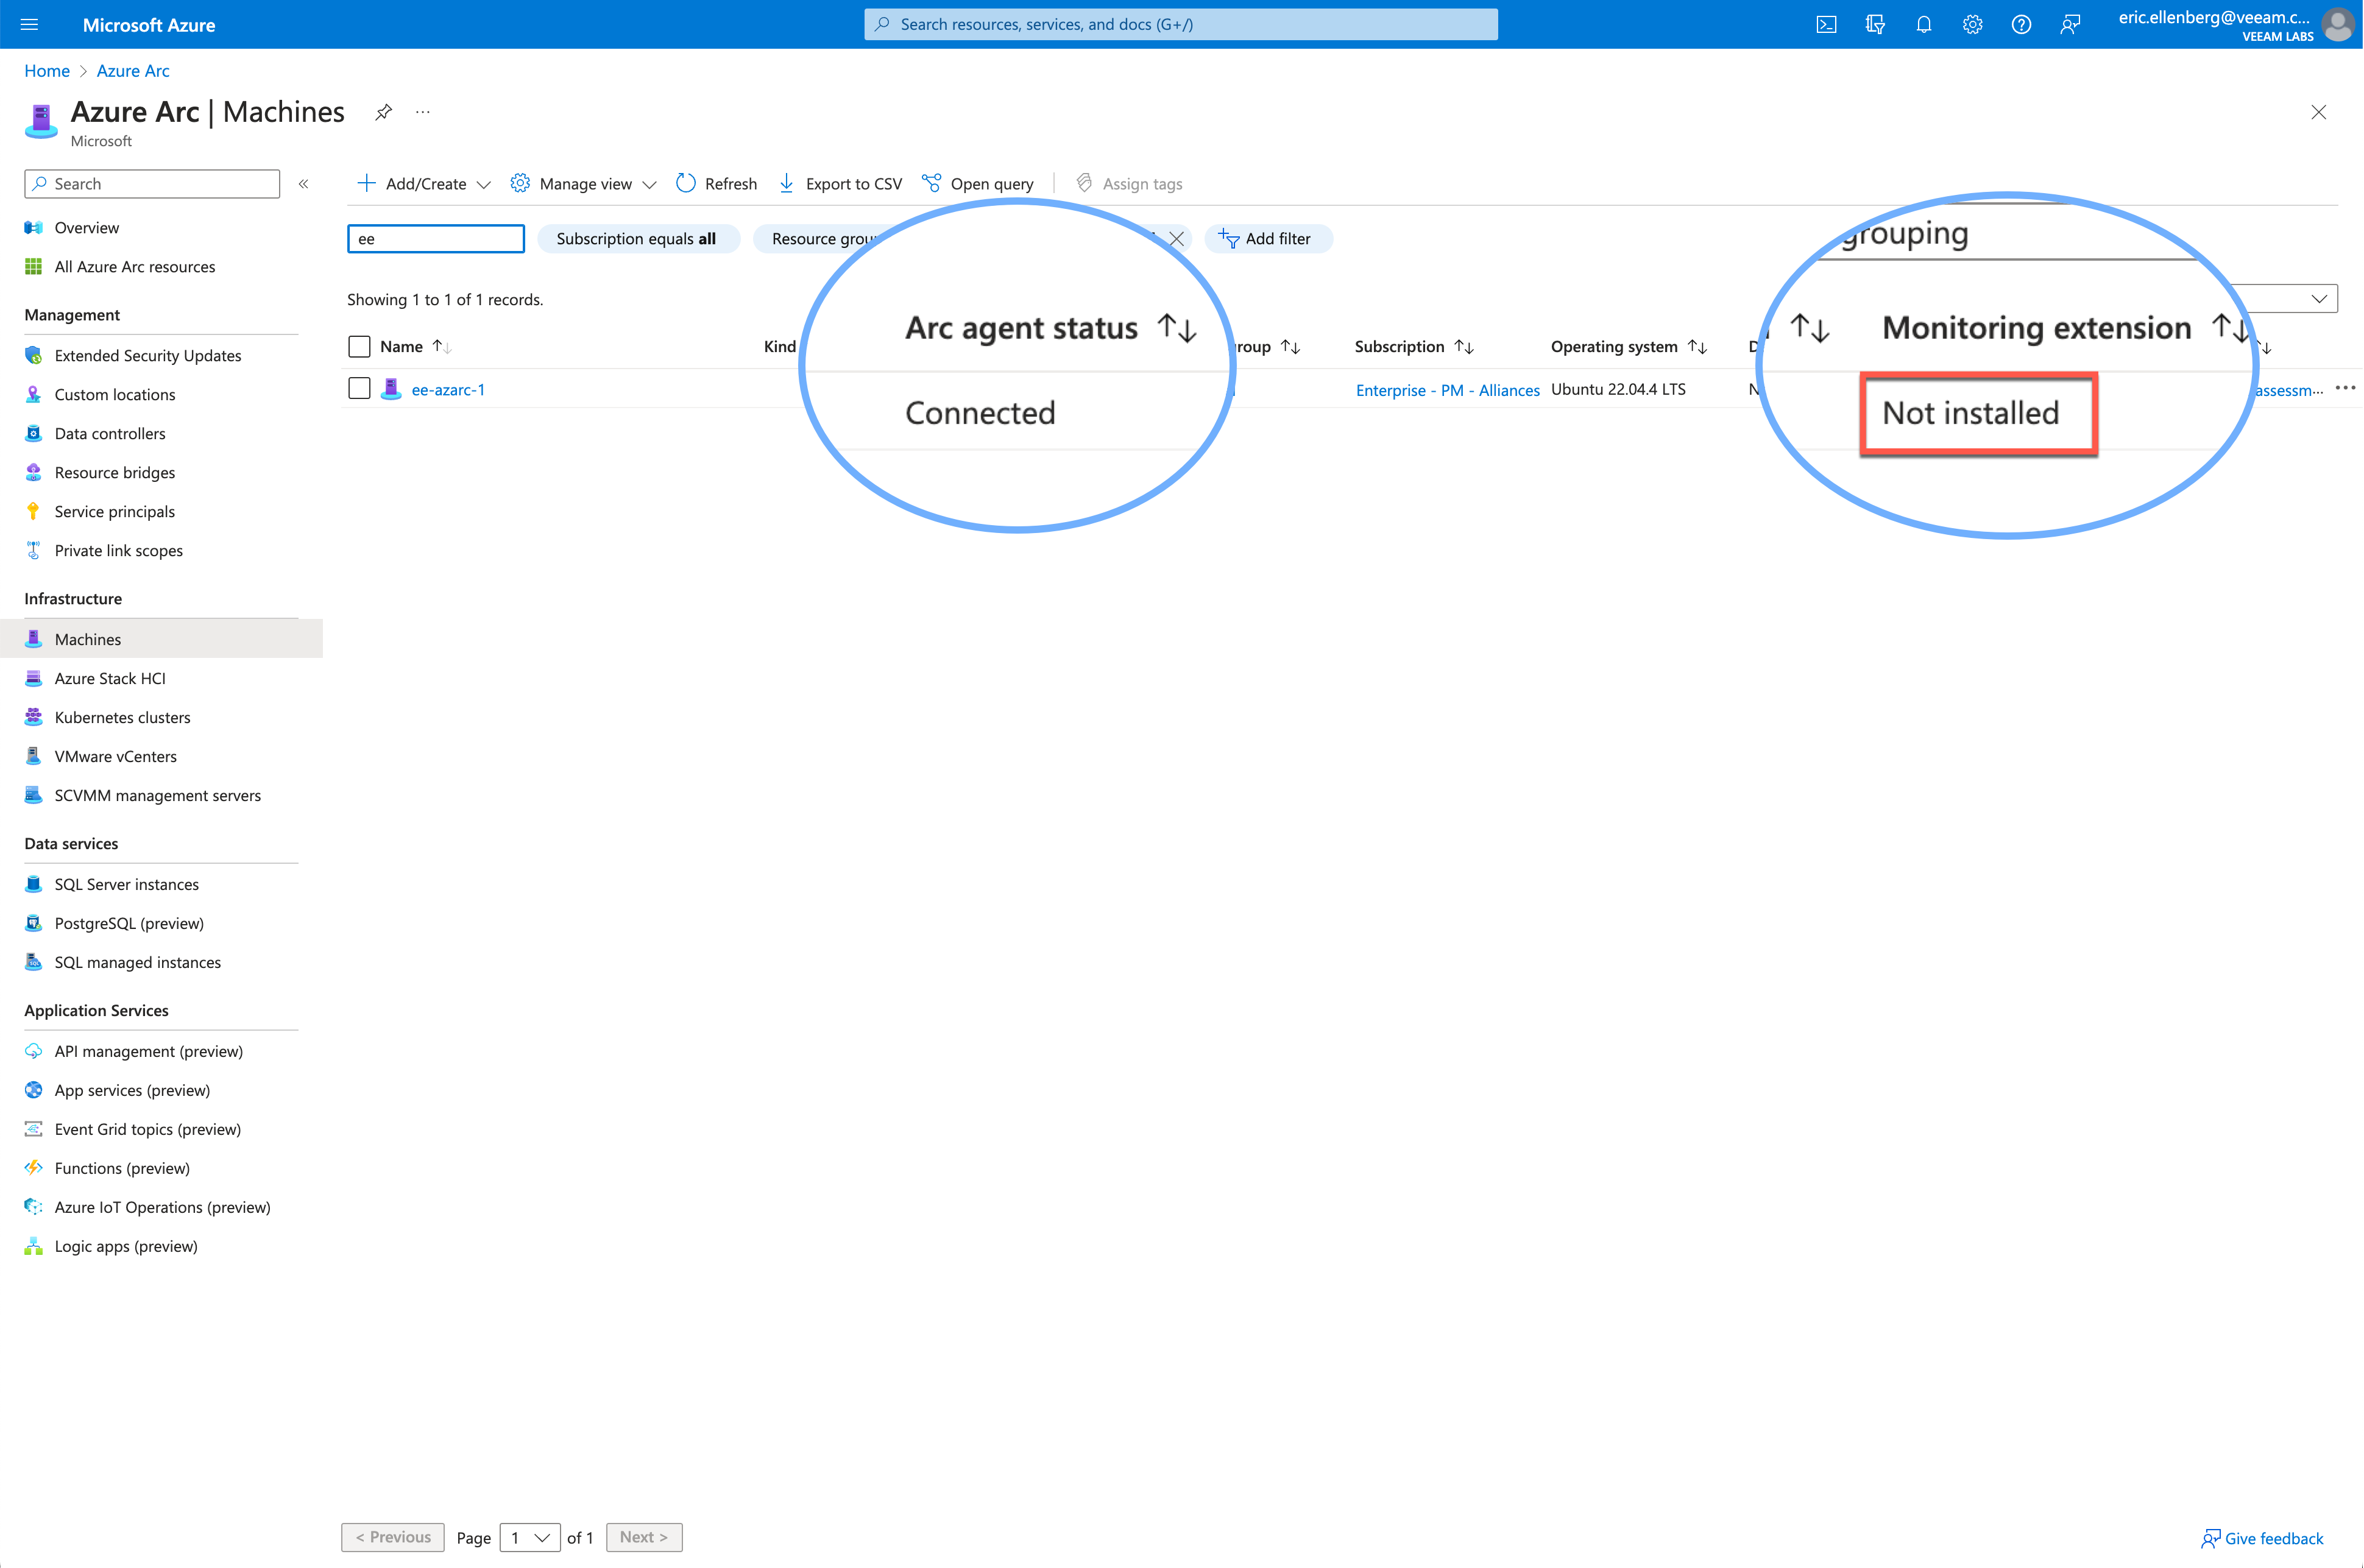
When you’re done, you’ll see your local system registered with Azure Arc.
Azure Monitor agent setup
You’ll notice in the screenshot above that while the system is properly registered and connected with Azure Arc, the monitoring extension is not installed. Let’s fix that.
- Open your Azure portal and go to Microsoft Sentinel, then Content Hub, then select the Syslog content pack you installed previously.
- On the right panel at the bottom, select Manage.
- Now select Syslog via AMA in the right panel to go to the Data connectors page.
- Select Syslog via AMA on the Data connectors page.
- In the right panel at the bottom, select Open connector page.
- Once again to the right panel, select the +Create data collection rule button.
- On the Basic tab, specify a rule name like “vbr-syslog-collection”, then select Next: Resources to go to the next tab.
- On the Resources tab, select your server that you registered with Azure Arc in the previous section, then select Next: Collect to proceed to the Collect tab.
- On the Collect tab, look for LOG_USER in the Facility column. In the dropdown menu next to this item, select LOG_DEBUG.
- This setting specifies the minimum log level that will be collected by the monitor agent for each selected facility. LOG_DEBUG equates to all log messages and suits the purpose of this exercise, but you could potentially tinker with this setting to reduce the log volume.
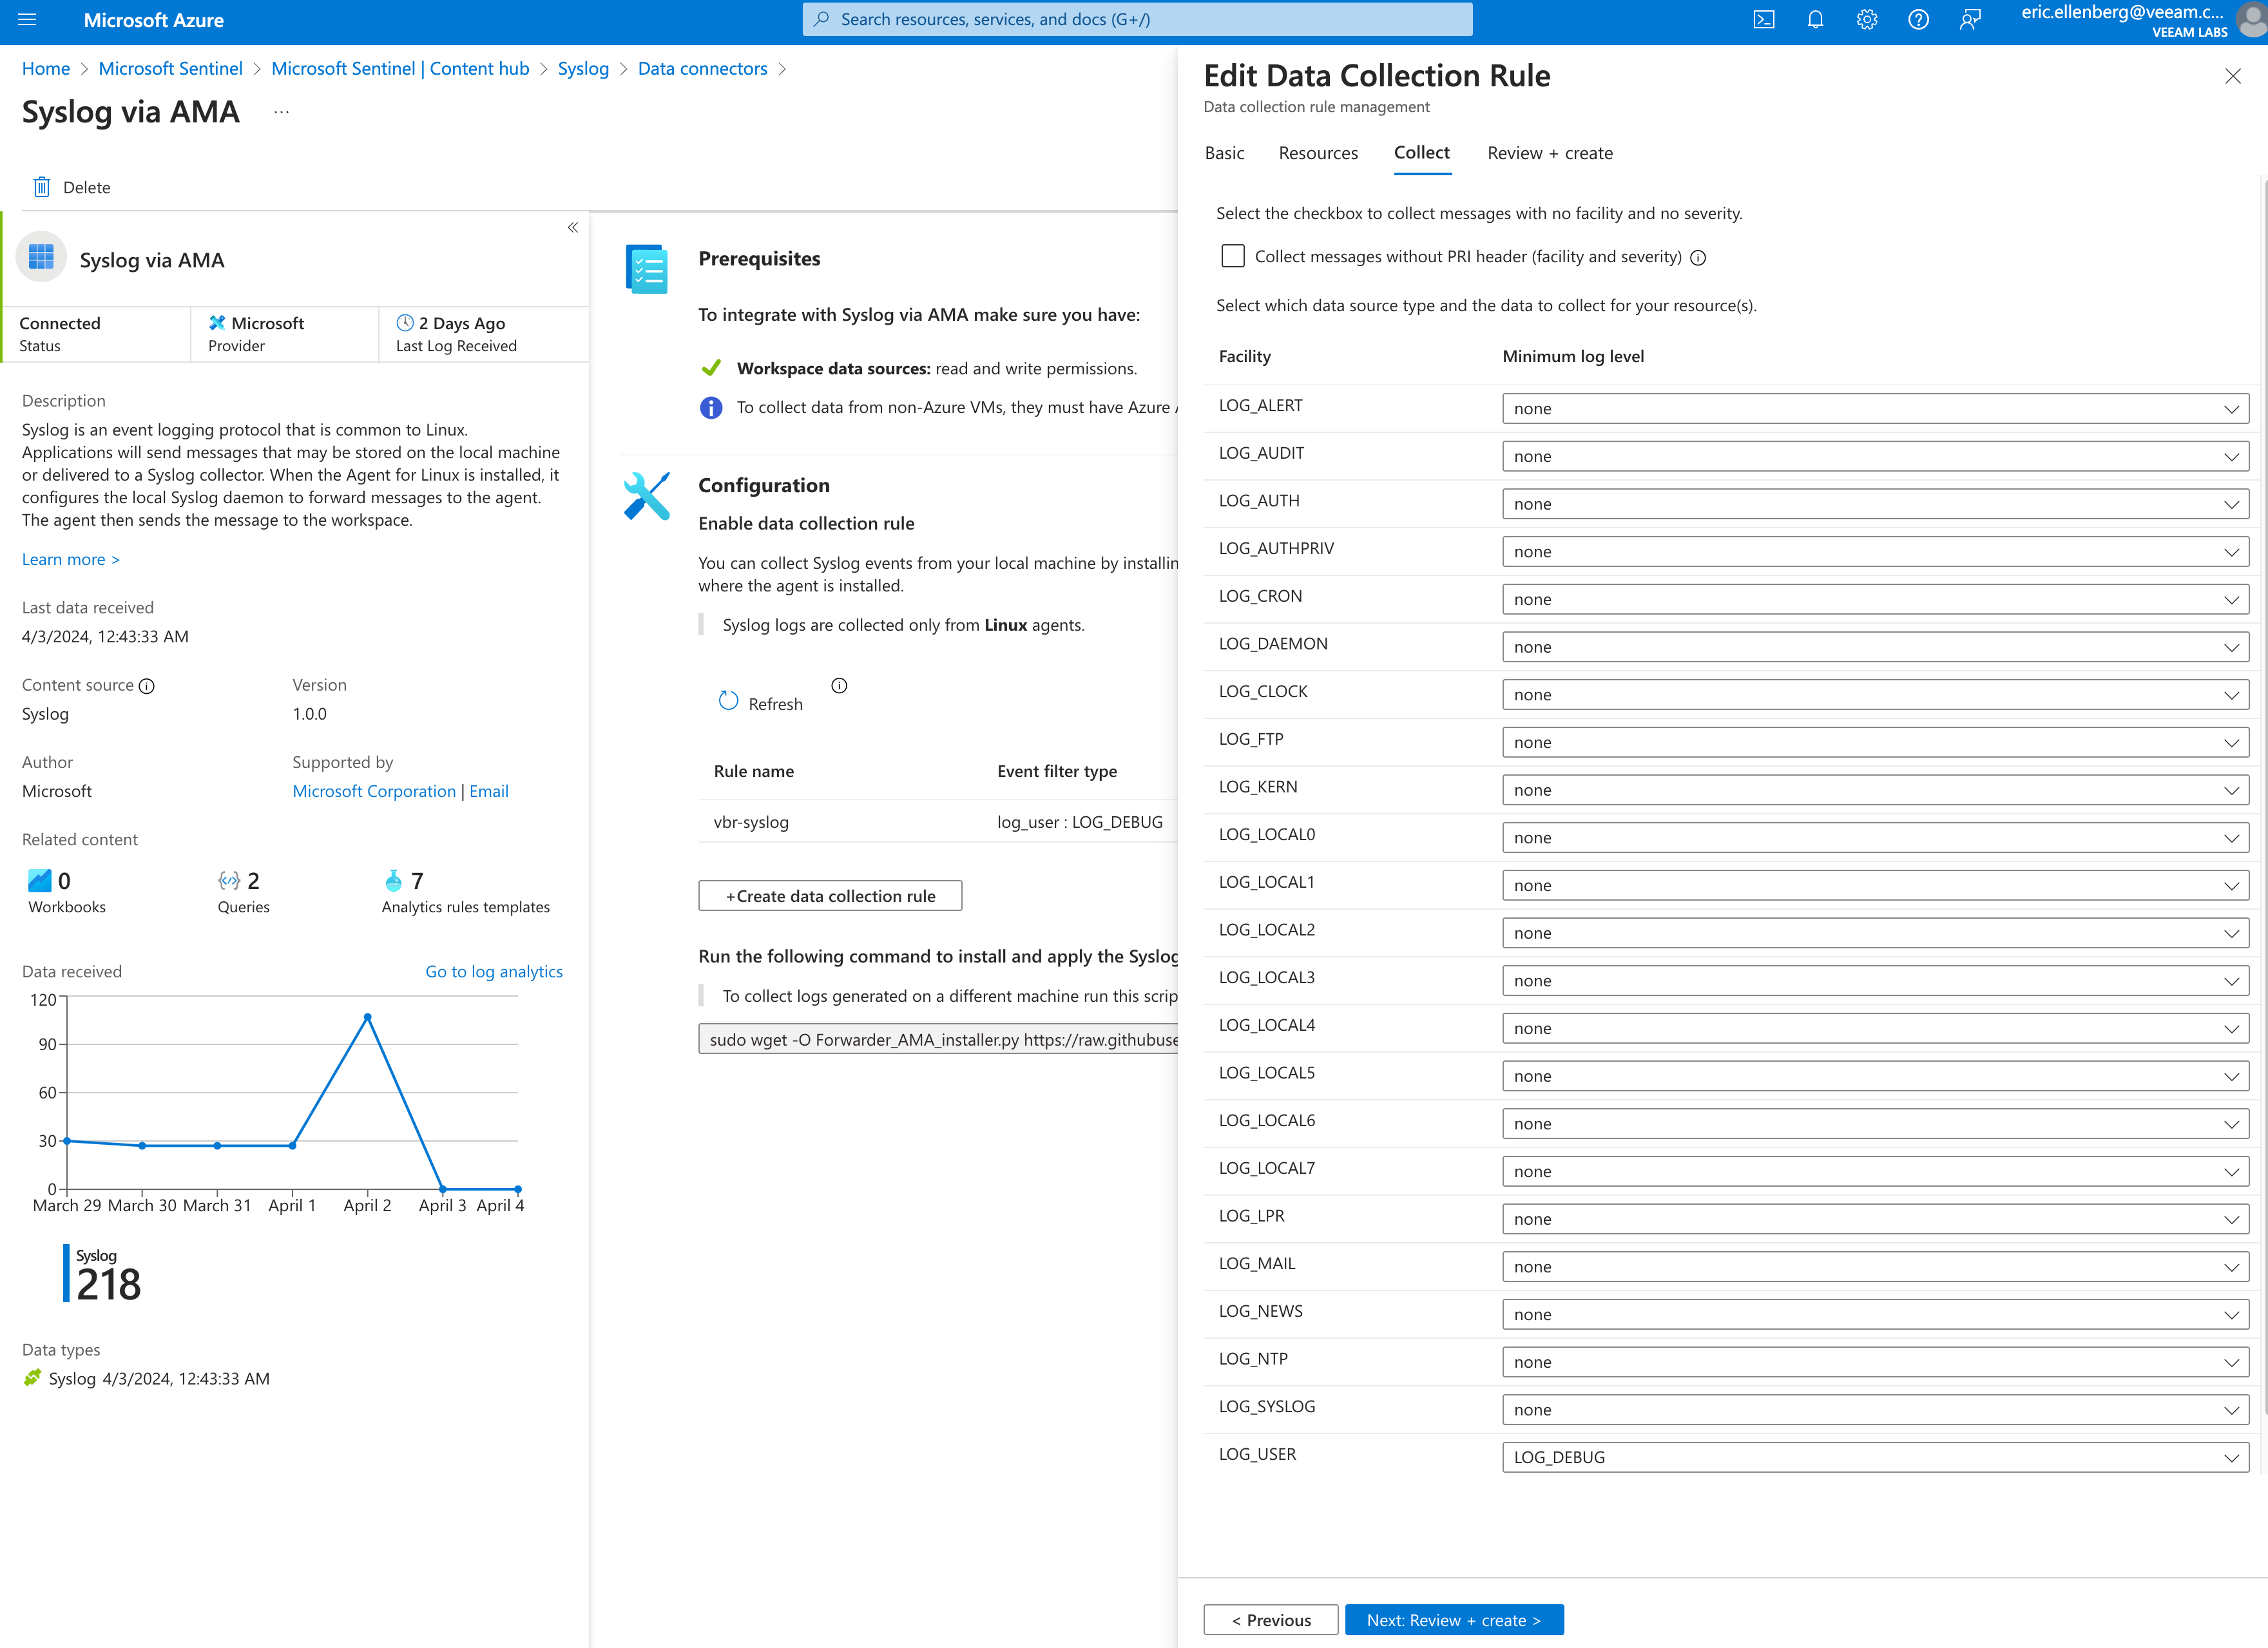
- This setting specifies the minimum log level that will be collected by the monitor agent for each selected facility. LOG_DEBUG equates to all log messages and suits the purpose of this exercise, but you could potentially tinker with this setting to reduce the log volume.
- Select Review + create, then select Create.
This process will push the Azure Monitor Agent to the syslog server via Azure Arc and apply the data collection rule that was just created that defines what log data will be collected.
Note: This process can take up to 20 minutes to complete. Now’s a good time for a coffee.
Enable syslog listening on the server
There’s one more step we need to take to finish configuring the syslog server: we need to enable it to listen for syslog messages on the network.
Good news: Microsoft provides a python script that does this for us, and it’s actually in the very same place as our data collector rule we just finished creating.
On the Data connector page for Syslog via AMA, copy the following command:
sudo wget -O Forwarder_AMA_installer.py https://raw.githubusercontent.com/Azure/Azure-Sentinel/master/DataConnectors/Syslog/Forwarder_AMA_installer.py && sudo python3 Forwarder_AMA_installer.pyI did make one small edit to the command for your benefit: instead of calling “python” as it does on the Microsoft page, I changed it to “python3” to allow the command to work on a standard Ubuntu 22.04 machine like mine.
Bingo! Now your Ubuntu server’s rsyslog service is listening for syslog messages on UDP/514 and TCP/514.
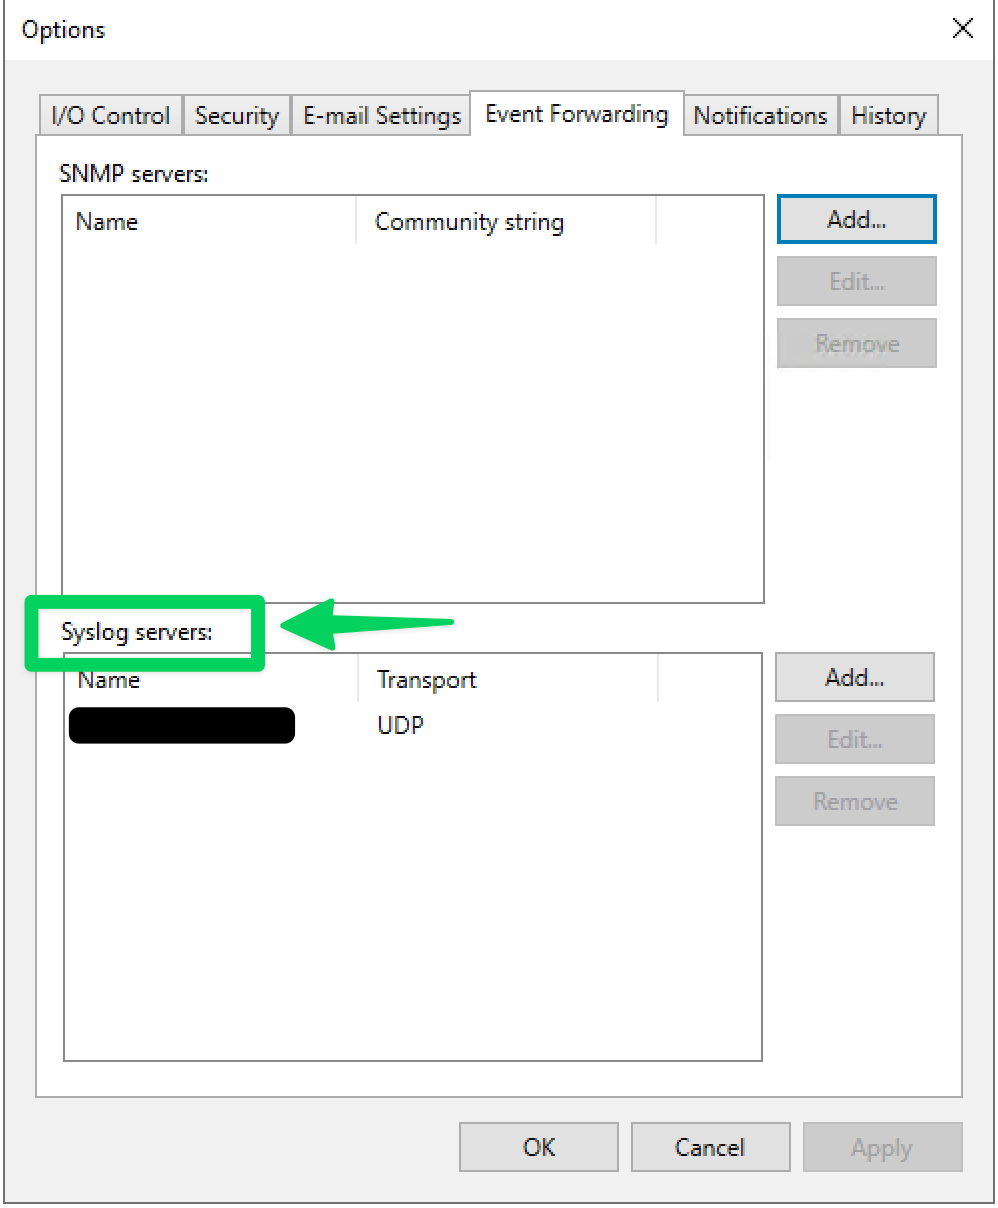
At last, let’s hop into the VBR console and set up the syslog settings to point to this syslog server.
VBR Syslog Settings
This process is documented in our user guide, linked below. Since the script from Microsoft enables syslog listening on UDP/514 and TCP/514, we can choose either one that best fits our needs in the VBR Event Forwarding options.
Coming in Part 2
In part 2 coming soon, I will show you how to set up the analytics and triggers in Sentinel to look for security events and signals coming from your Veeam server and create incidents automatically.
Update 4/3/24: Made correction to logging facility.
Update 9/25/24: Updated help center link to new Event Reference guide.


