

Veeam ONE provides visibility into data protection and virtual environments. Alarms, reports, and dashboards provide real-time monitoring, documentation, and at-a-glance views of your environment. Veeam ONE is known for its proactive alarms and detailed reports, but there are also valuable dashboards that can be used by every business. Dashboards visualize various aspects of your environment, including resource utilization, performance issues and top trends. Dashboards can be viewed in a web browser, delivered to your email, or even integrated into web portals.
There are pre-defined dashboards available immediately at your fingertips, but you can create your own dashboard views within Veeam ONE as well. The aim of this blog post is to walk-through the steps taken to create customized dashboard views.
Getting started
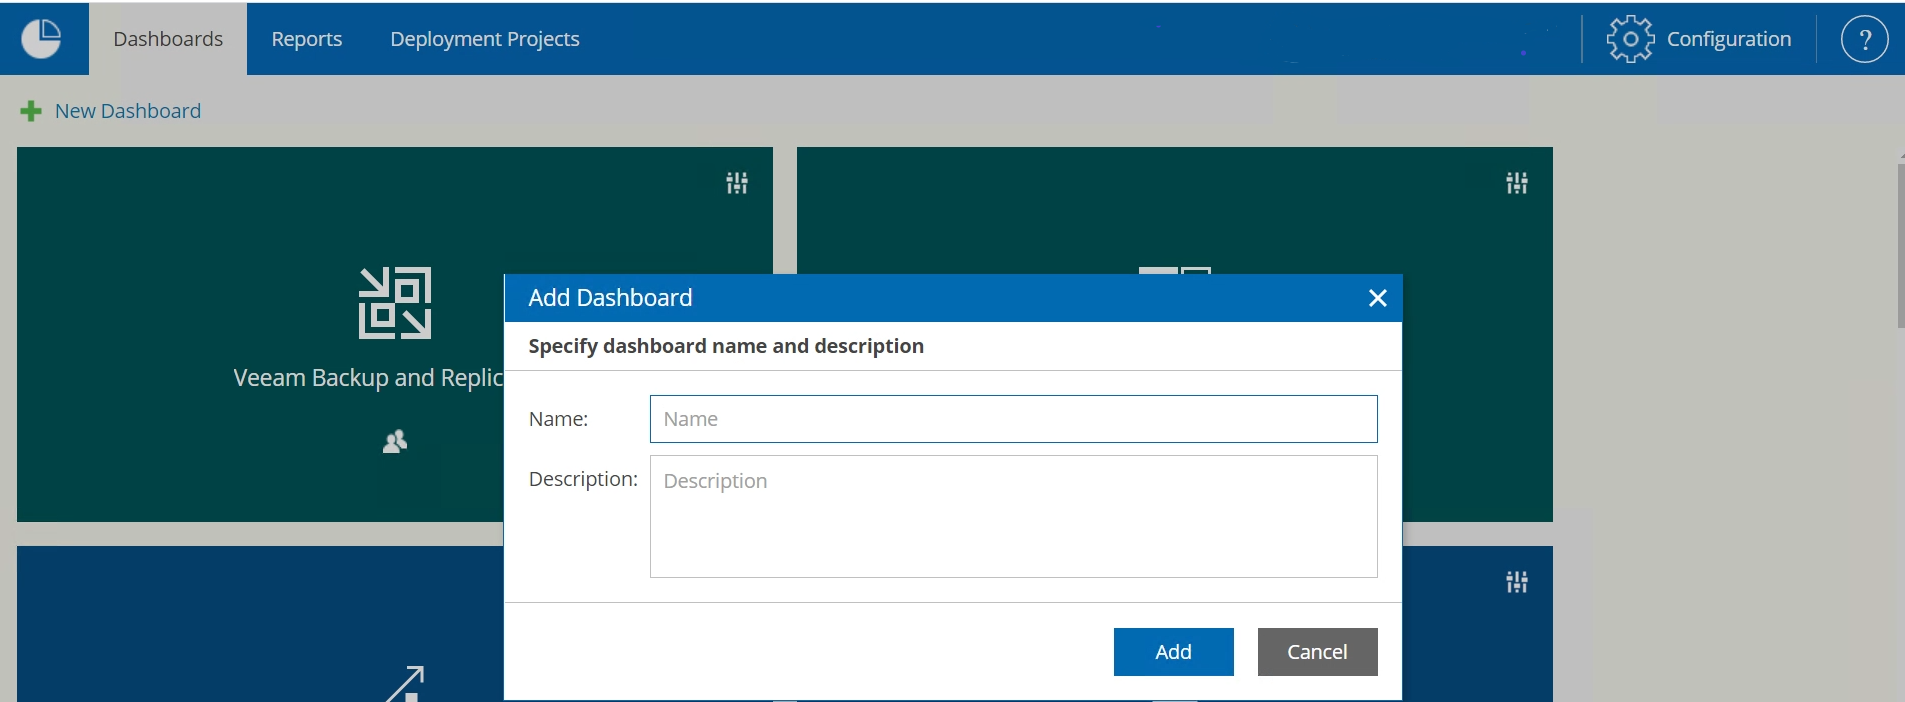
The first step is to decide what you want to see in your environment. Do you want to get granular and only see updates on certain machines? Or maybe only certain backup servers? Or maybe you want to just monitor your DR sites and resources? This can all be accomplished when creating your own dashboard view.
A major component of creating dashboards is the concept of widgets. Widgets are the visual components that show various parts of the managed environment. Widgets show your environment in the form of charts, graphs, and tables.
Selecting widgets
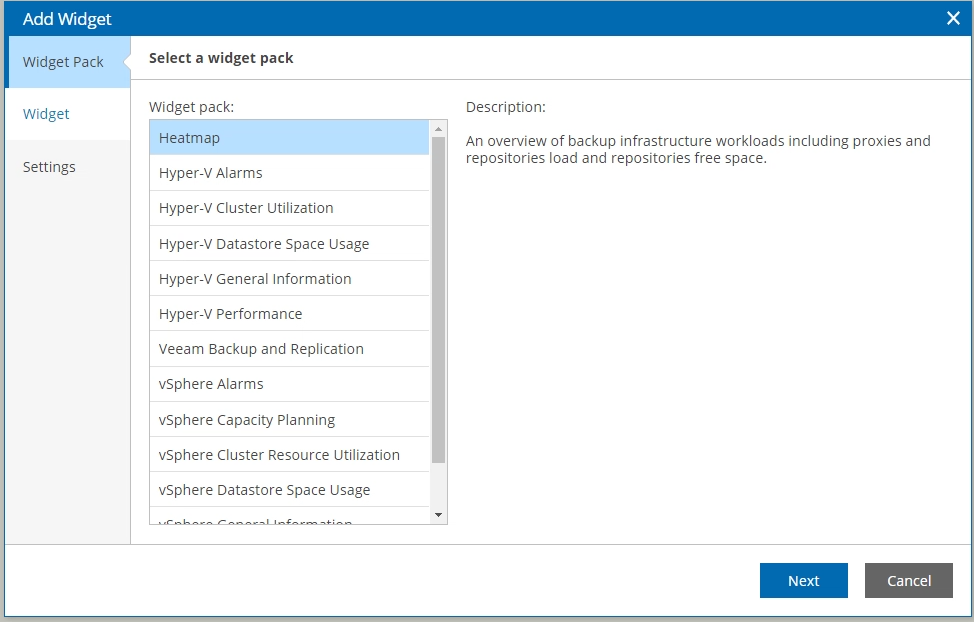
When designing your own dashboard view, it’s important to consider what critical components in your environment you want to track. If we want to keep an eye on a specific group of machines, for example, a group of application servers, we may want to include the last time they were backed up, the alarms occurring on those machines and their resource usage.
Choosing scope
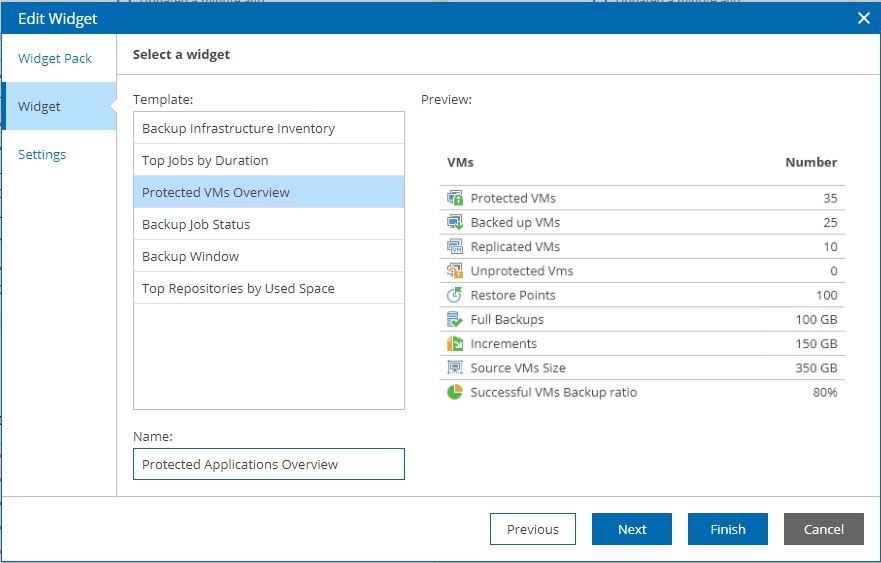
I have opened the Veeam Backup & Replication widget pack and selected Protected VMs. The next step of the wizard is where it gets interesting, because I can scope this dashboard to only show me the VMs’ protection status of the specific group of servers I want to monitor.
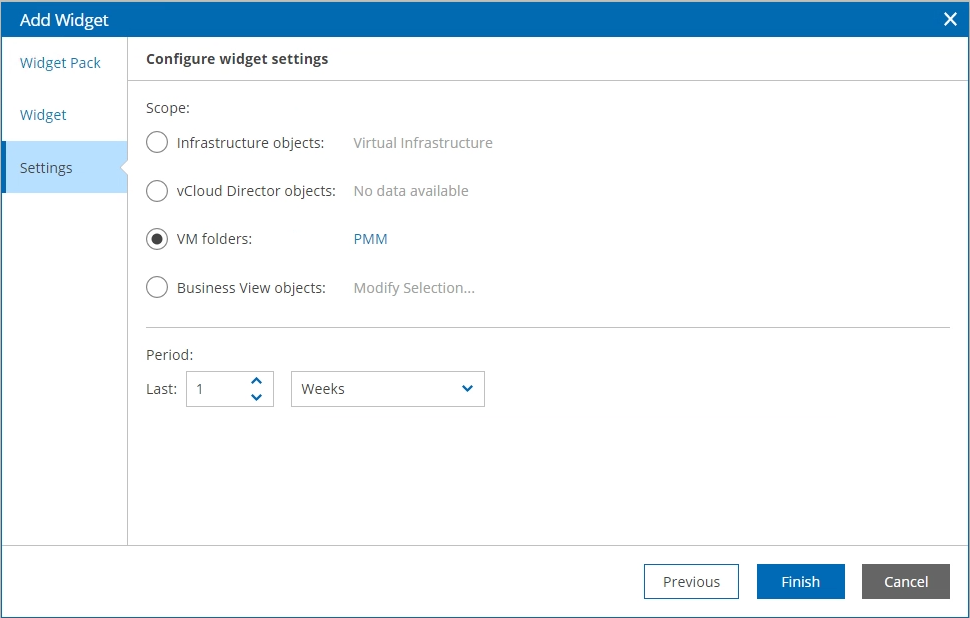
Depending on the selected widget, you’ll have different scope options you can specify. For the widget shown above, the different scope options available include infrastructure object, vCloud Director object, VM folders, or even utilize the categories created in Business View.
There are many different views you can create combining the different widgets. Specifying the scope based on the options available, you can get particular on the groups of machines, clusters, or hosts you want to monitor. Here is an example of one of the dashboards I put together.
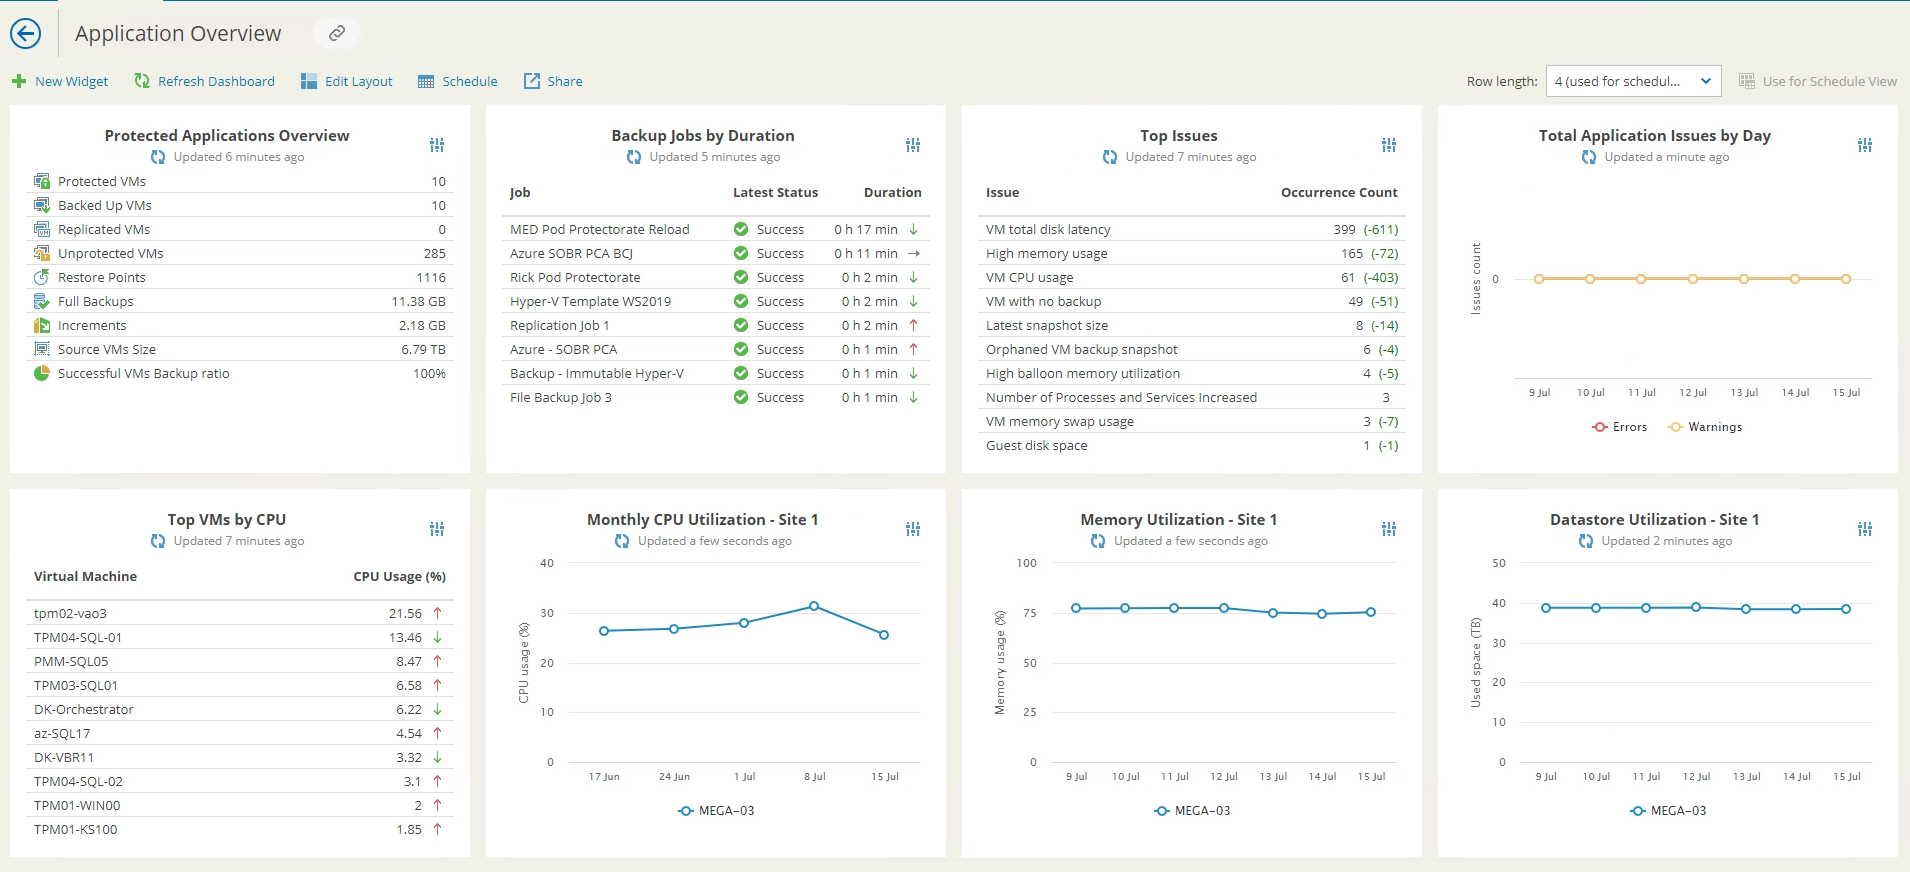
This dashboard allows me to monitor the protection status of a specific group of servers, how long the backup jobs are taking to complete, plus the top infrastructure issues related to this group of servers. I can also monitor the resource usage of the site those servers reside in. This view allows me to visualize my environment based on the requirements I need.
Dashboard delivery
After you successfully created your dashboard view, you want to schedule the delivery of your dashboard. This means you can automatically receive the dashboard periodically, daily, or monthly.
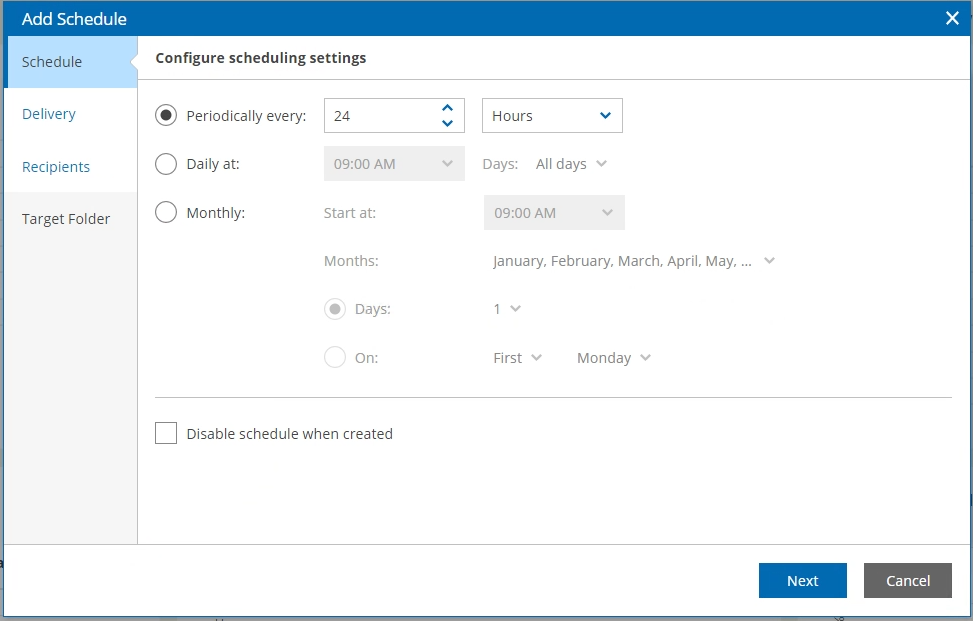
I have set it up to be delivered to my inbox every 24 hours, providing me with an at-a-glance view of how my environment is doing. This isn’t the only way you can share dashboards; you can also provide access through a direct link.
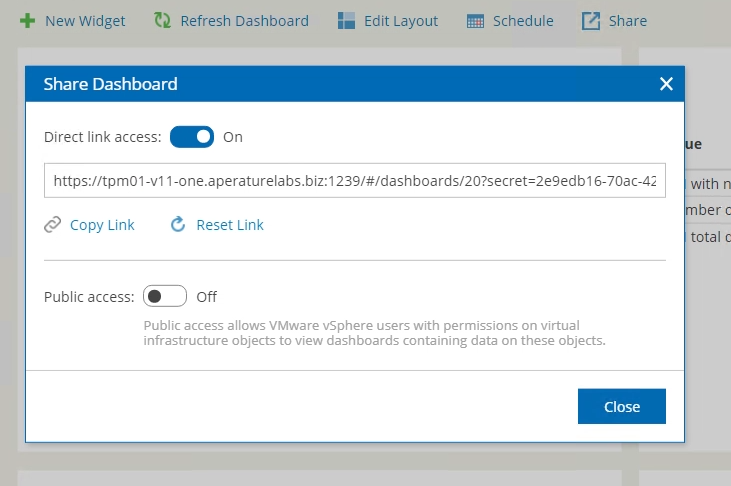
This allows you to share the dashboard with key stakeholders within the business.
Creating dashboard views is easy!
Veeam ONE has the flexibility to build personalized views through scoping widgets based on different object types. This provides an easy way to visualize aspects of your data protection and virtual environment that are needed based on importance or criticality. Combine this with the pre-defined dashboards already included and you are given the tools needed to ensure any view of critical objects can be shown to help track resources, top issues and data protection.


