Hello,
These last few weeks I have had the time to give some attention to the AsBuiltReport.Veeam.VB365 report. This time a lot of improvements and new sessions were added to collect much more information about the Veeam Backup for Microsoft 365 infrastructure.
Here I provide you with the changes:
https://github.com/AsBuiltReport/AsBuiltReport.Veeam.VB365/releases/tag/v0.3.0
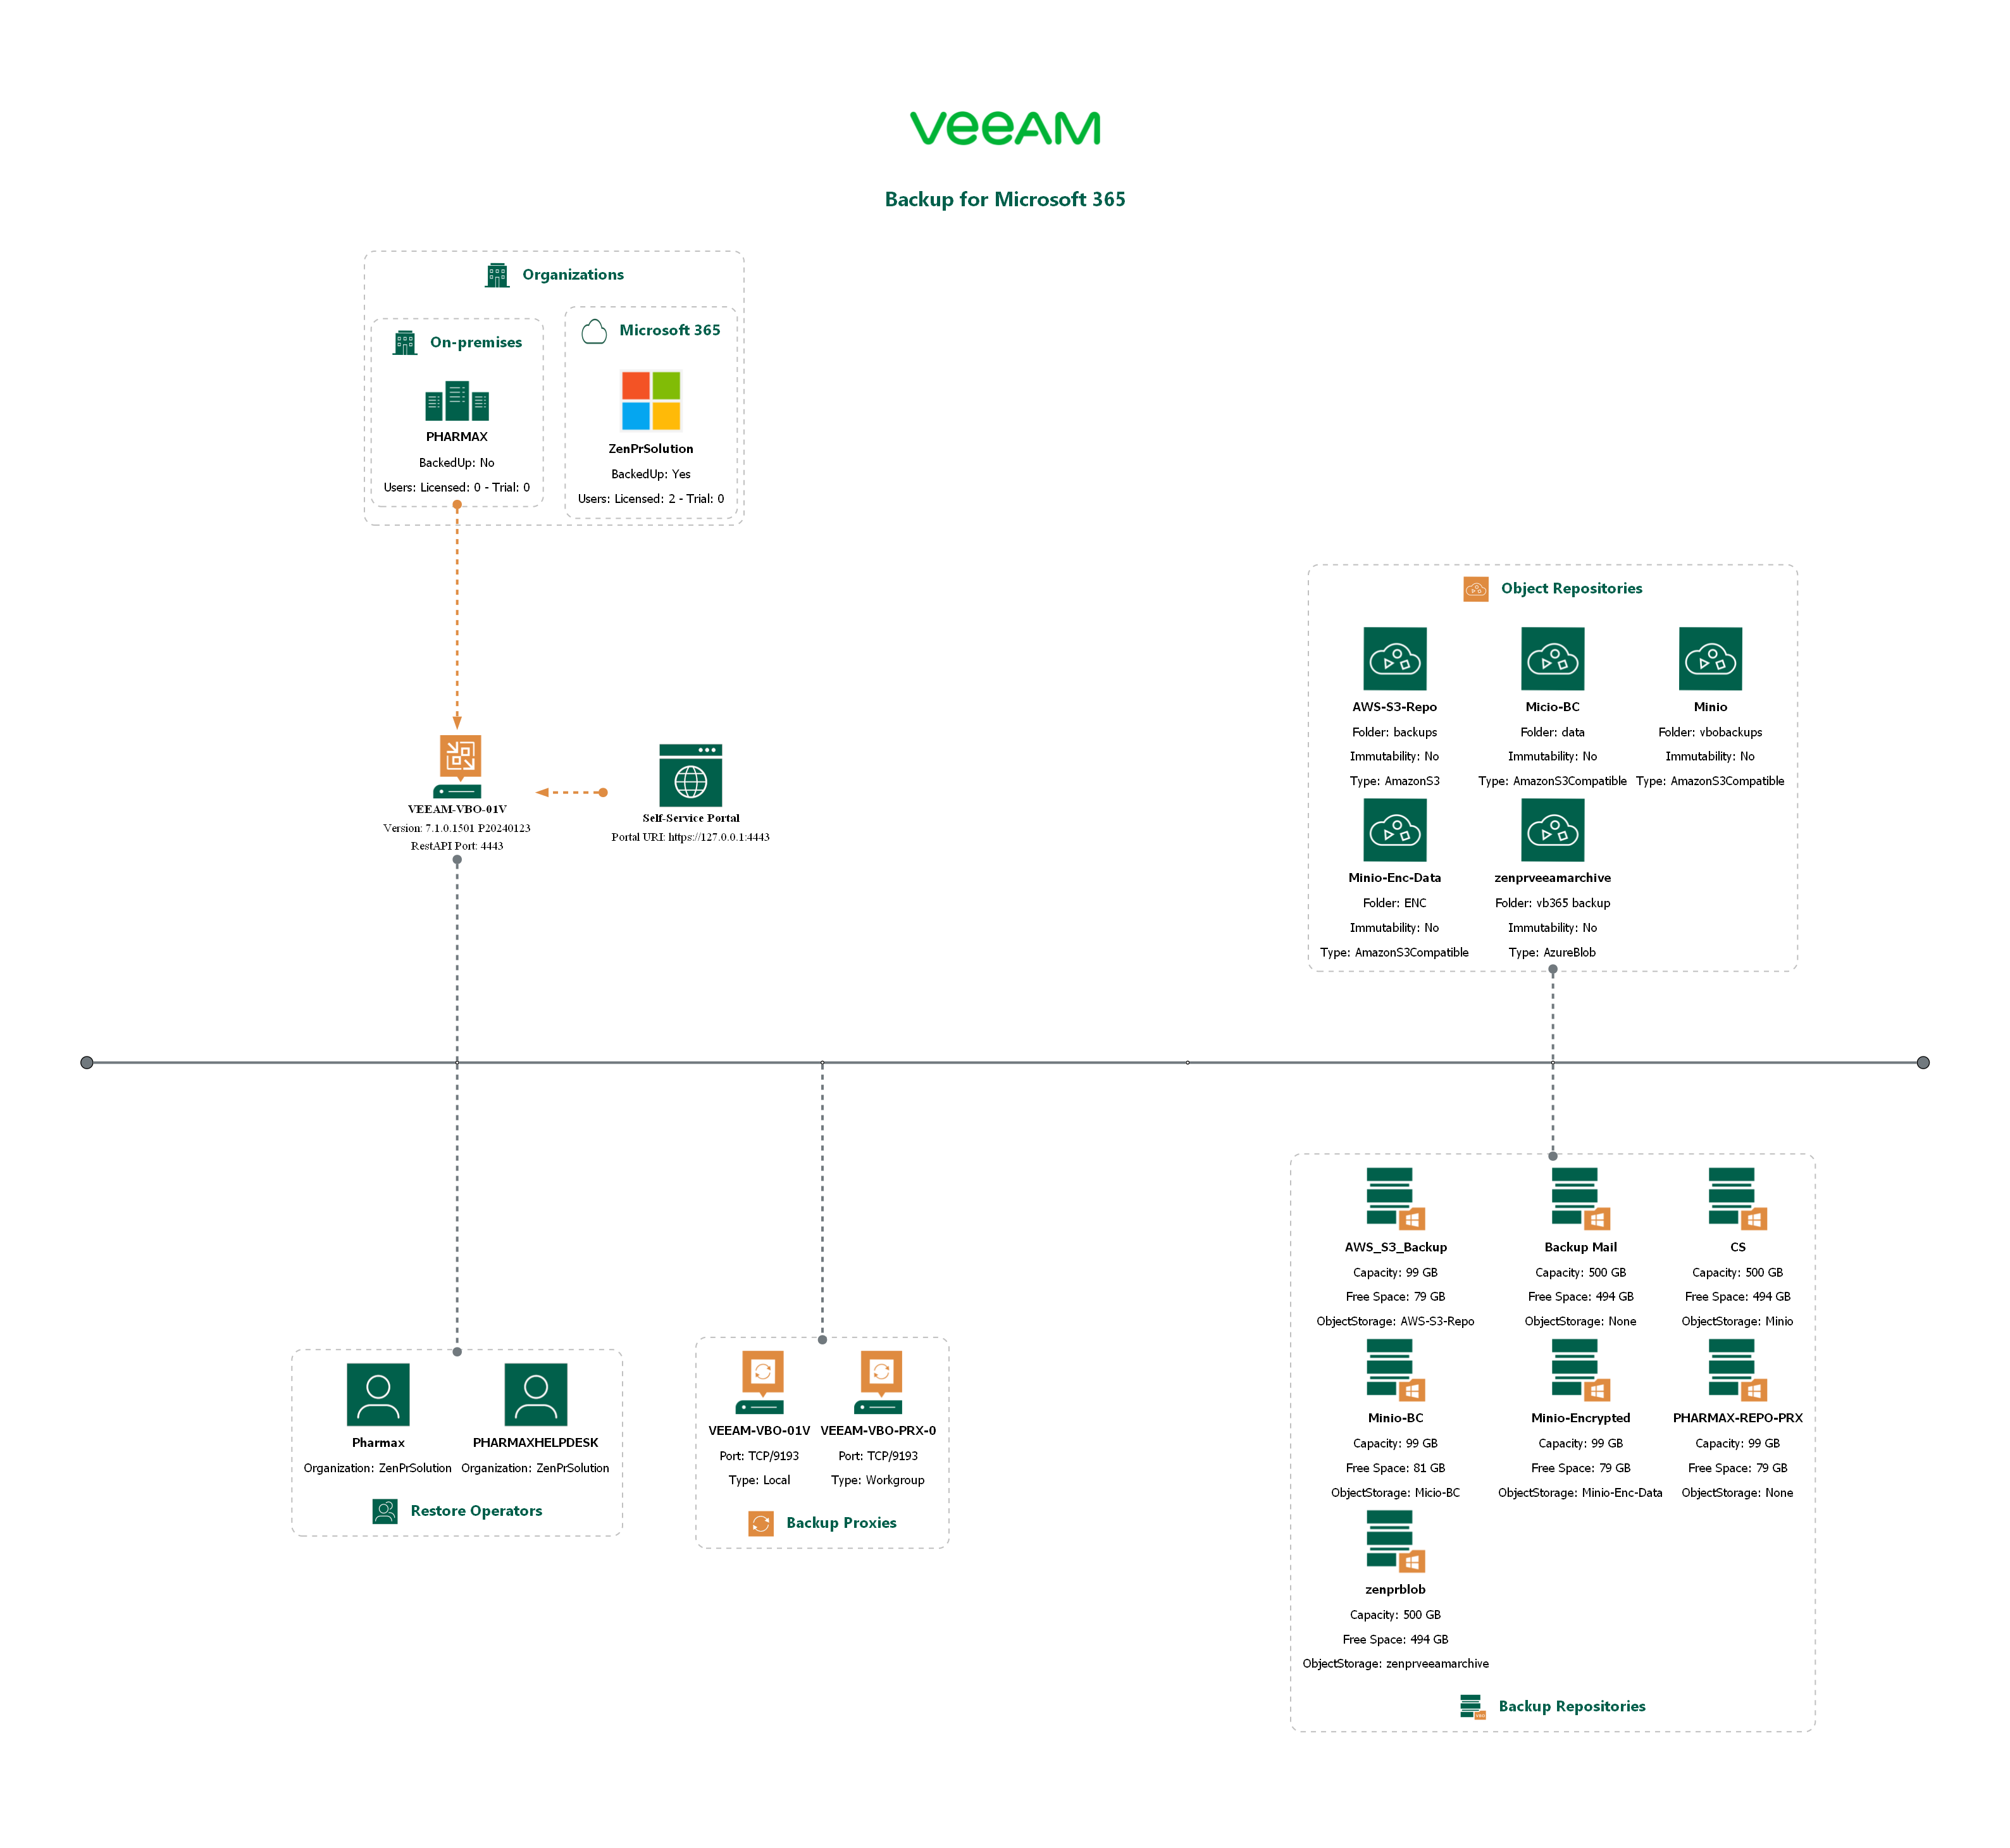
Now the reason for writing this post is to share with all of you about a project I have been working on in my spare time and it is about Diagramming the Veeam infrastructure. In this new version of the AsBuiltReport.Veeam.VB365 report I added the ability to create a simple diagram of the deployed VB365 components. This tool uses Graphviz and the PSGraph module to generate the diagram.
Here is the main link where you can see how to use the report:
https://github.com/AsBuiltReport/AsBuiltReport.Veeam.VB365
In this link you can find the code I use to generate the diagram!
If you are interested, you can help me by testing and reporting any bugs.
Hasta luego amigos!