

Hi Everyone,
In the ever changing landscape.. wait no that sounds like AI talk. What landscape have you ever seen in IT? Unless you are staring out the window at the grass during working hours.
In the ever stagnant data center environment monitoring your applications is of the upmost importance.
Not keeping watch on what is happening with your data protection setup is simply too risky. VeeamONE is an excellent solution that Veeam provides but if you have another solution already present or simply want to use another solution like Elasticsearch Fluentd and Kibana then this post might be for you.
EFK is not a simple solution and you can setup a whole monitoring practice sandbox by leveraging Podman. This is not meant to be in production only for practice.
First up create a ubuntu server VM and install podman:
sudo apt install podman -yNow run this script to have the environment setup automatically efksetup.sh
#!/bin/bash
# Create a shared network for the EFK stack
podman network create efk-network
# Create necessary directories
mkdir -p elasticsearch-data
mkdir -p fluentd/conf
# Create Fluentd configuration
cat << 'EOF' > fluentd/conf/fluent.conf
<source>
@type syslog
port 5140
bind 0.0.0.0
tag system
<parse>
@type syslog
message_format rfc5424
</parse>
</source>
<match system.**>
@type elasticsearch
host elasticsearch
port 9200
logstash_format true
logstash_prefix syslog
<buffer>
@type memory
flush_interval 5s
chunk_limit_size 2M
queue_limit_length 8
retry_max_interval 30
retry_forever false
</buffer>
</match>
EOF
# Start Elasticsearch
podman run -d \
--name elasticsearch \
--network efk-network \
-e "discovery.type=single-node" \
-e "ES_JAVA_OPTS=-Xms512m -Xmx512m" \
-e "xpack.security.enabled=false" \
-v ./elasticsearch-data:/usr/share/elasticsearch/data:Z \
-p 9200:9200 \
docker.elastic.co/elasticsearch/elasticsearch:8.12.0
# Wait for Elasticsearch to start
echo "Waiting for Elasticsearch to start..."
sleep 30
# Start Fluentd with elasticsearch plugin pre-installed
podman run -d \
--name fluentd \
--network efk-network \
-v ./fluentd/conf:/fluentd/etc:Z \
-p 5140:5140/udp \
-p 5140:5140/tcp \
docker.io/fluent/fluentd-kubernetes-daemonset:v1.16-debian-elasticsearch7-1
# Start Kibana
podman run -d \
--name kibana \
--network efk-network \
-e "ELASTICSEARCH_HOSTS=http://elasticsearch:9200" \
-p 5601:5601 \
docker.elastic.co/kibana/kibana:8.12.0
# Print container status
echo "Checking container status..."
podman ps
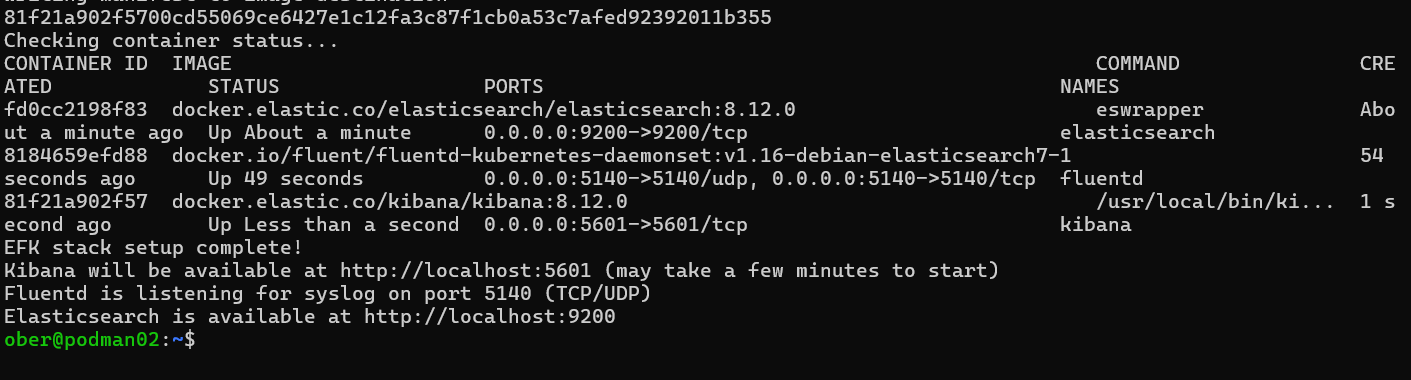
echo "EFK stack setup complete!"
echo "Kibana will be available at http://localhost:5601 (may take a few minutes to start)"
echo "Fluentd is listening for syslog on port 5140 (TCP/UDP)"
echo "Elasticsearch is available at http://localhost:9200"Next make the script executable:
chmod +x efksetup.shRun the script:
./efksetup.sh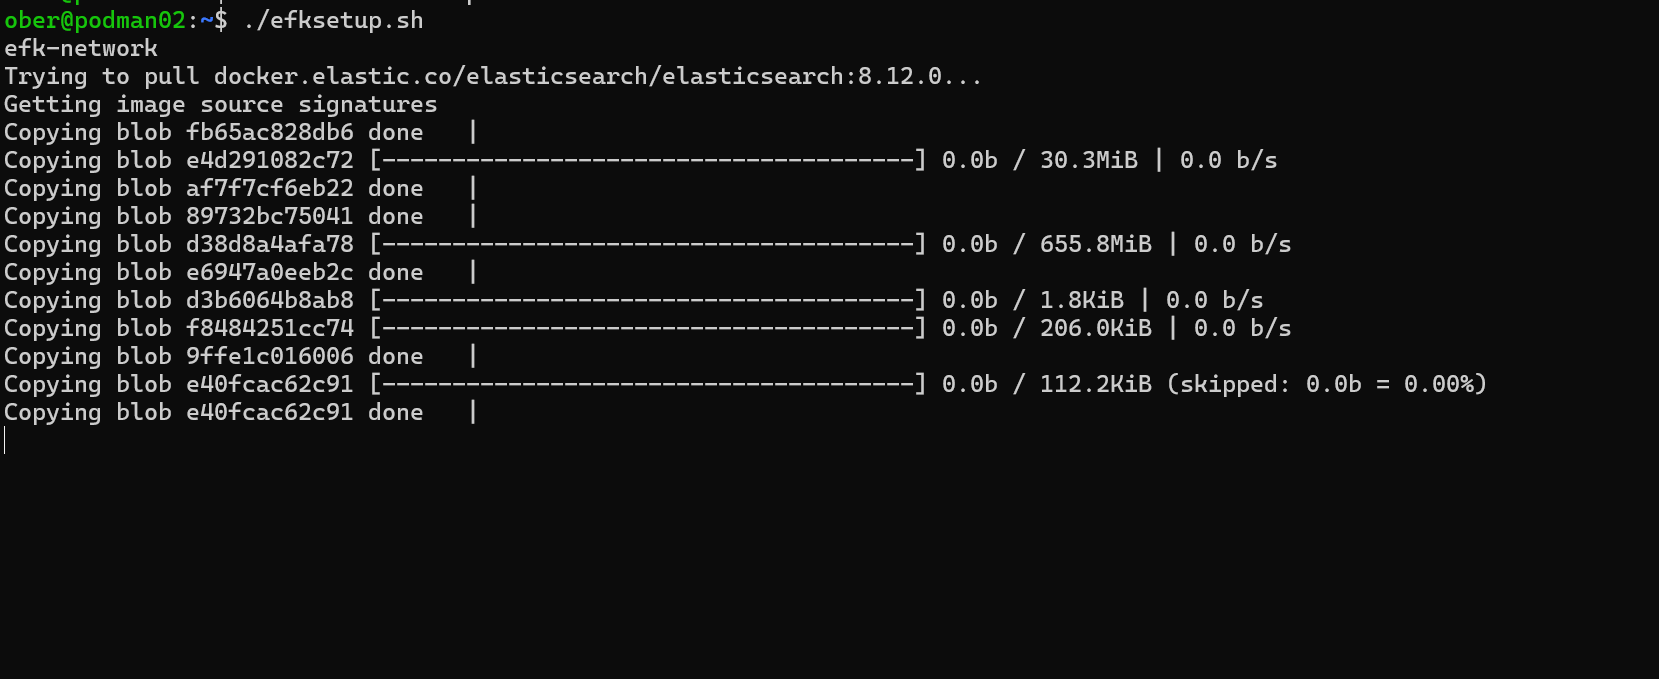
Once completed you should see something similar to this:
Next check the WebUI, the url for my VM is podman02 so we just need to add the Kibana port 5601 onto that and we should see the screen ready to go:
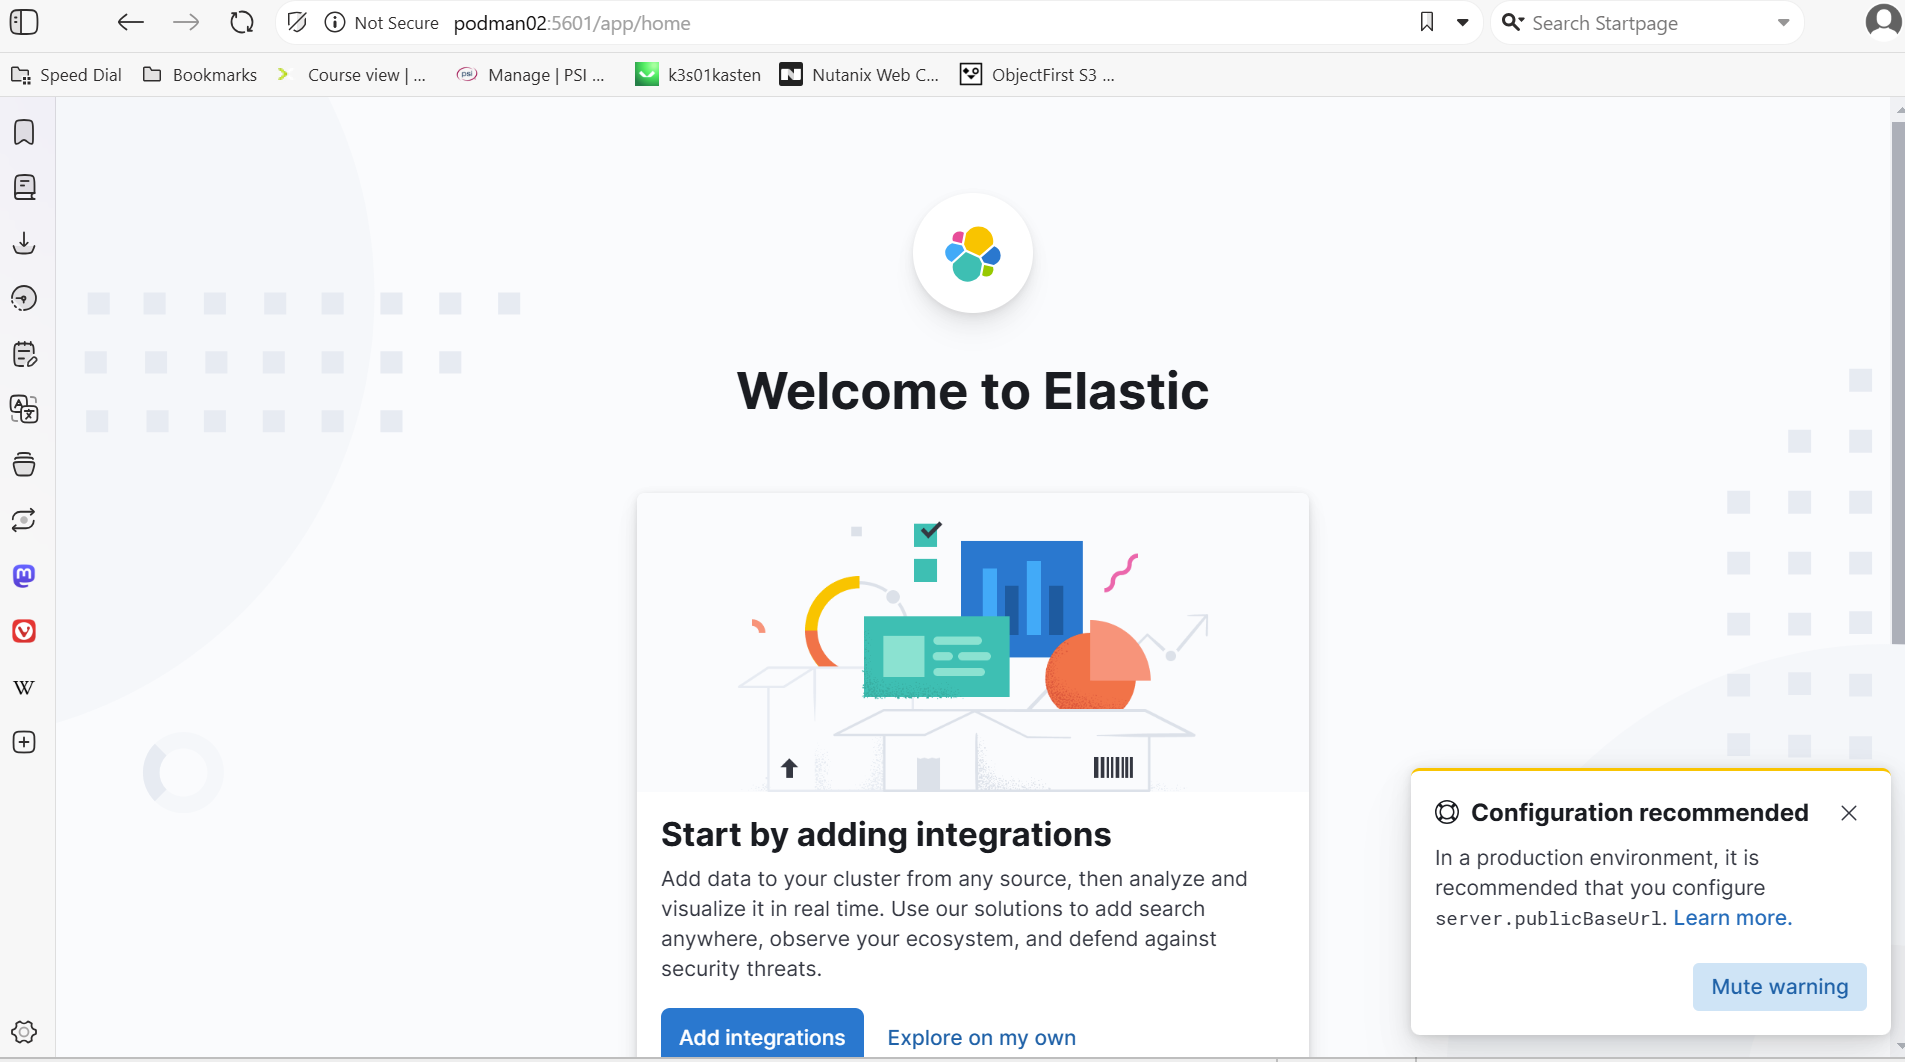
Press Explore on my own.
Just like that we are good to go:
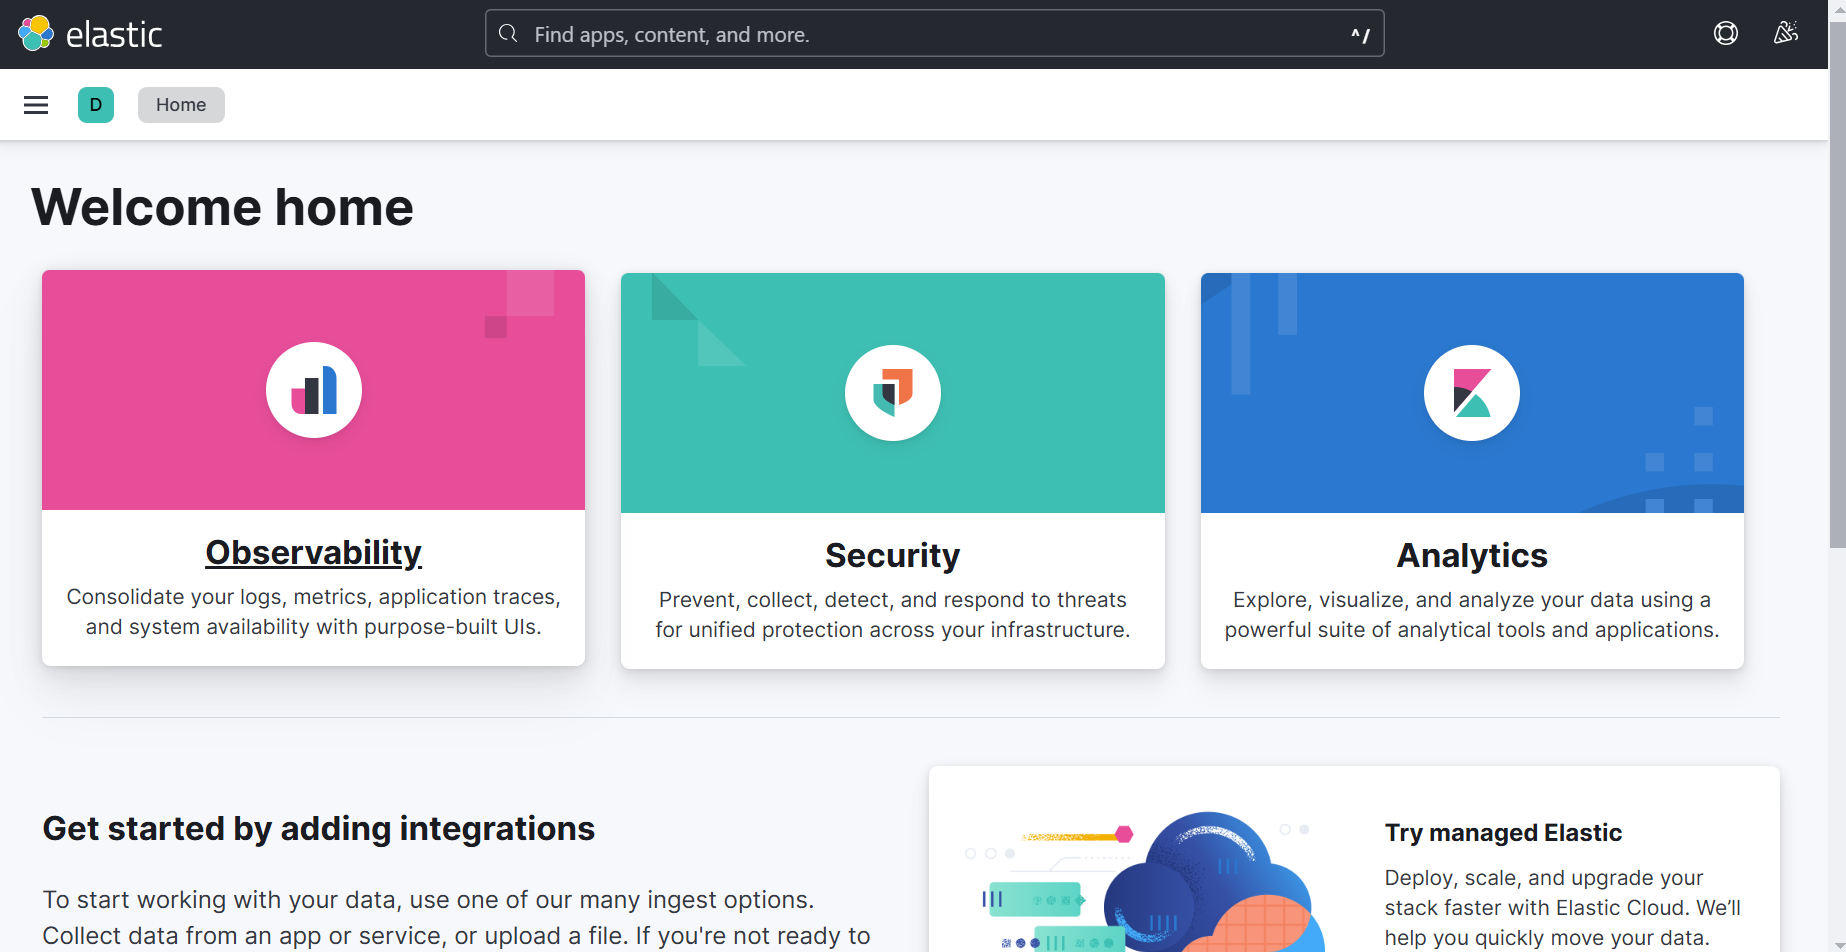
This Sandbox setup is very simple and we have not any security so never run this type of practice setup in production.
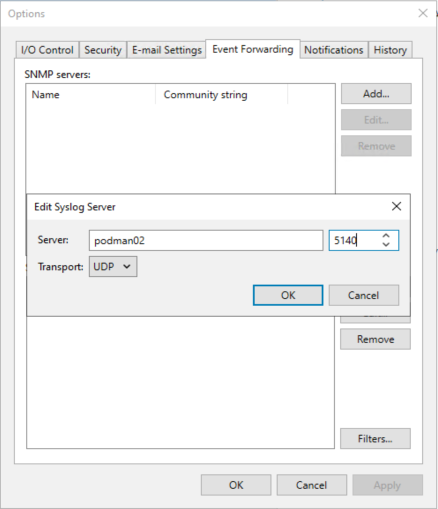
Now it is time to try and send some Veeam Data to EFK. We will need to target port 5140 on the target VM:
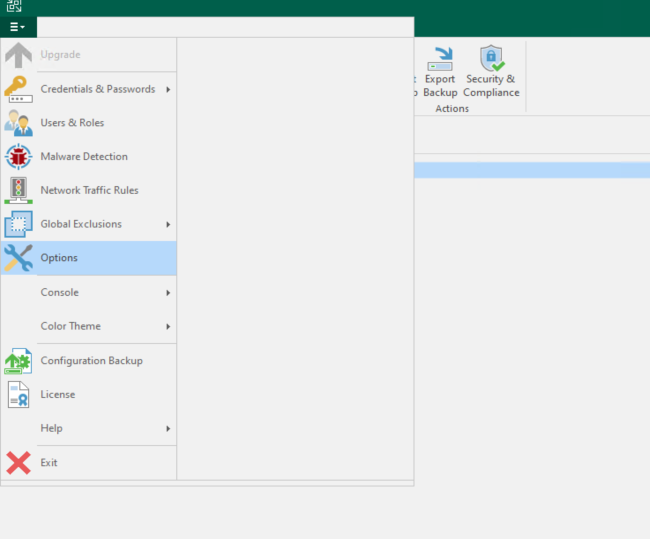
In the VBR server go to Options:
Then event forwarding:
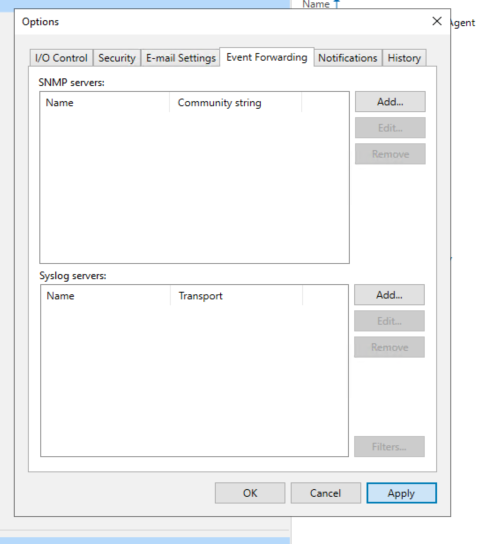
Here you can add the Ubuntu VM with Podman:
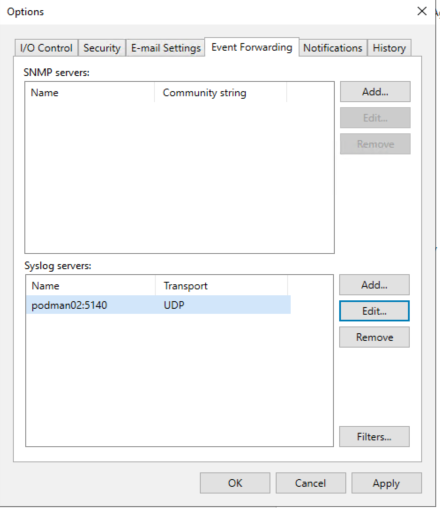
After pressing apply and ok Veeam should send out a test message:
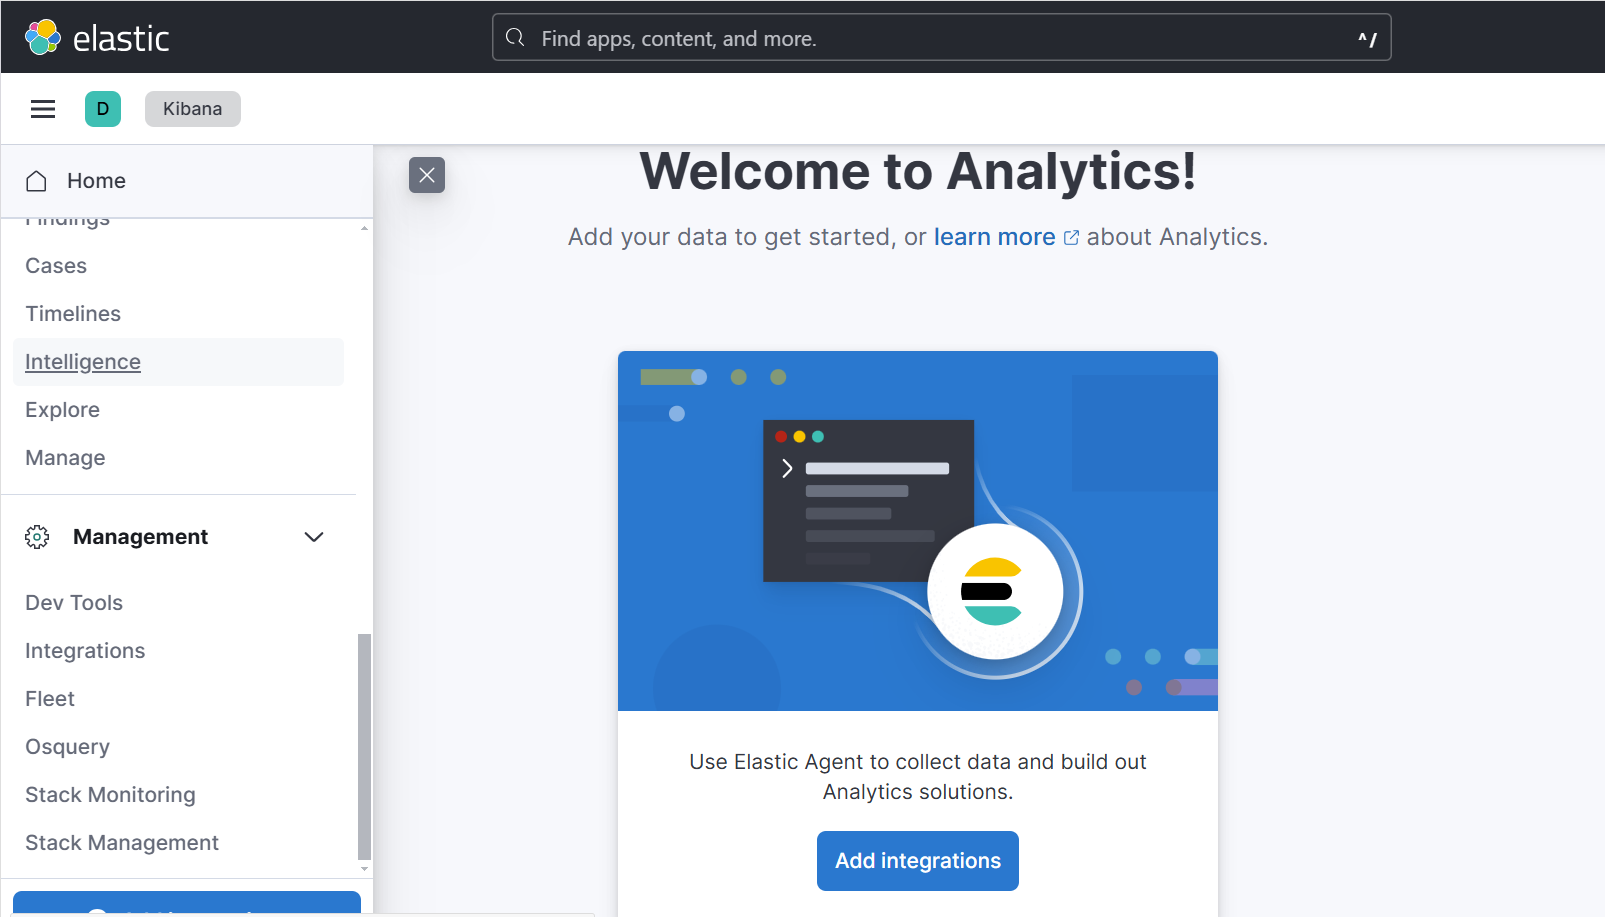
Back in Kibana on the left hand menu go down to Stack Management:
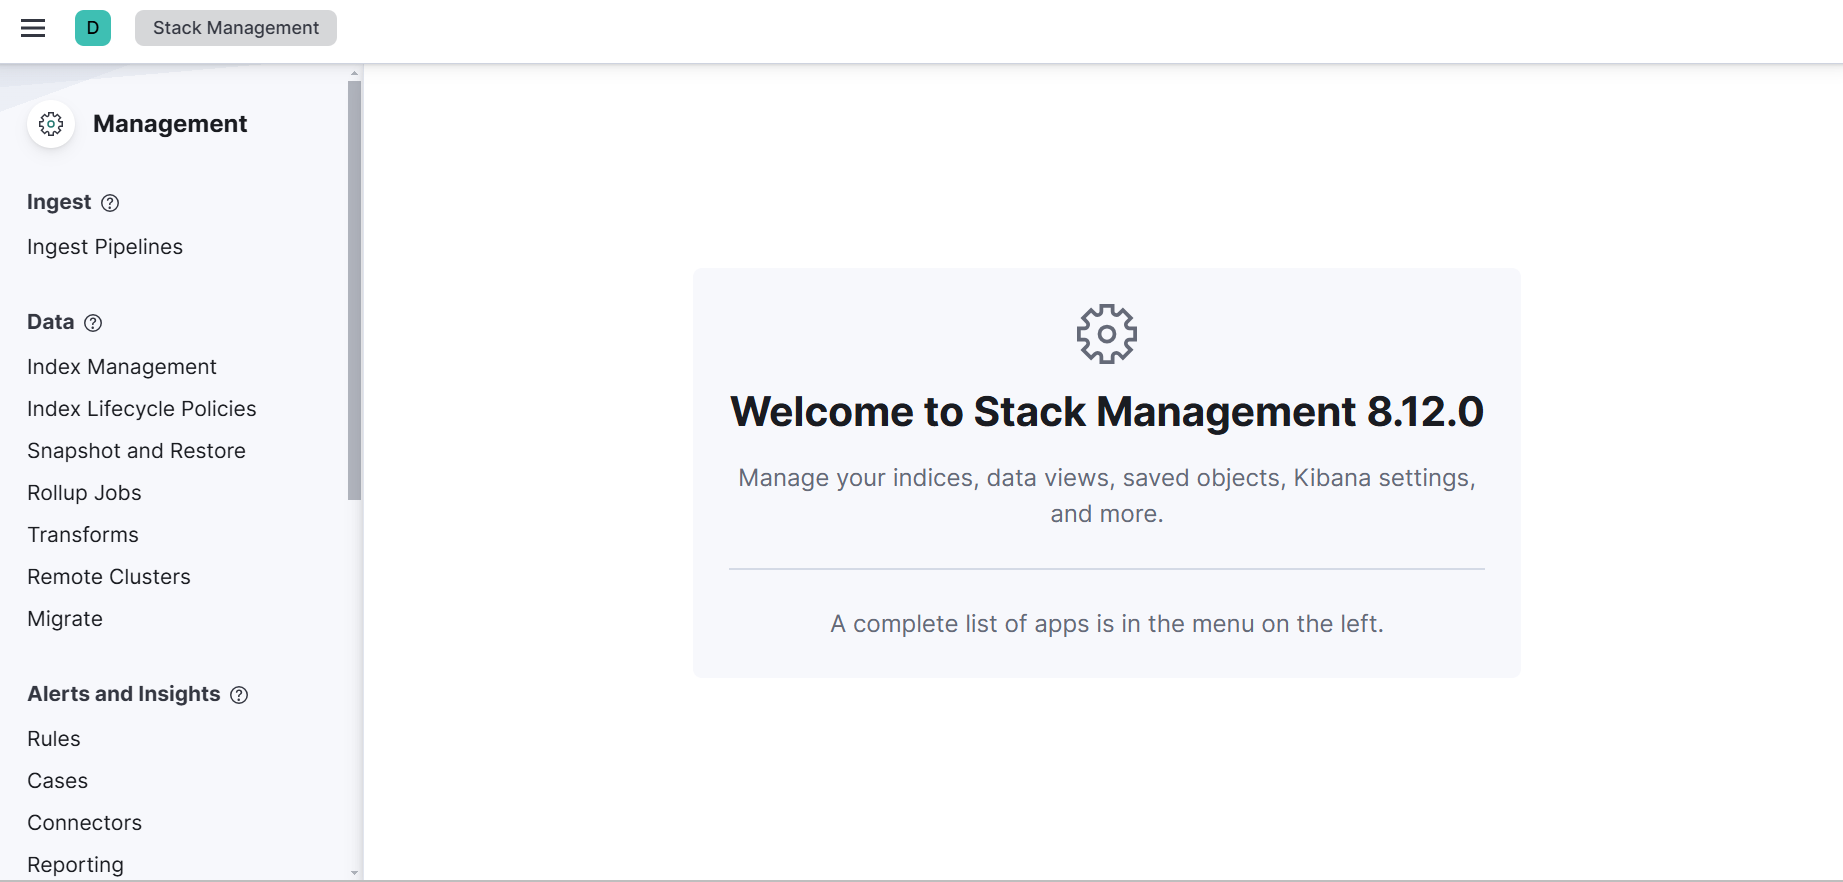
Then press on Index Management:
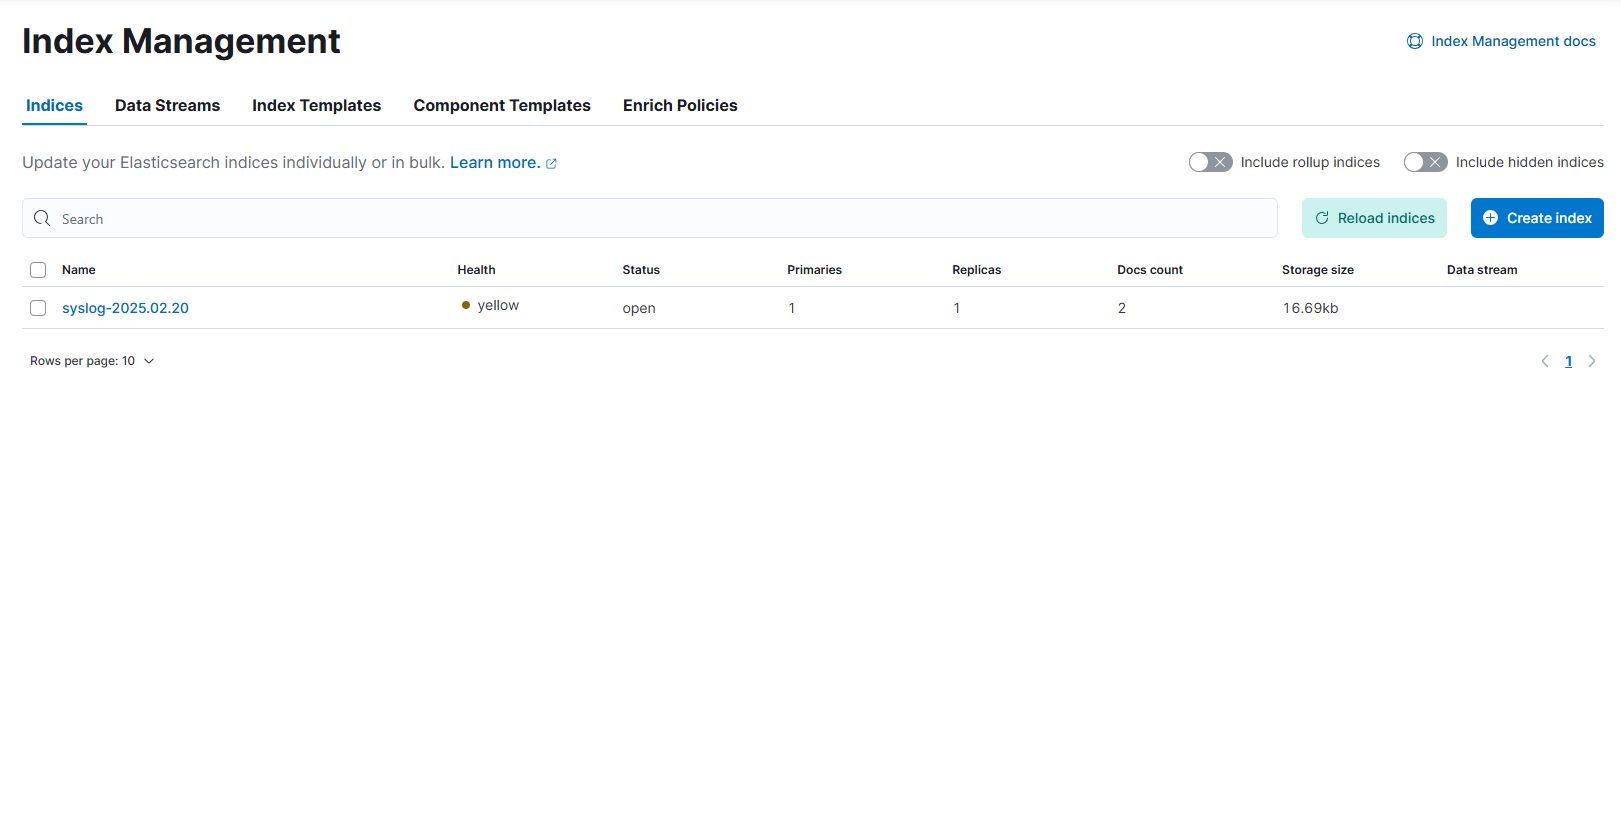
The Veeam Test Message has already appeared as seen above in a new Index.
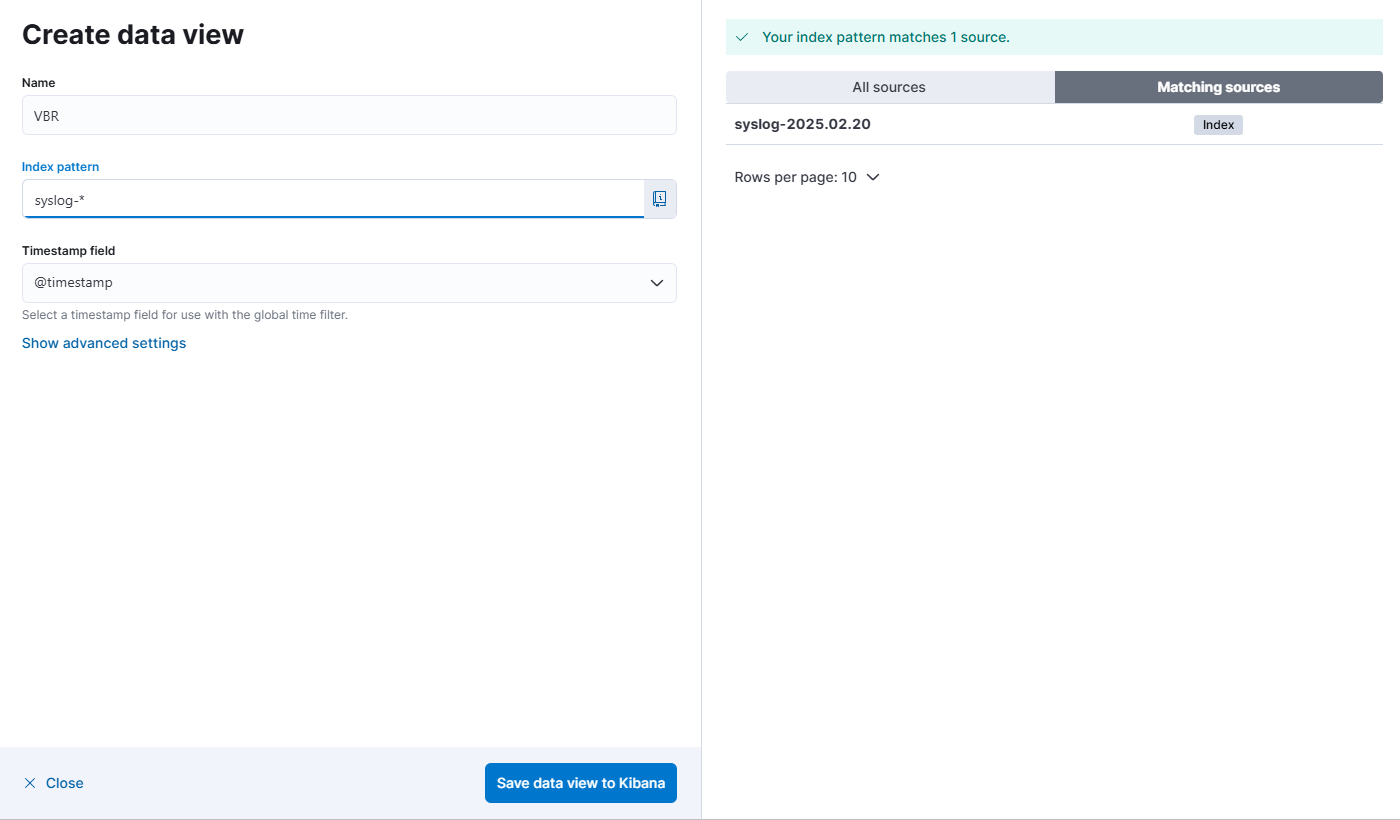
Now head back in the side menu to discover where we will create a simple data view:
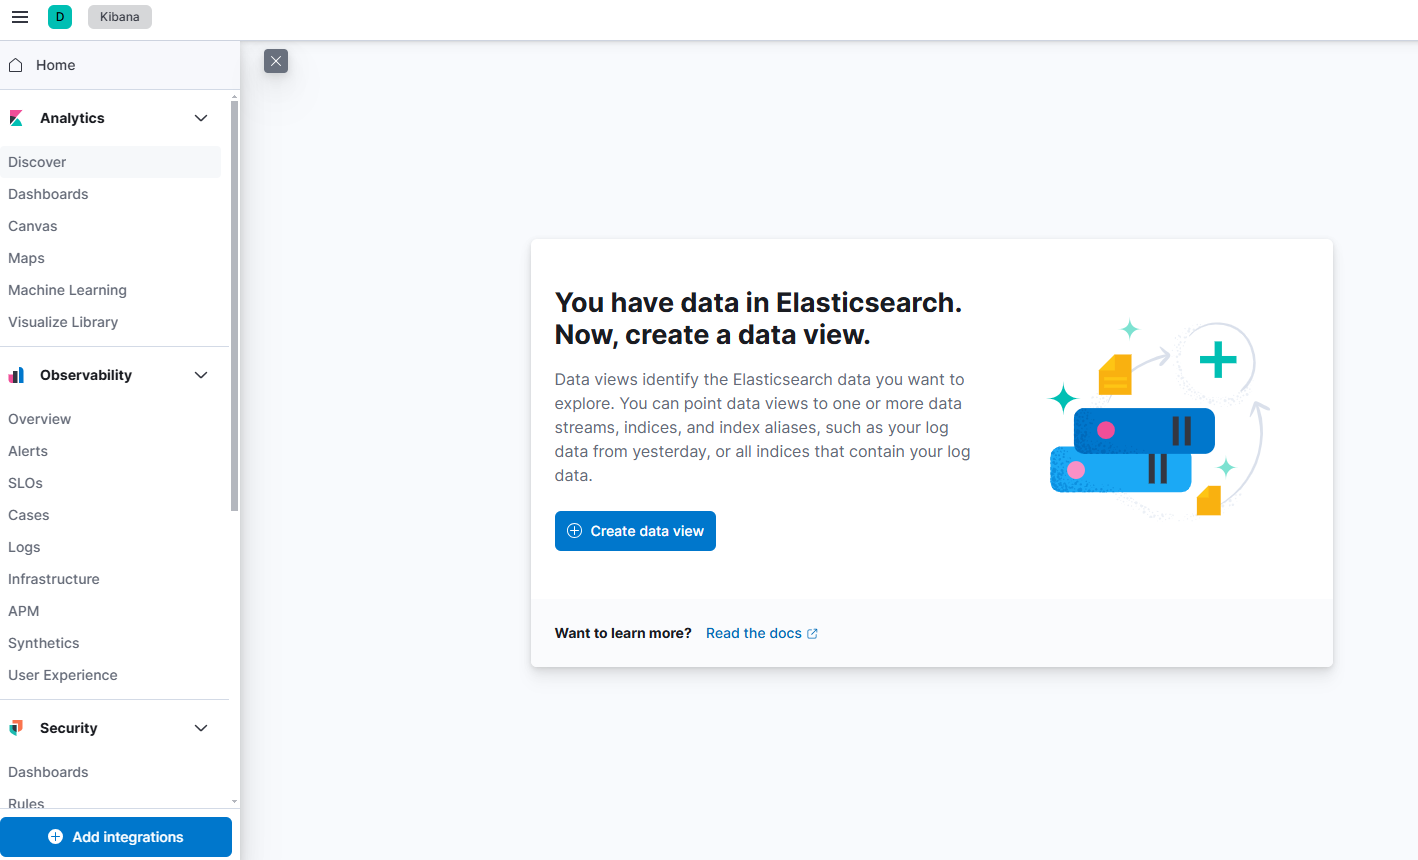
We are going to keep this very simple for now. A wildcard to catch everything:
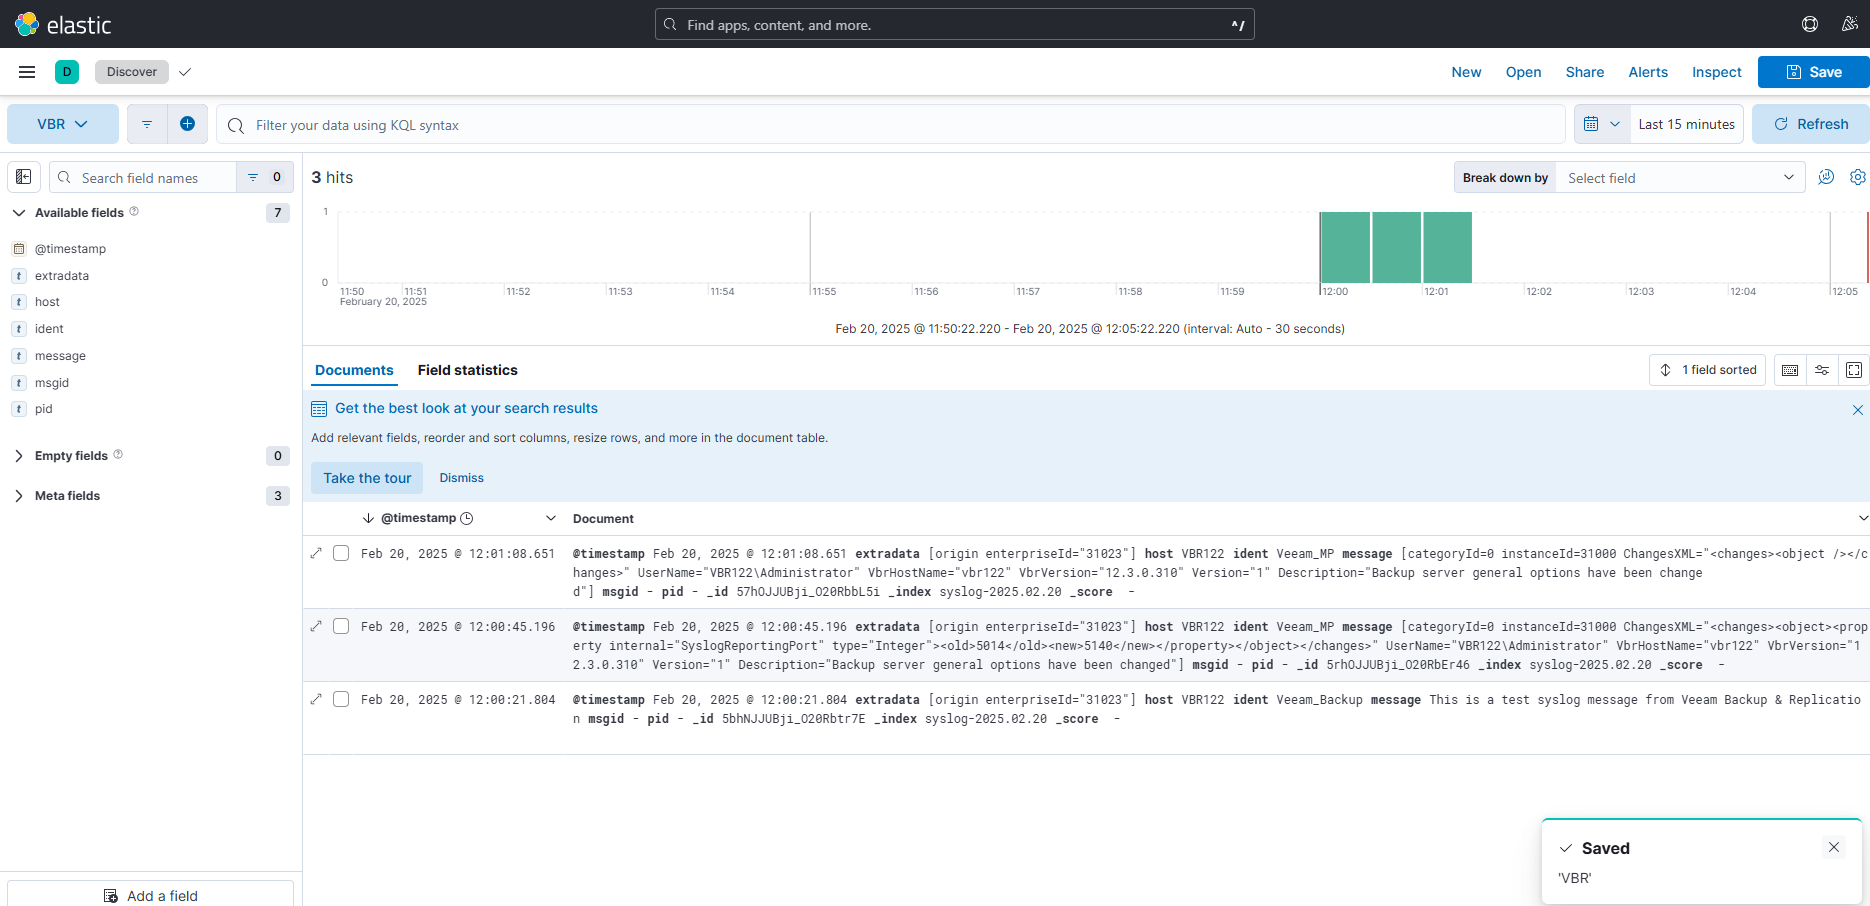
Already a couple of more syslog messages have come in.
This is only the start to leveraging EFK. It is a deep topic and I hope to do more Message Filtering and Dashboard configuration in my next post.
