Hi Everyone,
K10 version 4.5 came out yesterday and among other things has added Grafana to its list of features.
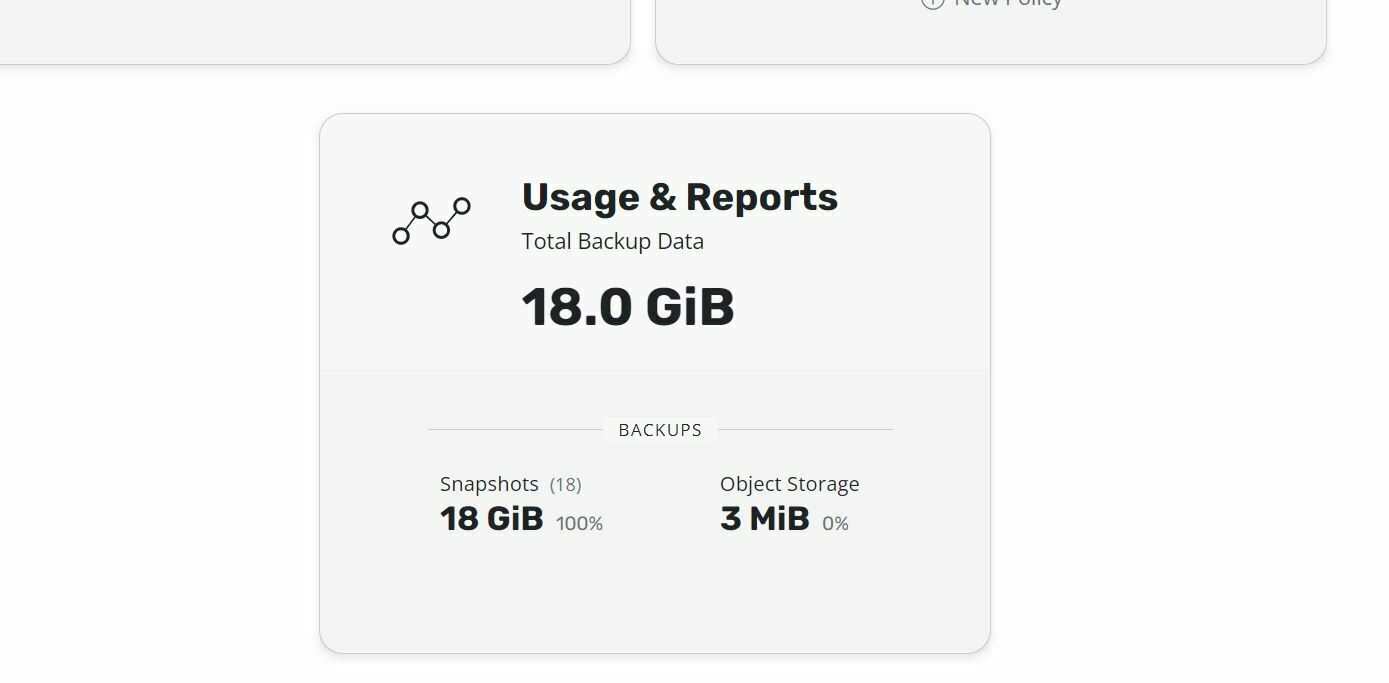
To turn Grafana on go to Usage & Reports in the dashboard and double click.


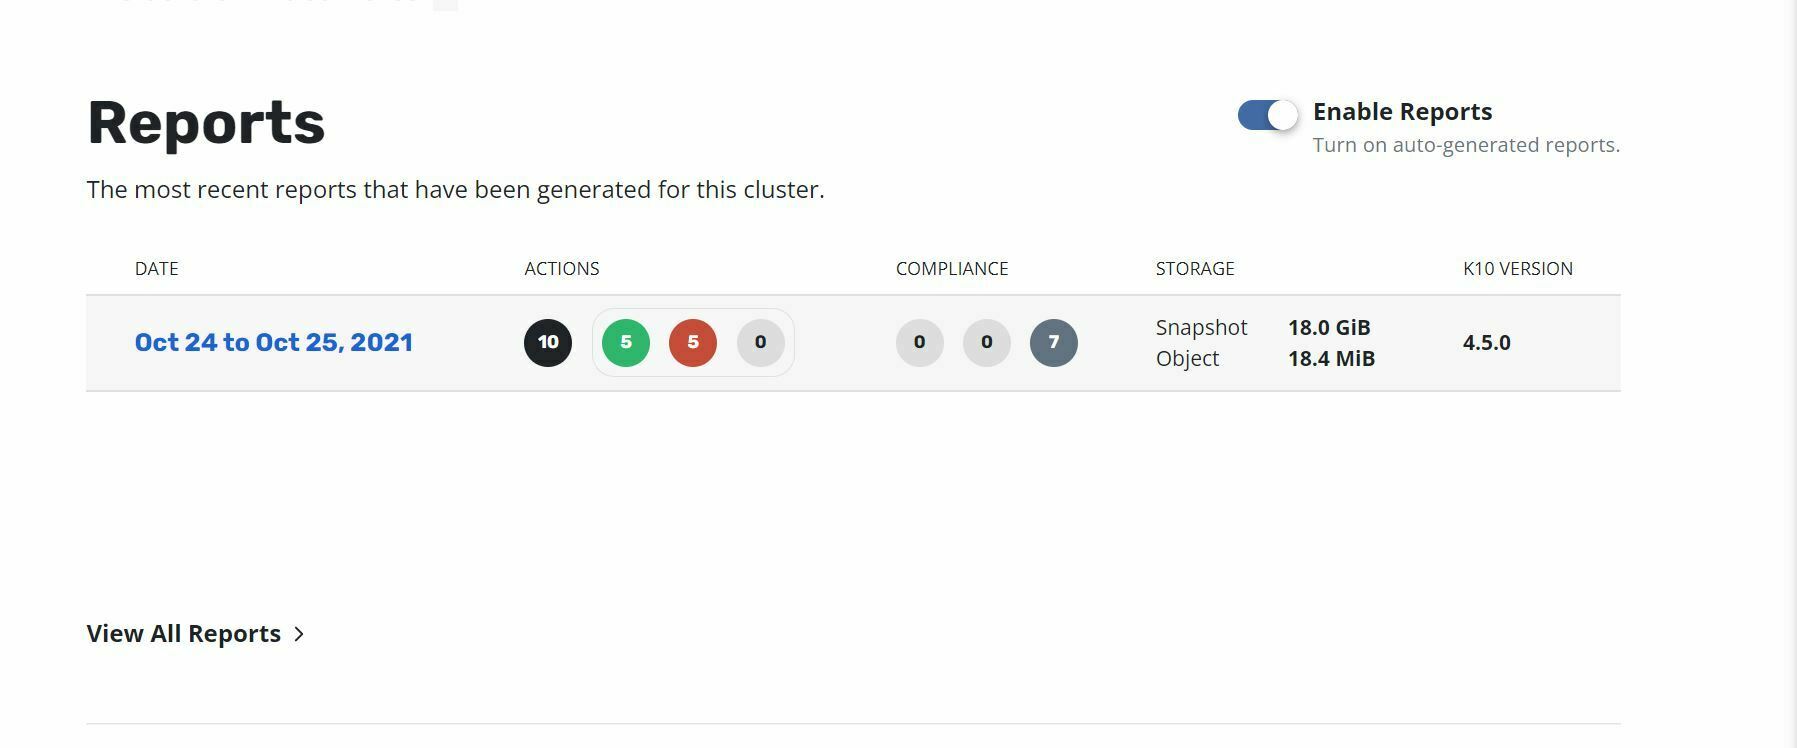
Here you can also enable reports that will be auto generated.
Lower down on the page you can go to Grafana by selecting “More Charts and Alerts”

Voila:

Grafana is a whole topic unto itself but Veeam have a Grafana wizard in the likes of Jorge De La Cruz @jorge.delacruz https://jorgedelacruz.uk/tag/grafana who has done an amazing job of explaining how one can use it with Veeam.


