
Turn on Grafana in K10 4.5

  • October 26, 2021
  • 5 comments
  • 72 views

Geoff Burke
Forum|alt.badge.img+22

Hi Everyone,

K10 version 4.5 came out yesterday and among other things has added Grafana to its list of features.

To turn Grafana on go to Usage & Reports in the dashboard and double click.


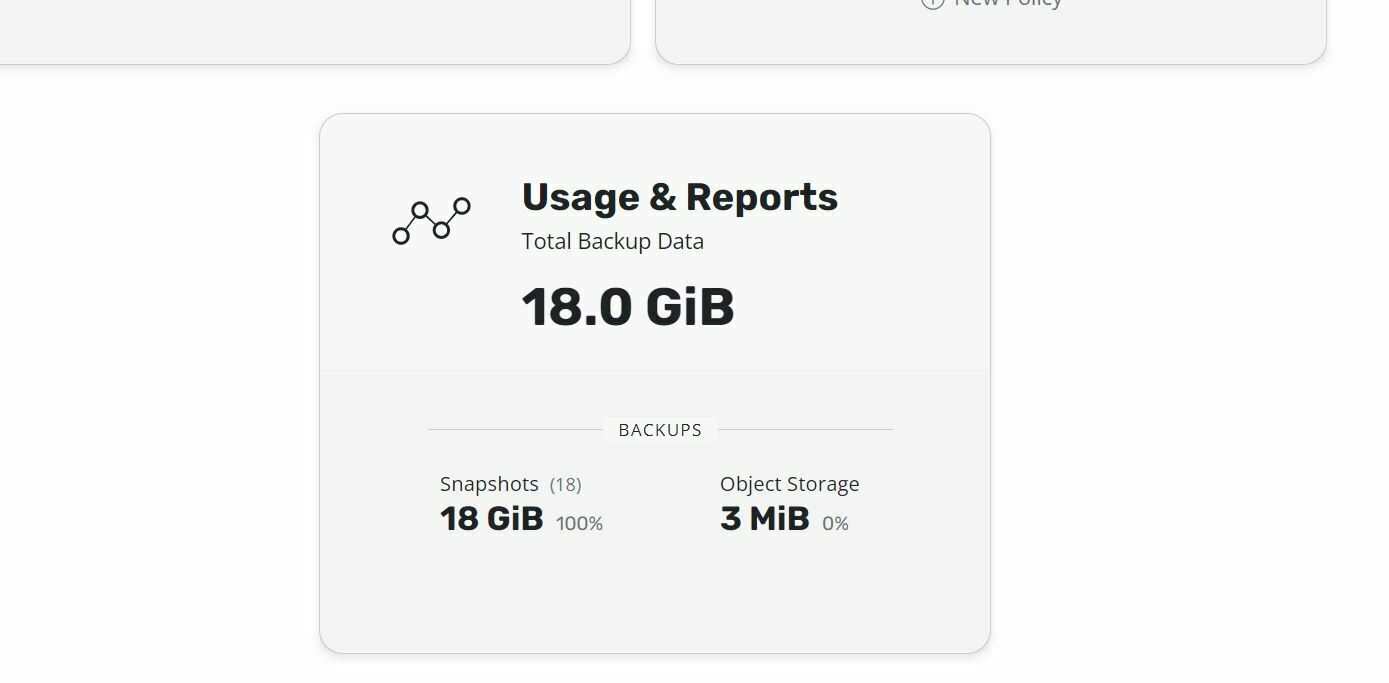
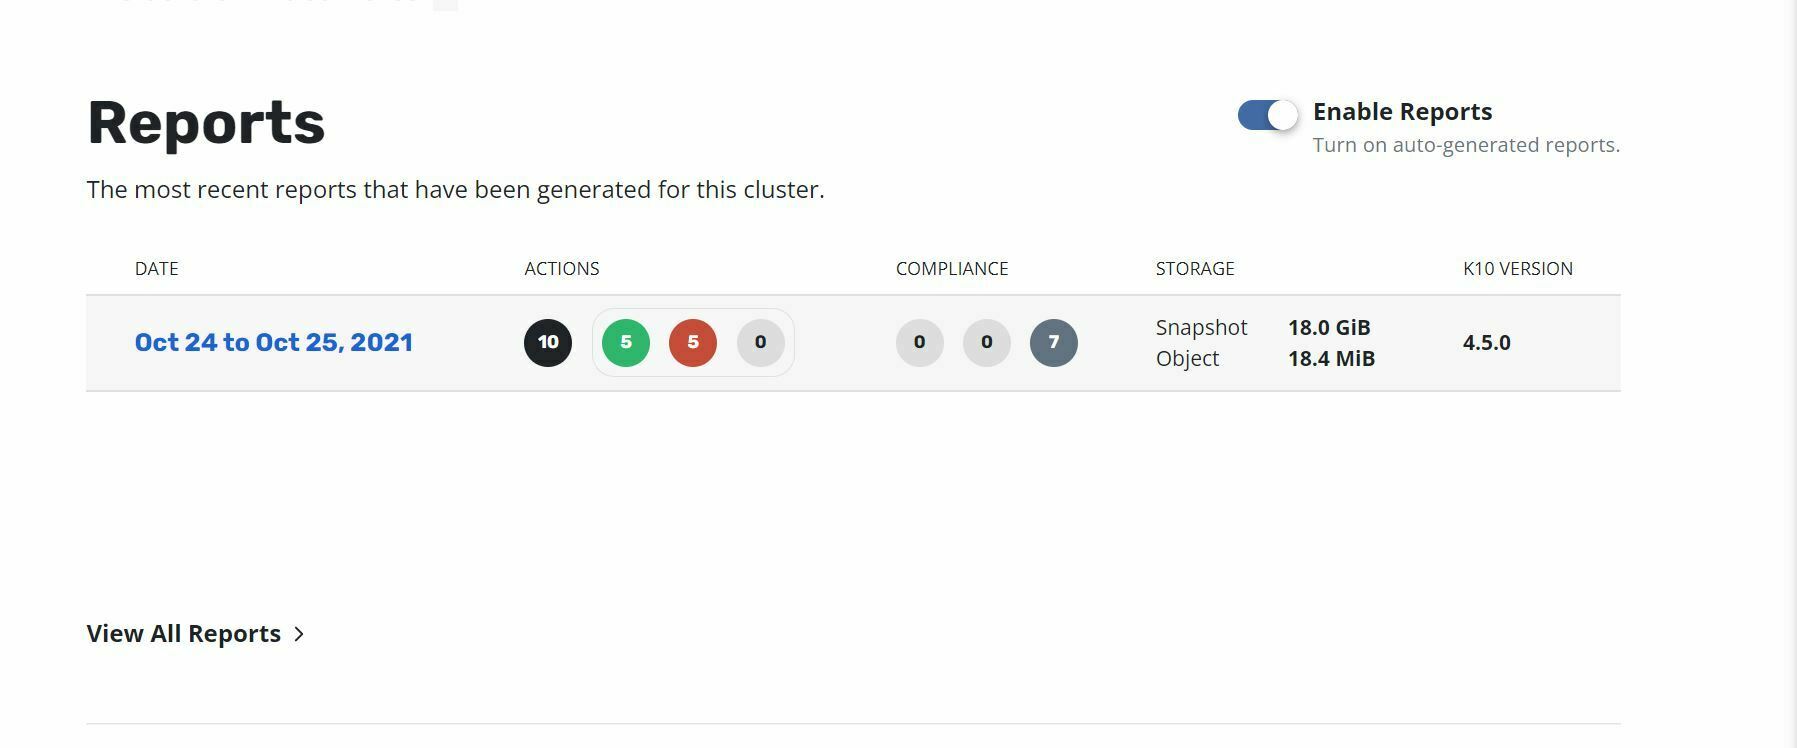
Here you can also enable reports that will be auto generated. 

Lower down on the page you can go to Grafana by selecting “More Charts and Alerts”


Voila:


Grafana is a whole topic unto itself but Veeam have a Grafana wizard in the likes of Jorge De La Cruz @jorge.delacruz  https://jorgedelacruz.uk/tag/grafana who has done an amazing job of explaining how one can use it with Veeam. 

5 comments

JMeixner
Forum|alt.badge.img+18
  • On the path to Greatness
  • October 26, 2021

Fine, nice that it is directly integrated now.


Chris.Childerhose
Forum|alt.badge.img+22
  • Veeam Legend, Veeam Vanguard
  • October 26, 2021

Great post @Geoff Burke have to see this


Iams3le
Forum|alt.badge.img+14
  • October 26, 2021

Informative! Thank you for sharing @Geoff Burke 


Forum|alt.badge.img+3
  • Experienced User
  • October 26, 2021

Great post @Geoff Burke


ashanpro
Forum|alt.badge.img+1
  • Experienced User
  • October 26, 2021

Thank you for sharing @Geoff Burke