


Hello Veeam community! 😊
VDC recently added a new capability to send events from the Control Plane and Microsoft 365 to SIEM platforms (with Entra ID coming soon as well).
Today, it supports Splunk and CrowdStrike, but there is also a 3rd connector that opens the door to many more possibilities: the Generic Webhook connector. 🤩
And of course… that gave some ideas, right?
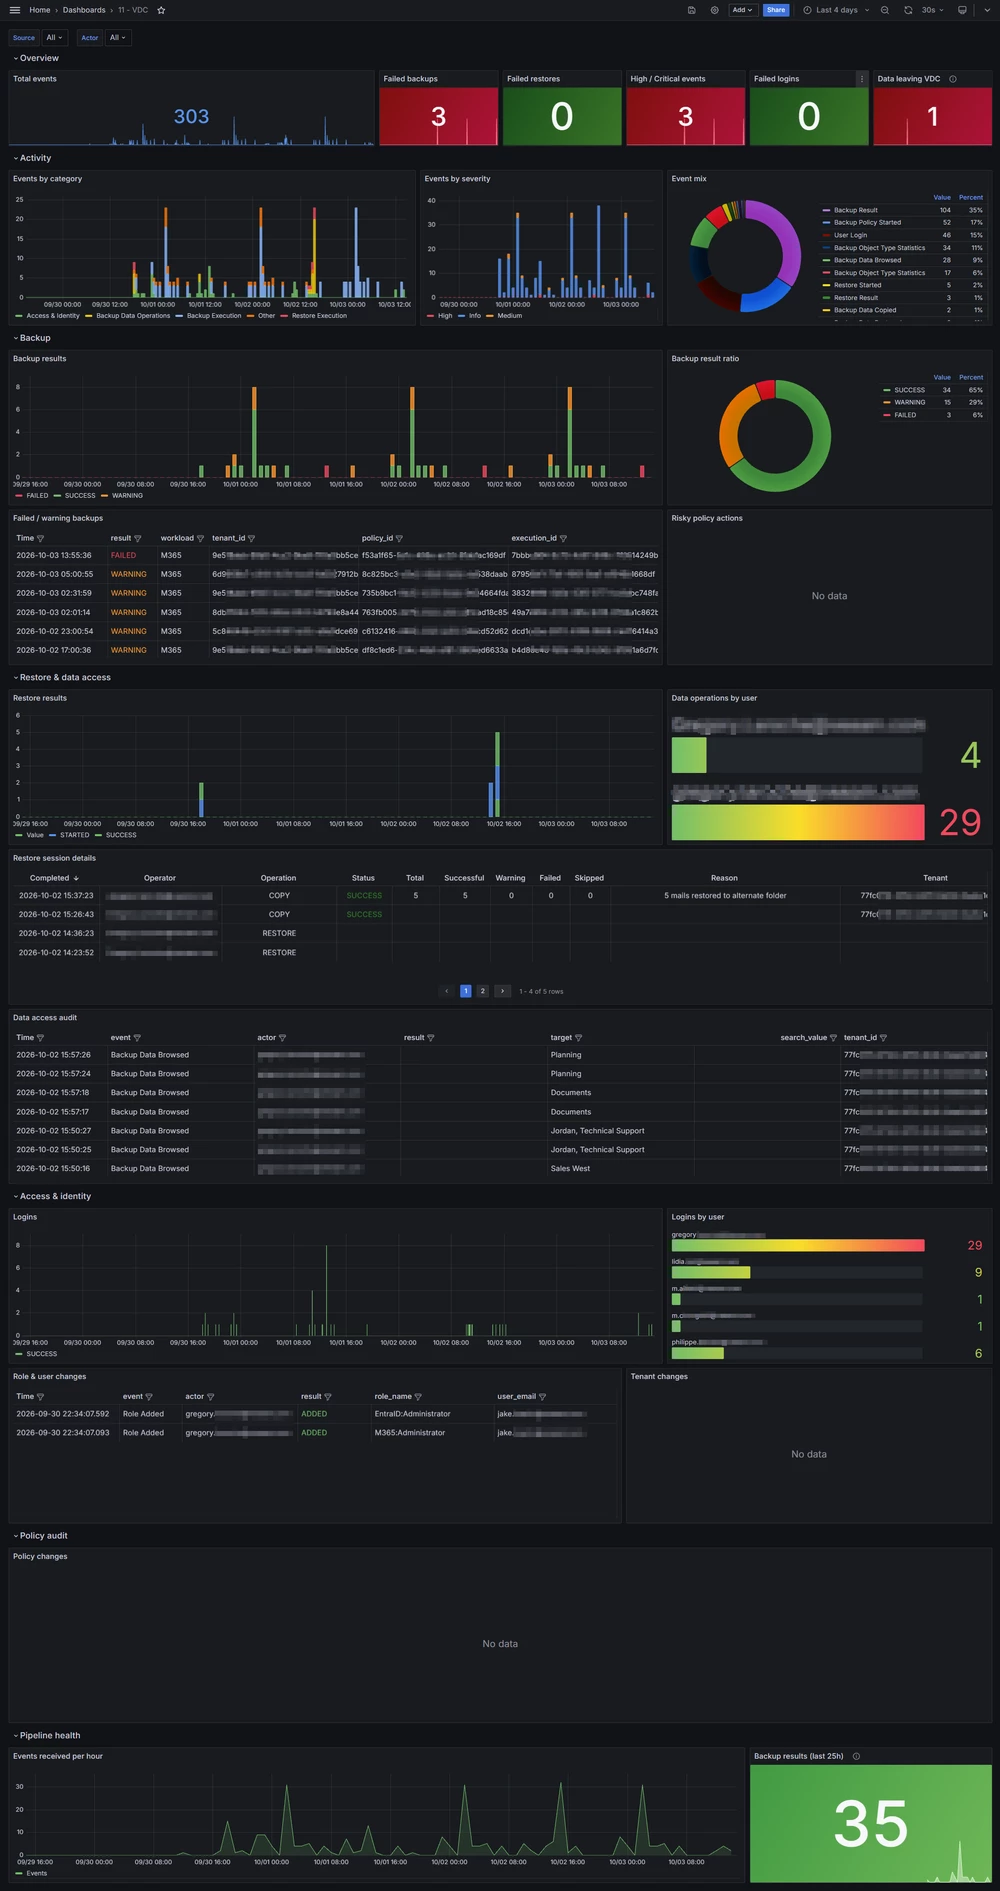
As a big Grafana fan, I started wondering: could we use this webhook to send VDC events into Grafana and build a dedicated dashboard?
So, et voilà guys… I built it in my lab. 😄
I used my usual monitoring stack: Telegraf → InfluxDB → Grafana
The full setup, configuration, and all the steps are available in my latest blog article: https://home.point4.fr/monitoring-vdc-using-grafana/
And just to give you a small preview, here is what the final dashboard looks like.
Of course, I’m also sharing the Grafana JSON dashboard file, so you don’t have to start from scratch. 😉
Hope you enjoy it!
❤️ to this community.