Solved

K10 usage and reports dashboard does not show data


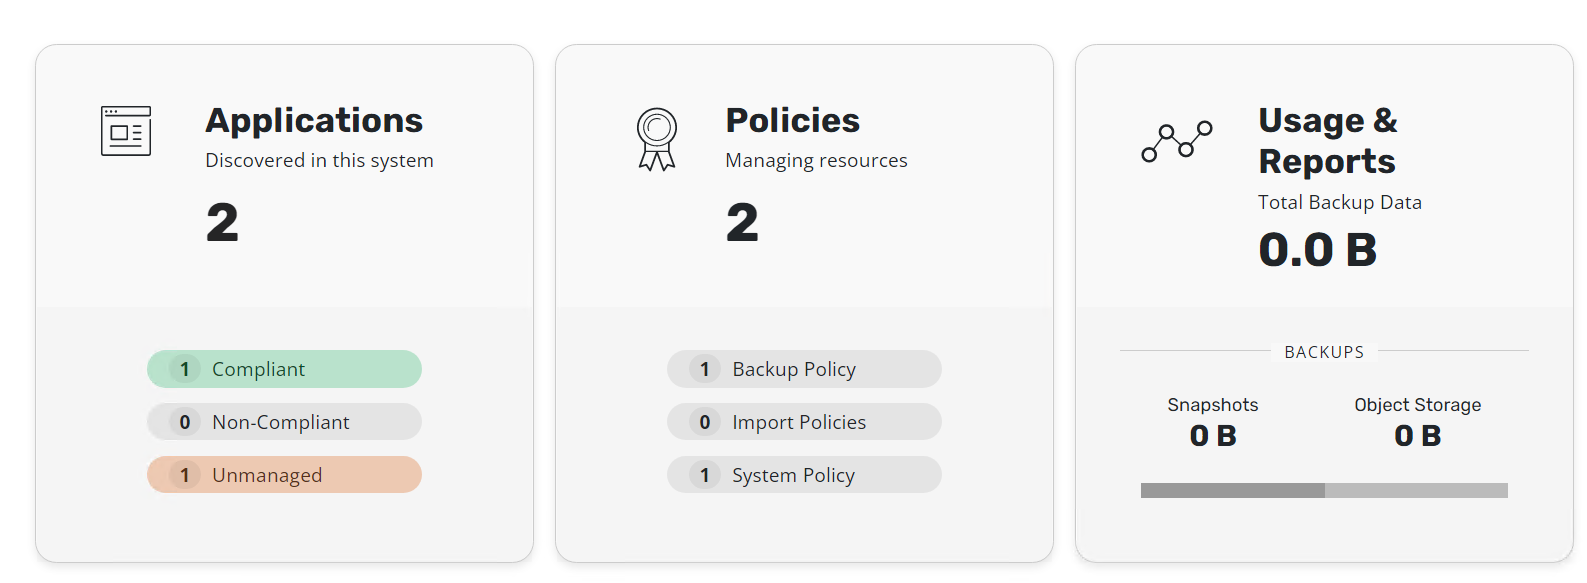
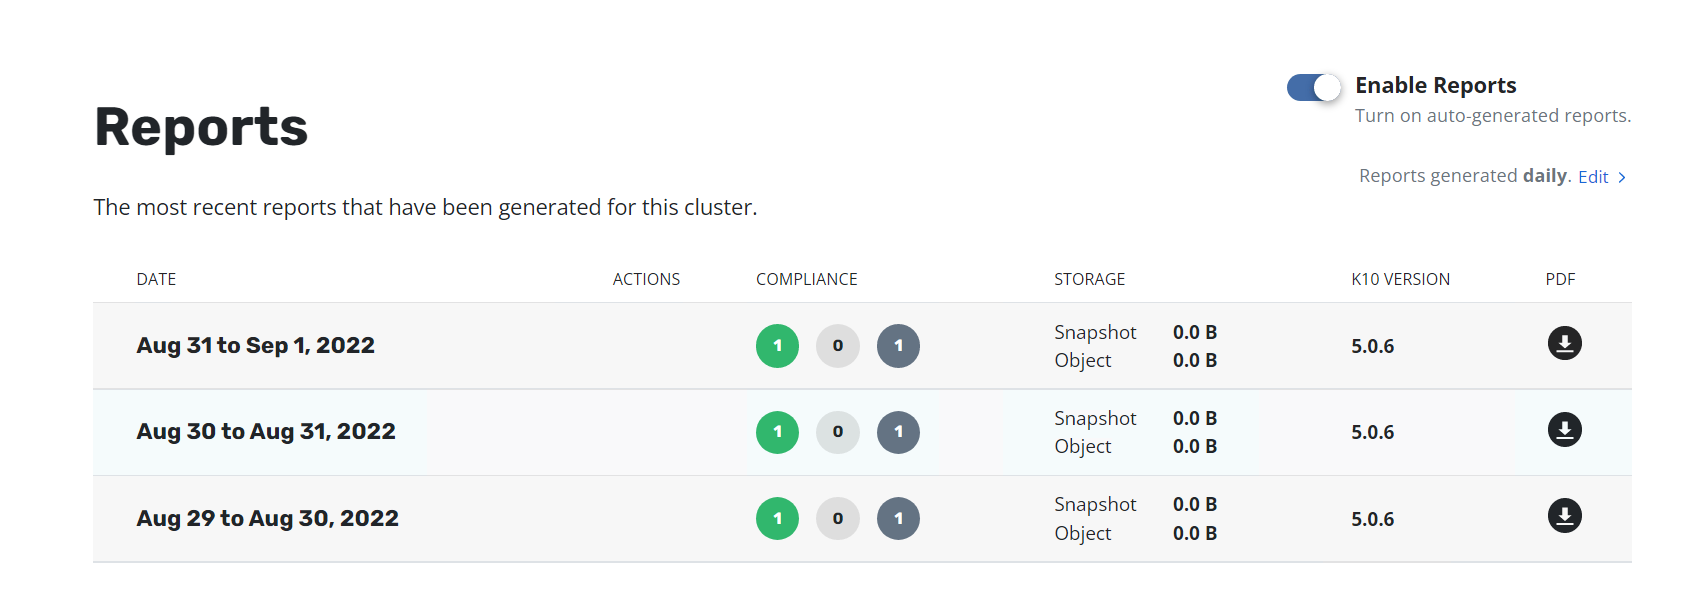
I have installed Kasten K10 with disabling default Grafana . Usage and reports in K10 dashboard shows nothing. I have enabled the reports. What else needs to be done to show data in usage and reports.  However back and restore is completed for the applications but does not show it in the tab. Please suggest.


Best answer by jaiganeshjk

@Madhuri Thanks for posting this question.
Yes, K10 gets this metrics from Prometheus. If you have disabled prometheus, you won’t see any data populated in the usage metrics.

K10 integrates deeply with prometheus so that a lot of operations/health checks need prometheus to be running.

We recommend you to enable prometheus or if you already have a prometheus running in the cluster, configure K10 to use that(https://docs.kasten.io/latest/operating/monitoring.html#integrating-external-prometheus-with-k10).

View original
Did this topic help you find an answer to your question?

11 comments

marcofabbri
Forum|alt.badge.img+13
  • On the path to Greatness
  • 990 comments
  • September 1, 2022

Captain @Geoff Burke , we need you.


Geoff Burke
Forum|alt.badge.img+22
  • Veeam Legend, Veeam Vanguard
  • 1318 comments
  • September 1, 2022

Hi Folks,


I will need to try this myself as I have not yet tried turning off grafana. I know that there was info there before grafana was added to Kasten since prometheus was present. 


  • Author
  • Comes here often
  • 11 comments
  • September 1, 2022

@Geoff Burke Thank you for responding. I have disabled both k10 default Prometheus and Grafana and have installed it separately. Is it something that k10 prometheus is not there hence the data is not showing? Do we have any other way?


jaiganeshjk
Forum|alt.badge.img+2
  • Experienced User
  • 275 comments
  • Answer
  • September 1, 2022

@Madhuri Thanks for posting this question.
Yes, K10 gets this metrics from Prometheus. If you have disabled prometheus, you won’t see any data populated in the usage metrics.

K10 integrates deeply with prometheus so that a lot of operations/health checks need prometheus to be running.

We recommend you to enable prometheus or if you already have a prometheus running in the cluster, configure K10 to use that(https://docs.kasten.io/latest/operating/monitoring.html#integrating-external-prometheus-with-k10).


  • Author
  • Comes here often
  • 11 comments
  • September 6, 2022

@jaiganeshjk Thank you , I will try out this. 


  • Author
  • Comes here often
  • 11 comments
  • April 20, 2023

@jaiganeshjk - Hope you are doing good!


Had a query - Is the port forwarding for Grafana & Prometheus is same in Cloud Cluster?

Not taking with IP address

kubectl --namespace default port-forward --address 172.28.216.100 service/testprometheus-grafana 3000:80 --kubeconfig E:\kubectl\demo6_admin_kubeconfig


Unable to listen on port 3000: Listeners failed to create with the following errors: [unable to create listener: Error listen tcp4 172.28.216.100:3000: bind: The requested address is not valid in its context.]
error: unable to listen on any of the requested ports: [{3000 3000}]


jaiganeshjk
Forum|alt.badge.img+2
  • Experienced User
  • 275 comments
  • April 20, 2023

Yes Madhuri. Port-forwarding procedure should be same for all the applications provided you use the correct ports.

In the above scenario, You are forwarding requests to port 3000 to port 80. This will work if your application listens in that port. 


For example, K10 listens on port 8000. So, We use the below command.

kubectl port-forward svc/gateway 8080:8000 -n kasten-io


  • Author
  • Comes here often
  • 11 comments
  • April 20, 2023

Thank you, True. It was working fine and I was able to access GUI while i was doing PoC. 

Usually Grafana listens in 3000 port and Prometheus in 9090 right?


E:\kubectl>kubectl get pods -n default 
NAME                                     READY   STATUS    RESTARTS   AGE
testprometheus-grafana-55c879d7d-x57ck   1/1     Running   0          41h


E:\kubectl> kubectl get svc -n default --kubeconfig E:\kubectl\demo6_admin_kubeconfig
NAME                     TYPE        CLUSTER-IP     EXTERNAL-IP   PORT(S)   AGE
kubernetes               ClusterIP   10.96.0.1      <none>        443/TCP   22d
testprometheus-grafana   ClusterIP   10.100.87.34   <none>        80/TCP    45h


This command should work right?

E:\kubectl>kubectl --namespace default port-forward --address 172.28.216.100 service/testprometheus-grafana 3000:80 


E:\kubectl>kubectl --namespace default port-forward --address 172.28.216.100 service/testprometheus-grafana 3000:80 --kubeconfig E:\kubectl\demo6_admin_kubeconfig
Unable to listen on port 3000: Listeners failed to create with the following errors: [unable to create listener: Error listen tcp4 172.28.216.100:3000: bind: The requested address is not valid in its context.]
error: unable to listen on any of the requested ports: [{3000 3000}]


This gives the error - Could you please help?


  • Author
  • Comes here often
  • 11 comments
  • April 21, 2023

@jaiganeshjk - Thank you- I was able to do it. Working now


  • Author
  • Comes here often
  • 11 comments
  • April 21, 2023

@jaiganeshjk 

To get admin password for grafana  - 

kubectl get secret --namespace default testprometheus-grafana -o jsonpath="{.data.admin-password}" | base64 --decode ; echo

base64 is not supported in windows CLI. 


Can you let me know how to decode the admin password?

admin/admin is also not working


Geoff Burke
Forum|alt.badge.img+22
  • Veeam Legend, Veeam Vanguard
  • 1318 comments
  • April 21, 2023
Madhuri wrote:

@jaiganeshjk

To get admin password for grafana  - 

kubectl get secret --namespace default testprometheus-grafana -o jsonpath="{.data.admin-password}" | base64 --decode ; echo

base64 is not supported in windows CLI. 


Can you let me know how to decode the admin password?

admin/admin is also not working

Do you have the windows subsystem for linux installed? I have that and am using the ubuntu distribution and can run everything now, even remmina desktop client (windows 11). 


Comment