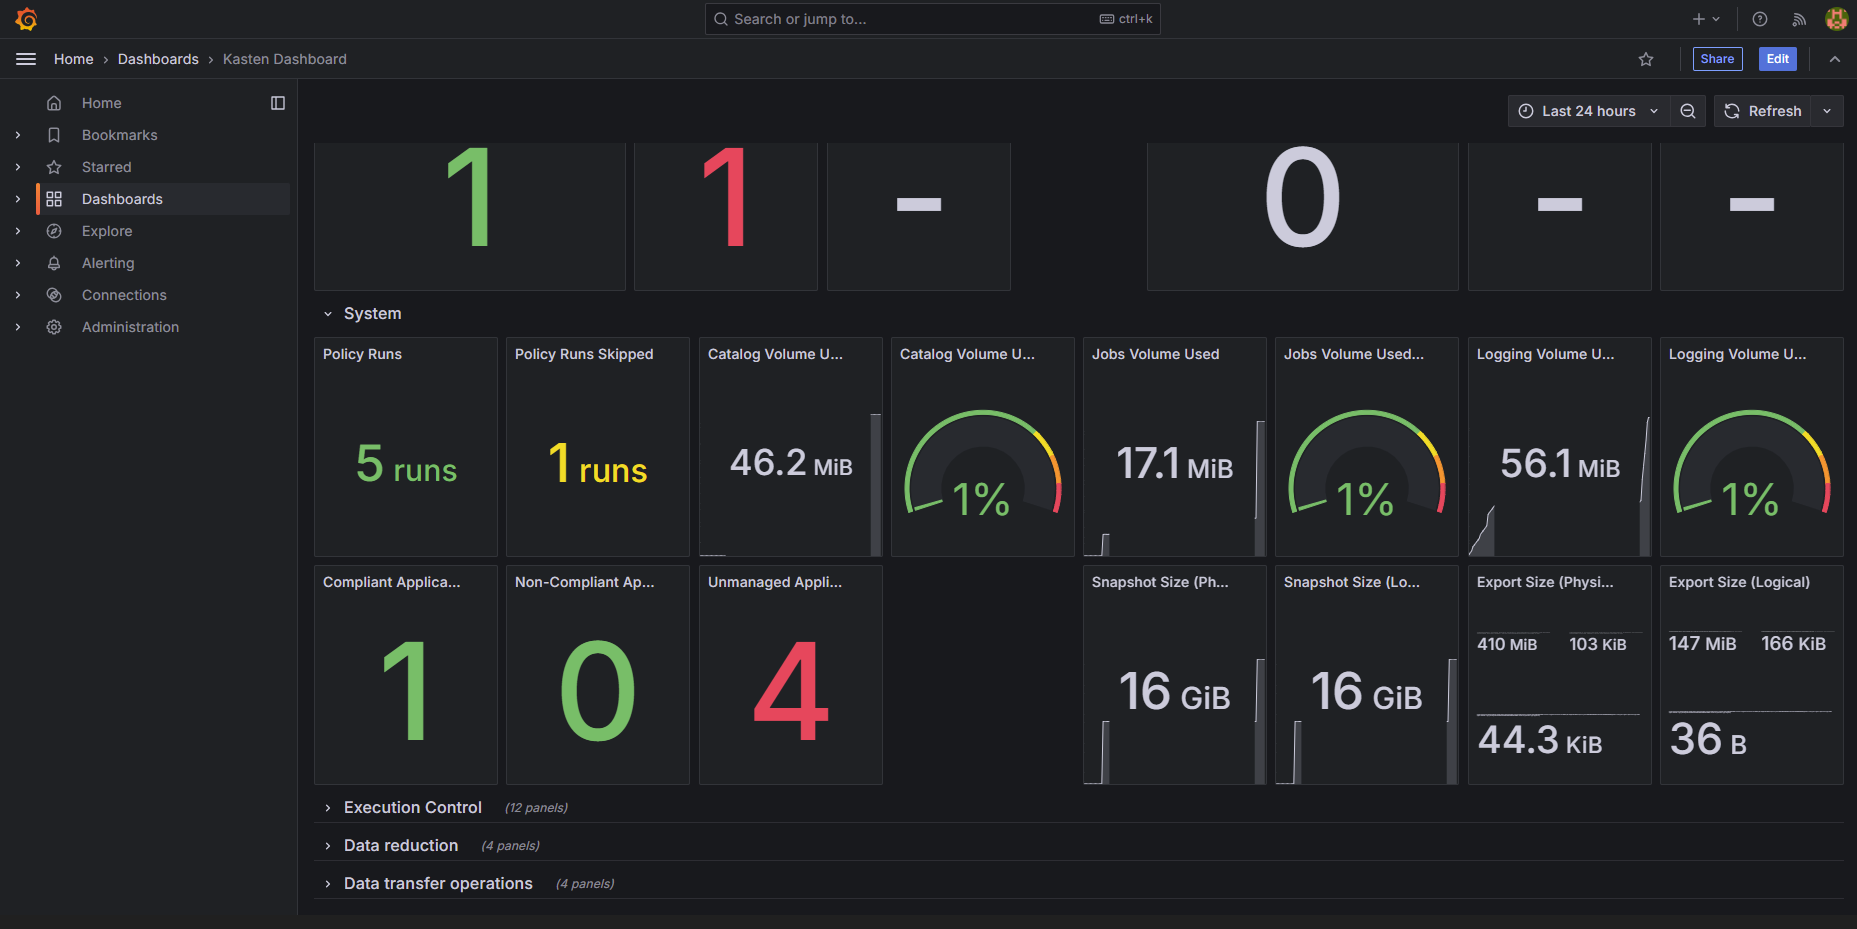
Hi folks,
As promised a quick blog post about Kasten 7.5. Keep in mind that
I wanted to go over today Grafana, or better put the fact that grafana is no longer included in the default Kasten installation.
However, they have been kind enough to provide us with setup instructions that you can find here:
I will admit I was a bit of a dare devil and just upgraded and am install grafana after the fact. They do warn you to install but …
First we need to add the grafana helm repo chart:
helm repo add grafana https://grafana.github.io/helm-charts

helm repo update
Next I will create namespace, you could include this in the helm install command but old habits..
kubectl create namespace monitoringNext comes a very important part. You need to create a values file with the specific values that you want for this setup and of course the values provided by Veeam on the KB page mentioned above.
For my installation on K3s I am going to enable ingress in order to reach the dashboard and give a specific hostname which will be a cname DNS record to the k3s host.
my values file:
ingress:
  enabled: true
  annotations:
    kubernetes.io/ingress.class: traefik
  labels: {}
  path: /

  pathType: Prefix

  hosts:
    - grafana.lab1.local


persistence:
  enabled: true

dashboardProviders:
  dashboardproviders.yaml:
    apiVersion: 1
    providers:
    - name: 'default'
      orgId: 1
      folder: ''
      type: file
      disableDeletion: false
      editable: true
      options:
        path: /var/lib/grafana/dashboards/default

dashboards:
  default:
    k10-dashboard:
      gnetId: 21065
      revision: 1
      datasource:
      - name: DS_PROMETHEUS
        value: Prometheus
      - name: VAR_CLUSTER
        value: ""
datasources:
  datasources.yaml:
    apiVersion: 1
    datasources:
    - access: proxy
      editable: false
      isDefault: true
      jsonData:
        timeInterval: 1m
      name: Prometheus
      type: prometheus
      url: http://prometheus-server.kasten-io/k10/prometheus/
Now for the installation:
helm install my-grafana grafana/grafana --namespace monitoring -f values.yaml
After a short wait you should see this:
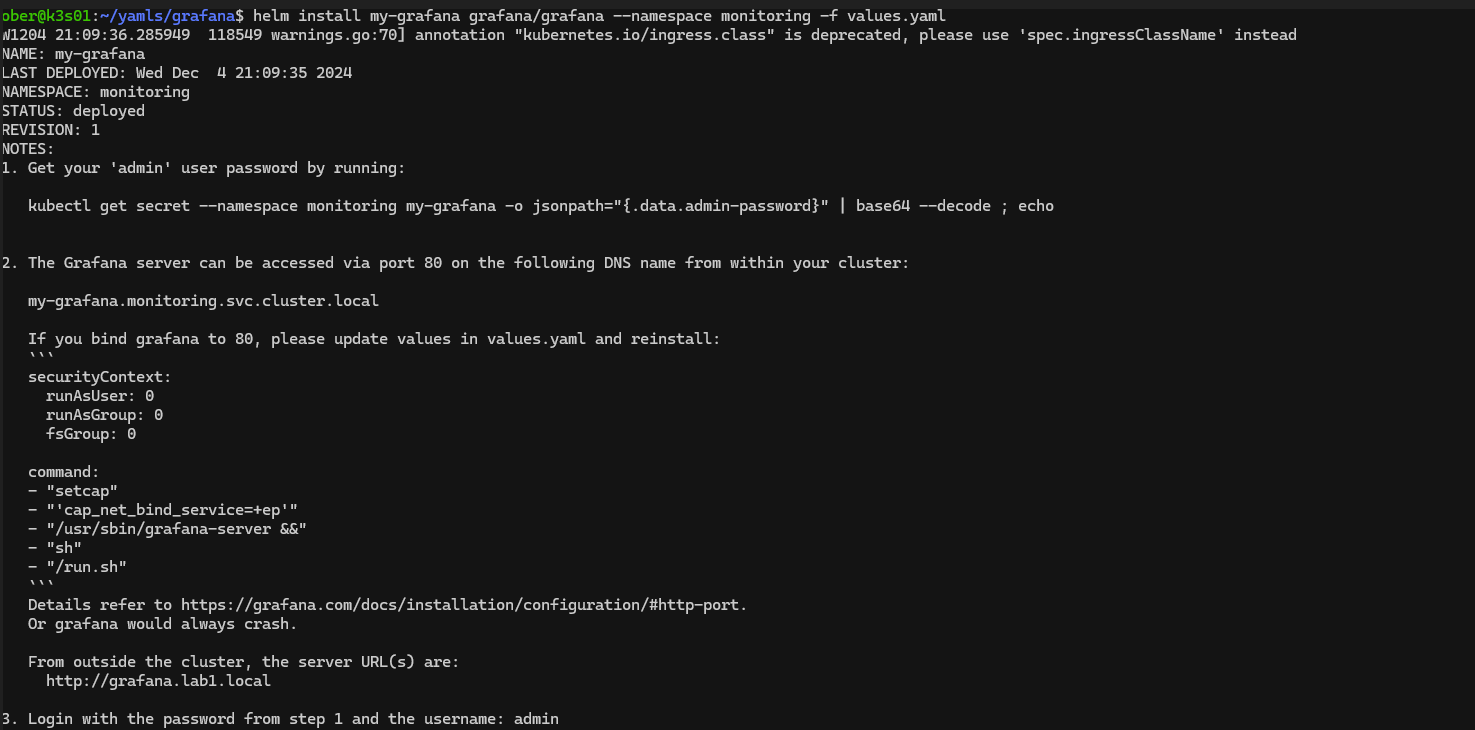
As instructed I need to get the password:
kubectl get secret --namespace monitoring my-grafana -o jsonpath="{.data.admin-password}" | base64 --decode ; echoThat will print out the password which I will copy and head over to my browser and see if the ingress worked:
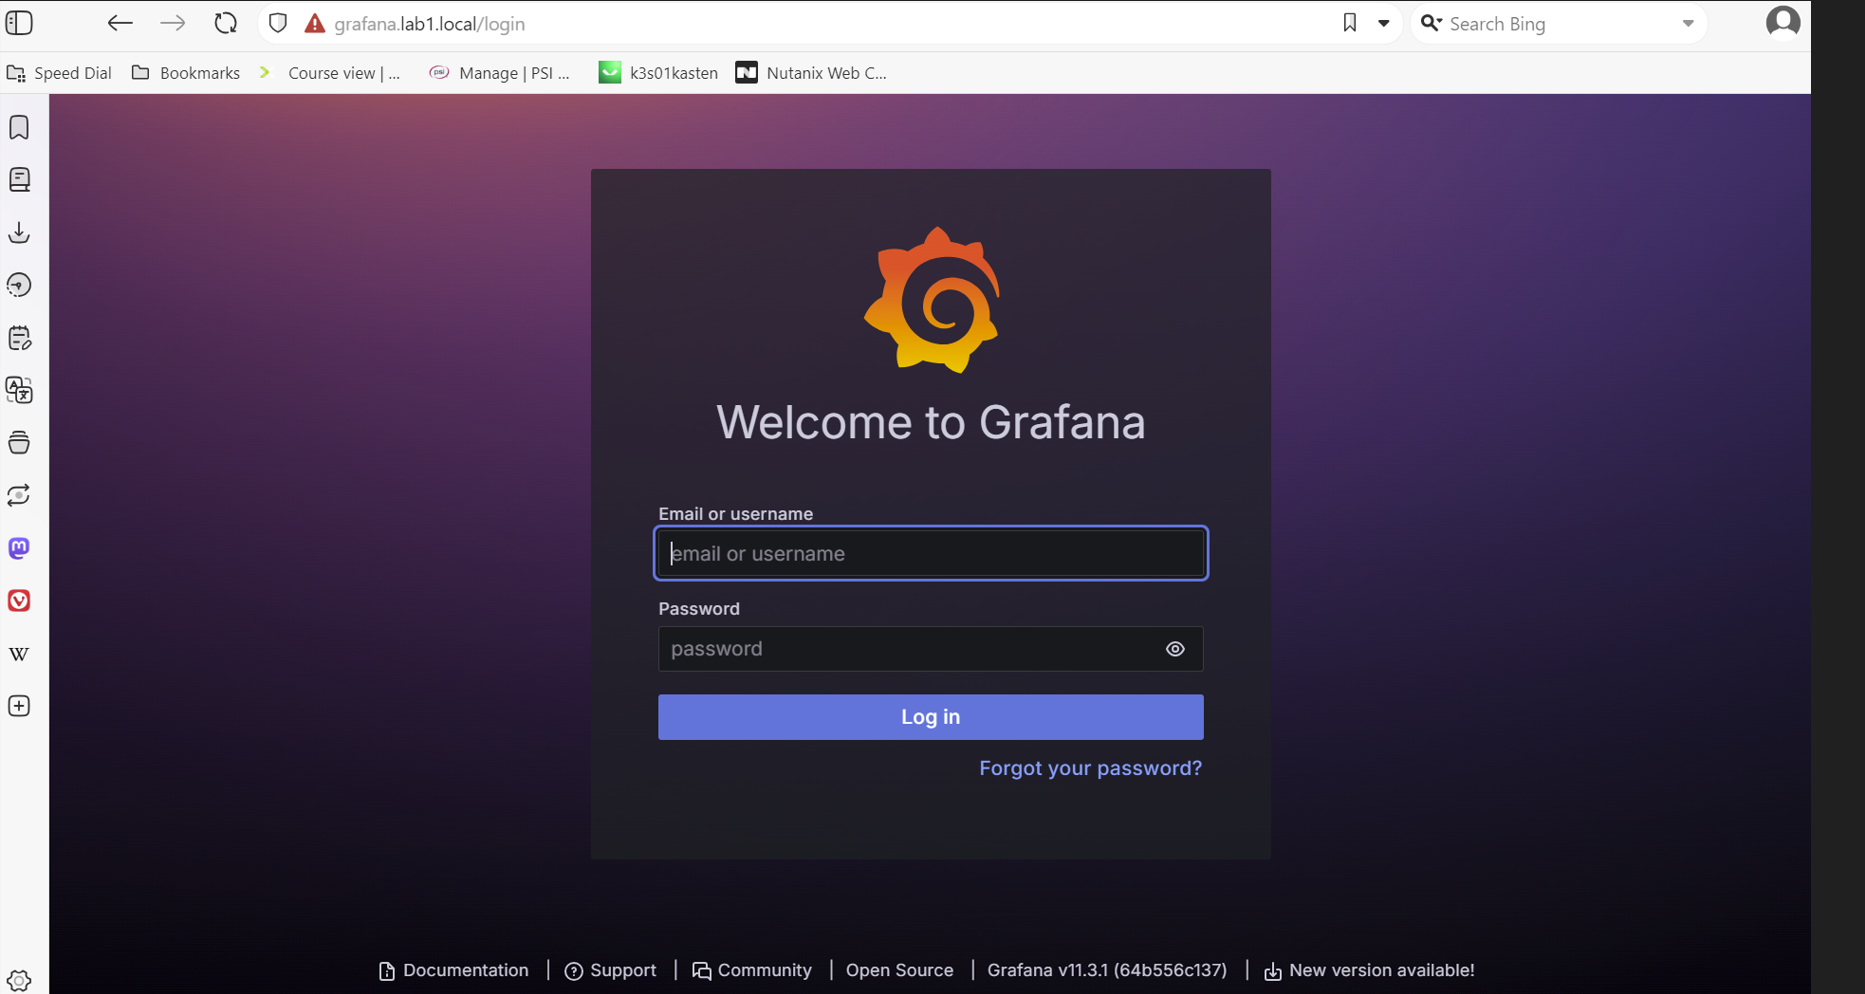
Sweet! Next login and see if the K10 Dashboard was added:
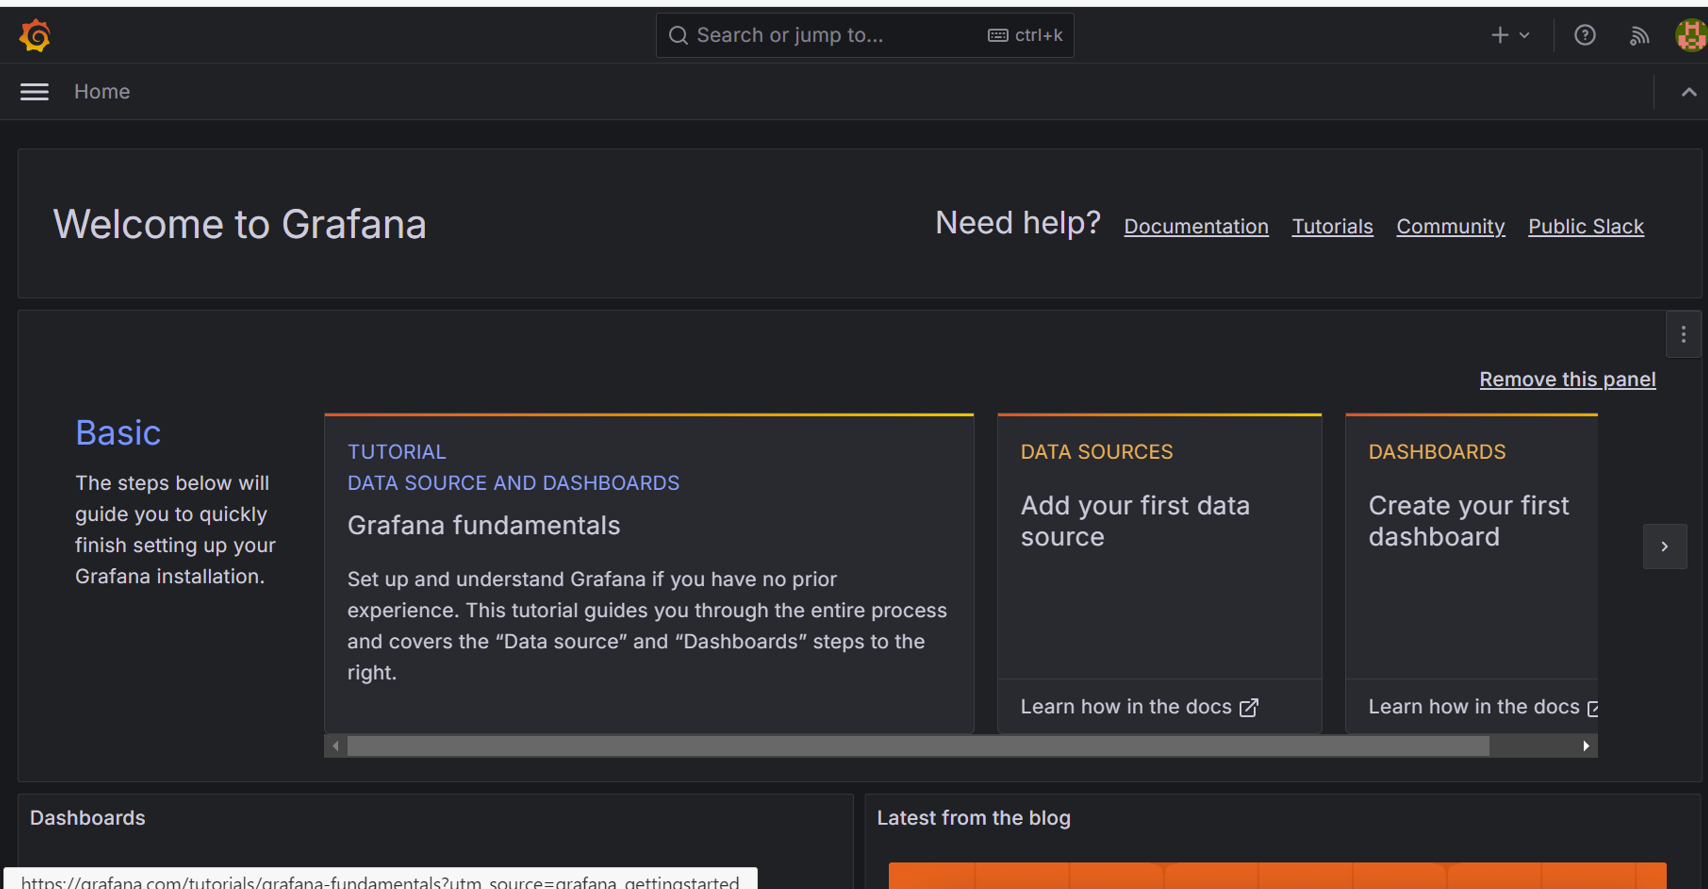
Oh no a failed backup I had better check that later on:
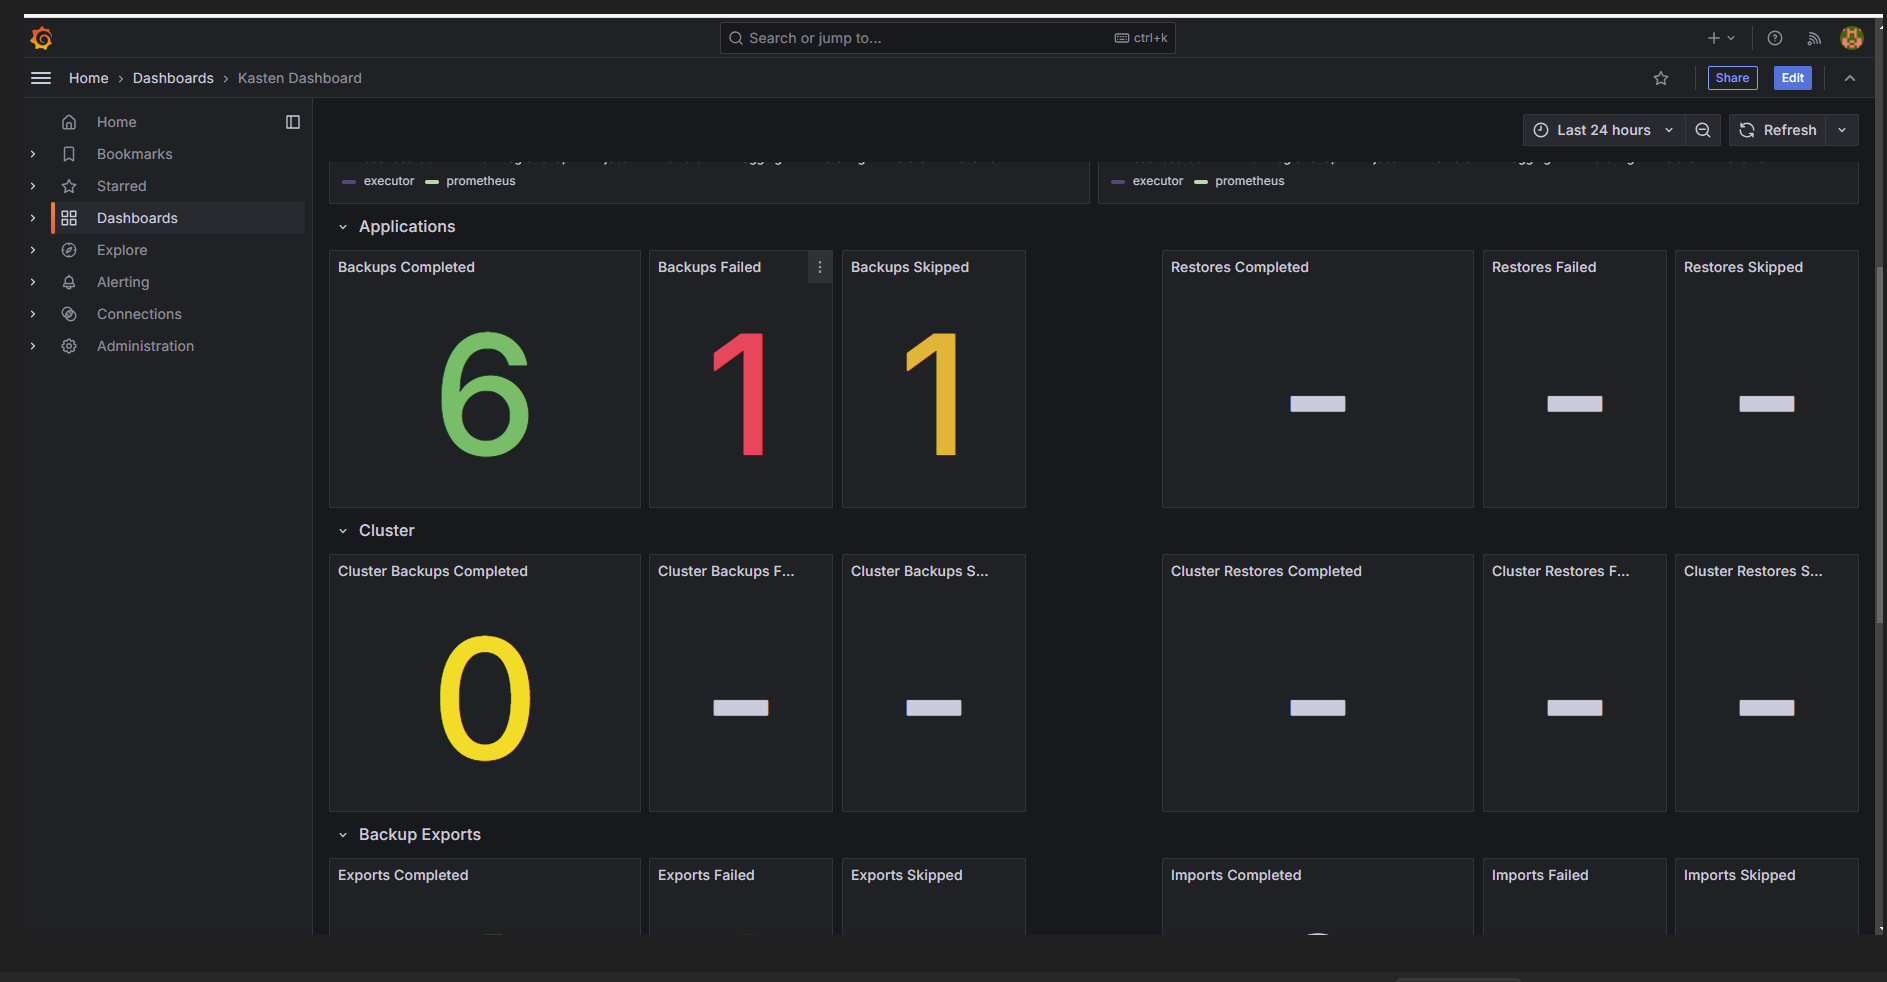
All you can say about these Dashboards is that they are super cool
