Greetings guys, a few months ago I already showed you an incredible, powerful, yet free and open source Grafana Dashboard for your Veeam Backup for AWS.
As you know, Veeam has released Veeam Backup for AWS v4, here you can know more about it, plus take a look at a great video deploying it from scratch, creating policies, etc.
So I have decided to take a look at the new RESTful API endpoints, or to check the ones where updated, and, of course, I have spend the Saturday updating the Grafana Dashboard, introducing Unofficial Grafana Dashboard for Veeam Backup for AWS v3
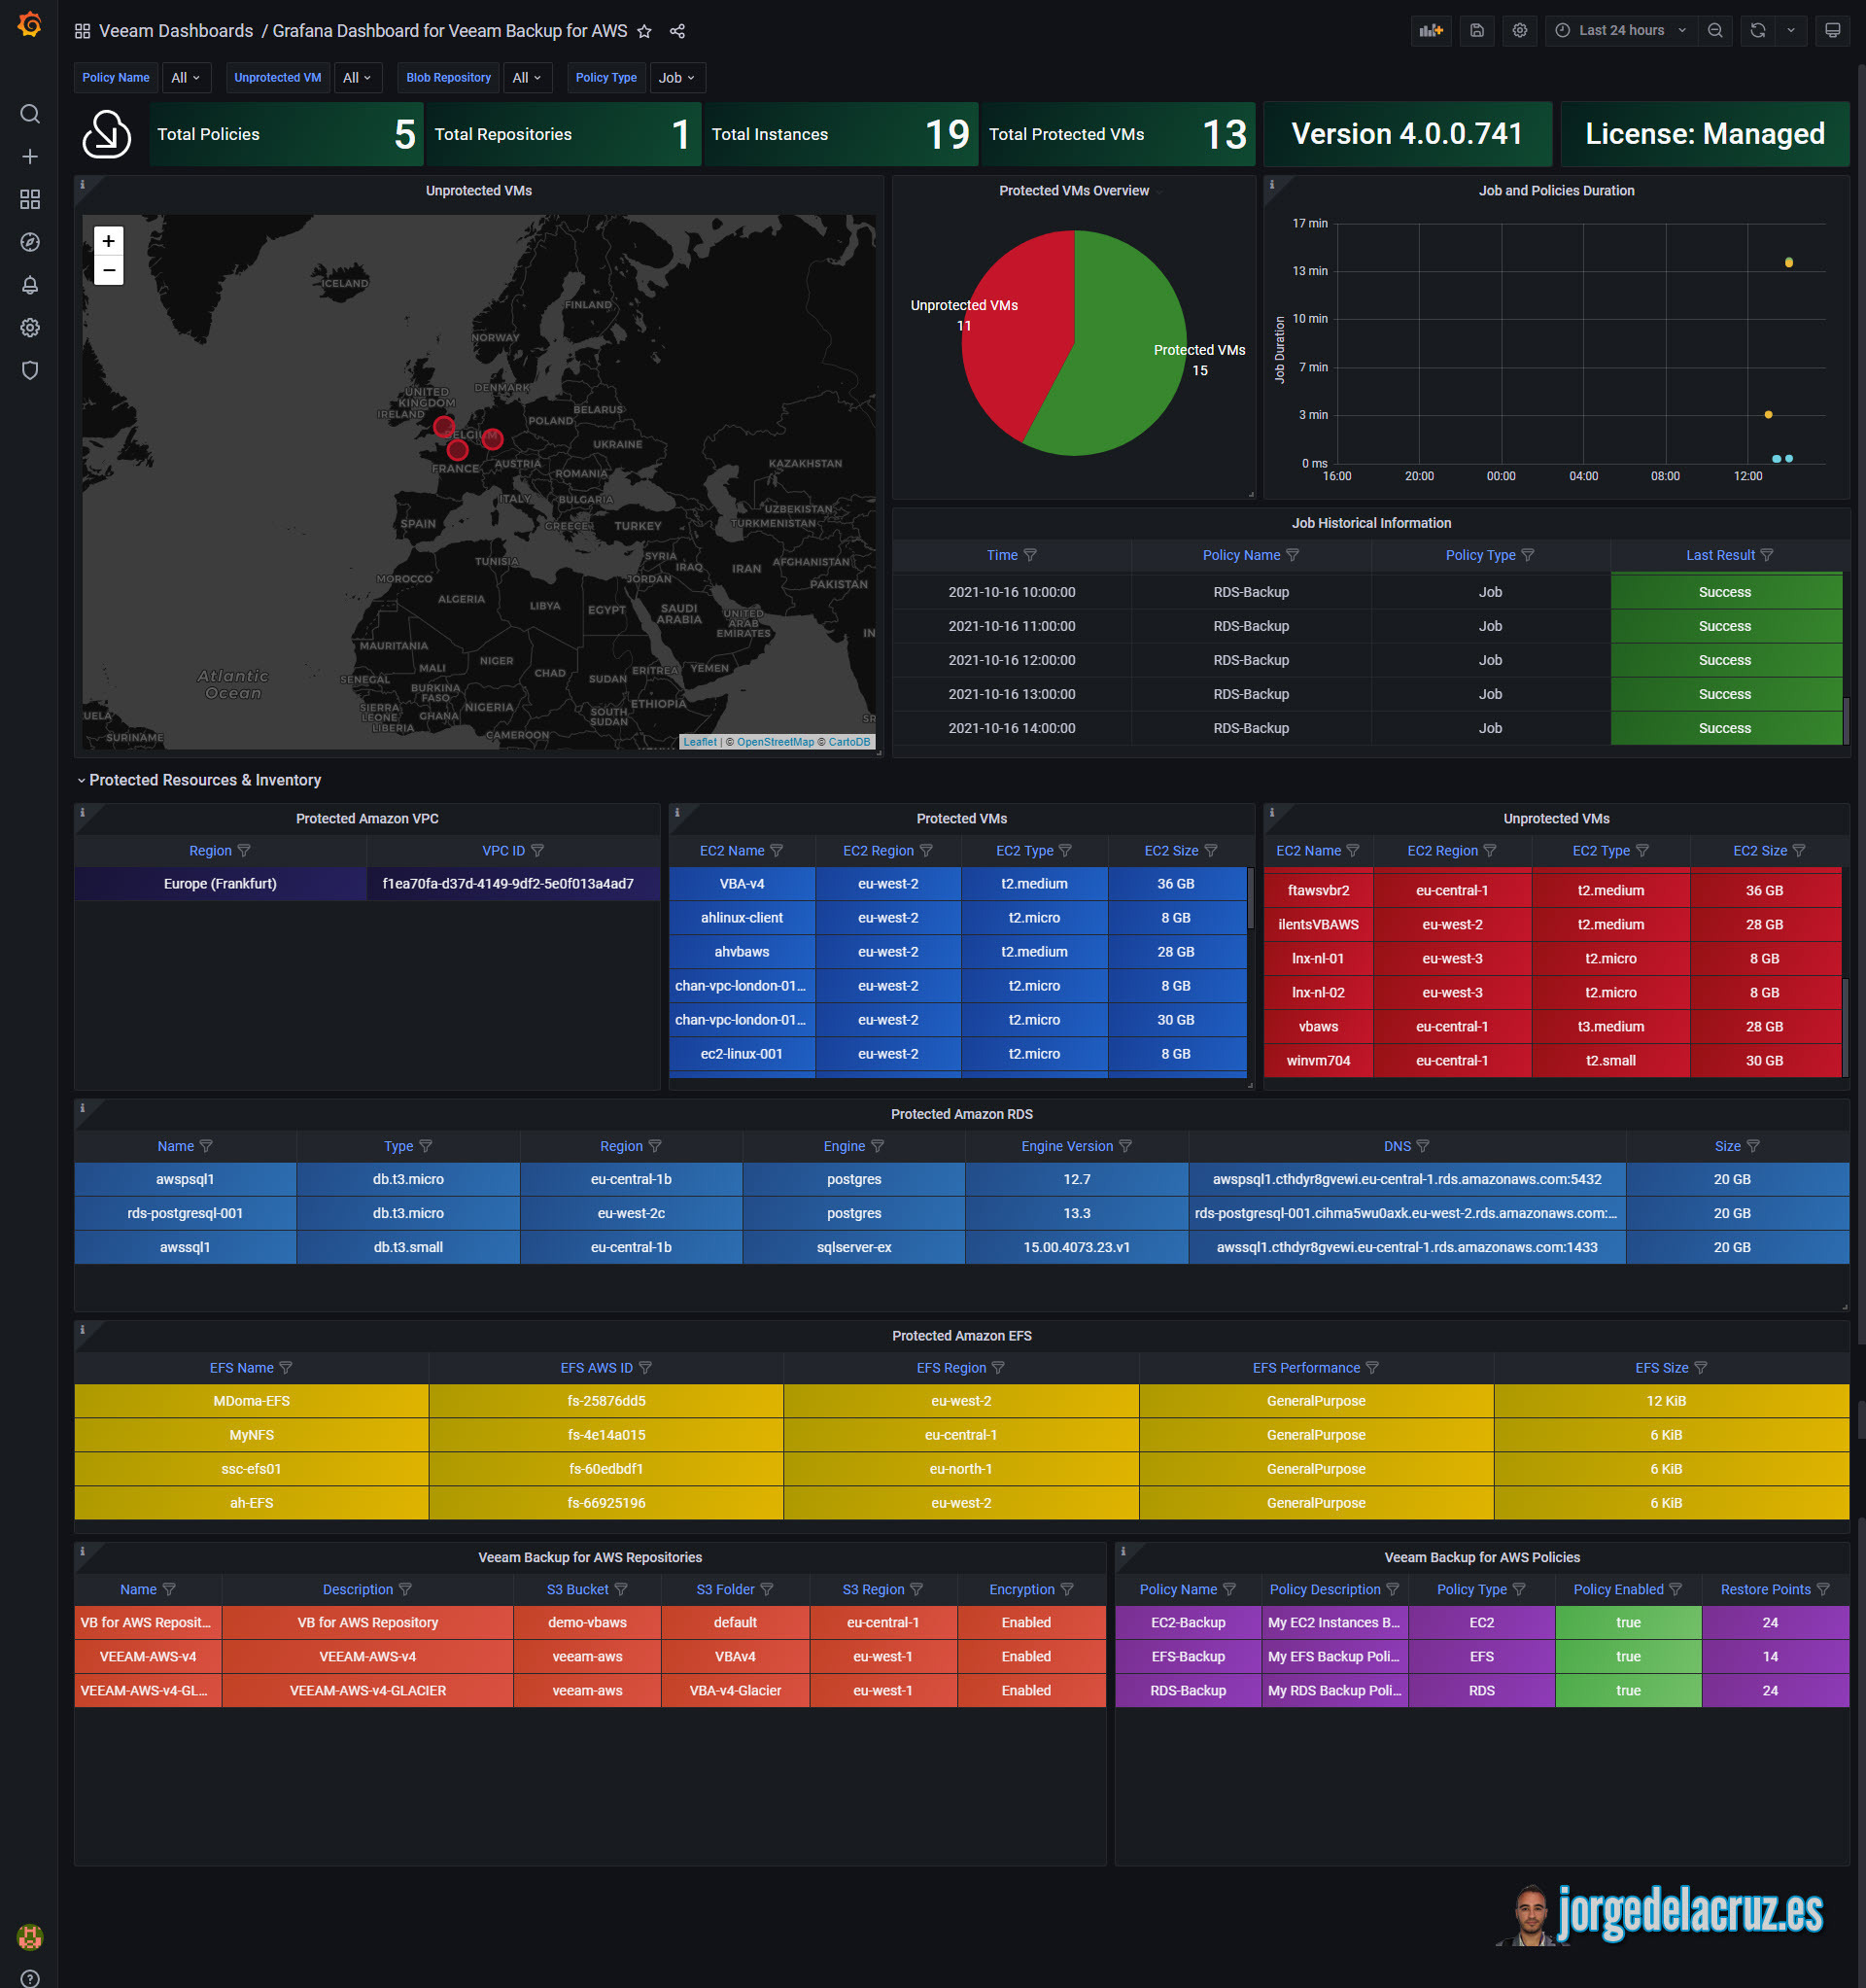
How does the Dashboard look like for VBA AWS v4
After you finish the configuration steps, which you can find on the other Community post linked at the top, you will see something as beautiful and useful like this:

Grafana Dashboard - Summary of features
- Summary - Total number of Repositories, Policies, Protected VMs, VBA Appliance version.
- Unprotected VMs - Both, in one handy list with size, region and name. And with a great visual map to see the unprotected blue regions
- Job History Information - A simple table with the latest jobs and status, also includes whether it is a snapshot or backup job
- Duration of Policies - A simple graph showing duration per job over time
- Protected vs. unprotected VM in a simple pie chart
- Tables with all the components protected, in a very comfortable way to consume, including the new EFS Data Protection.
You can grab all the bits from the VeeamHub - https://github.com/VeeamHub/grafana/tree/master/veeam-backup-aws-grafana
Give it a try on your lab, or environment, and ping me if you need any help. Ideas or comments, are always welcome, this is a Community effort at the end. Cheers!


