

Greetings friends, today I bring you a new entry about Grafana and Veeam, which I'm sure you'll like and I hope you'll put it in your collection. Veeam has recently announced Veeam Backup for AWS v3. Among the many features included in the product, in v3 it is possible to protect RDS and VPC, as well as EC2 instances, of course, one is a public RESTFul API that has been updated to v1.1, and I thought it might be a good idea to create a Dashboard for this solution.
Today, I am pleased to bring you a complete and finished Dashboard for monitoring Veeam Backup for AWS, with no limit of VMs, jobs or Repositories.
You will be able to see that there is a Map inside the Dashboard, and that is because I consider very important to be able to look globally and see what regions we have with unprotected VMs.
Dashboard for Veeam Backup for AWS
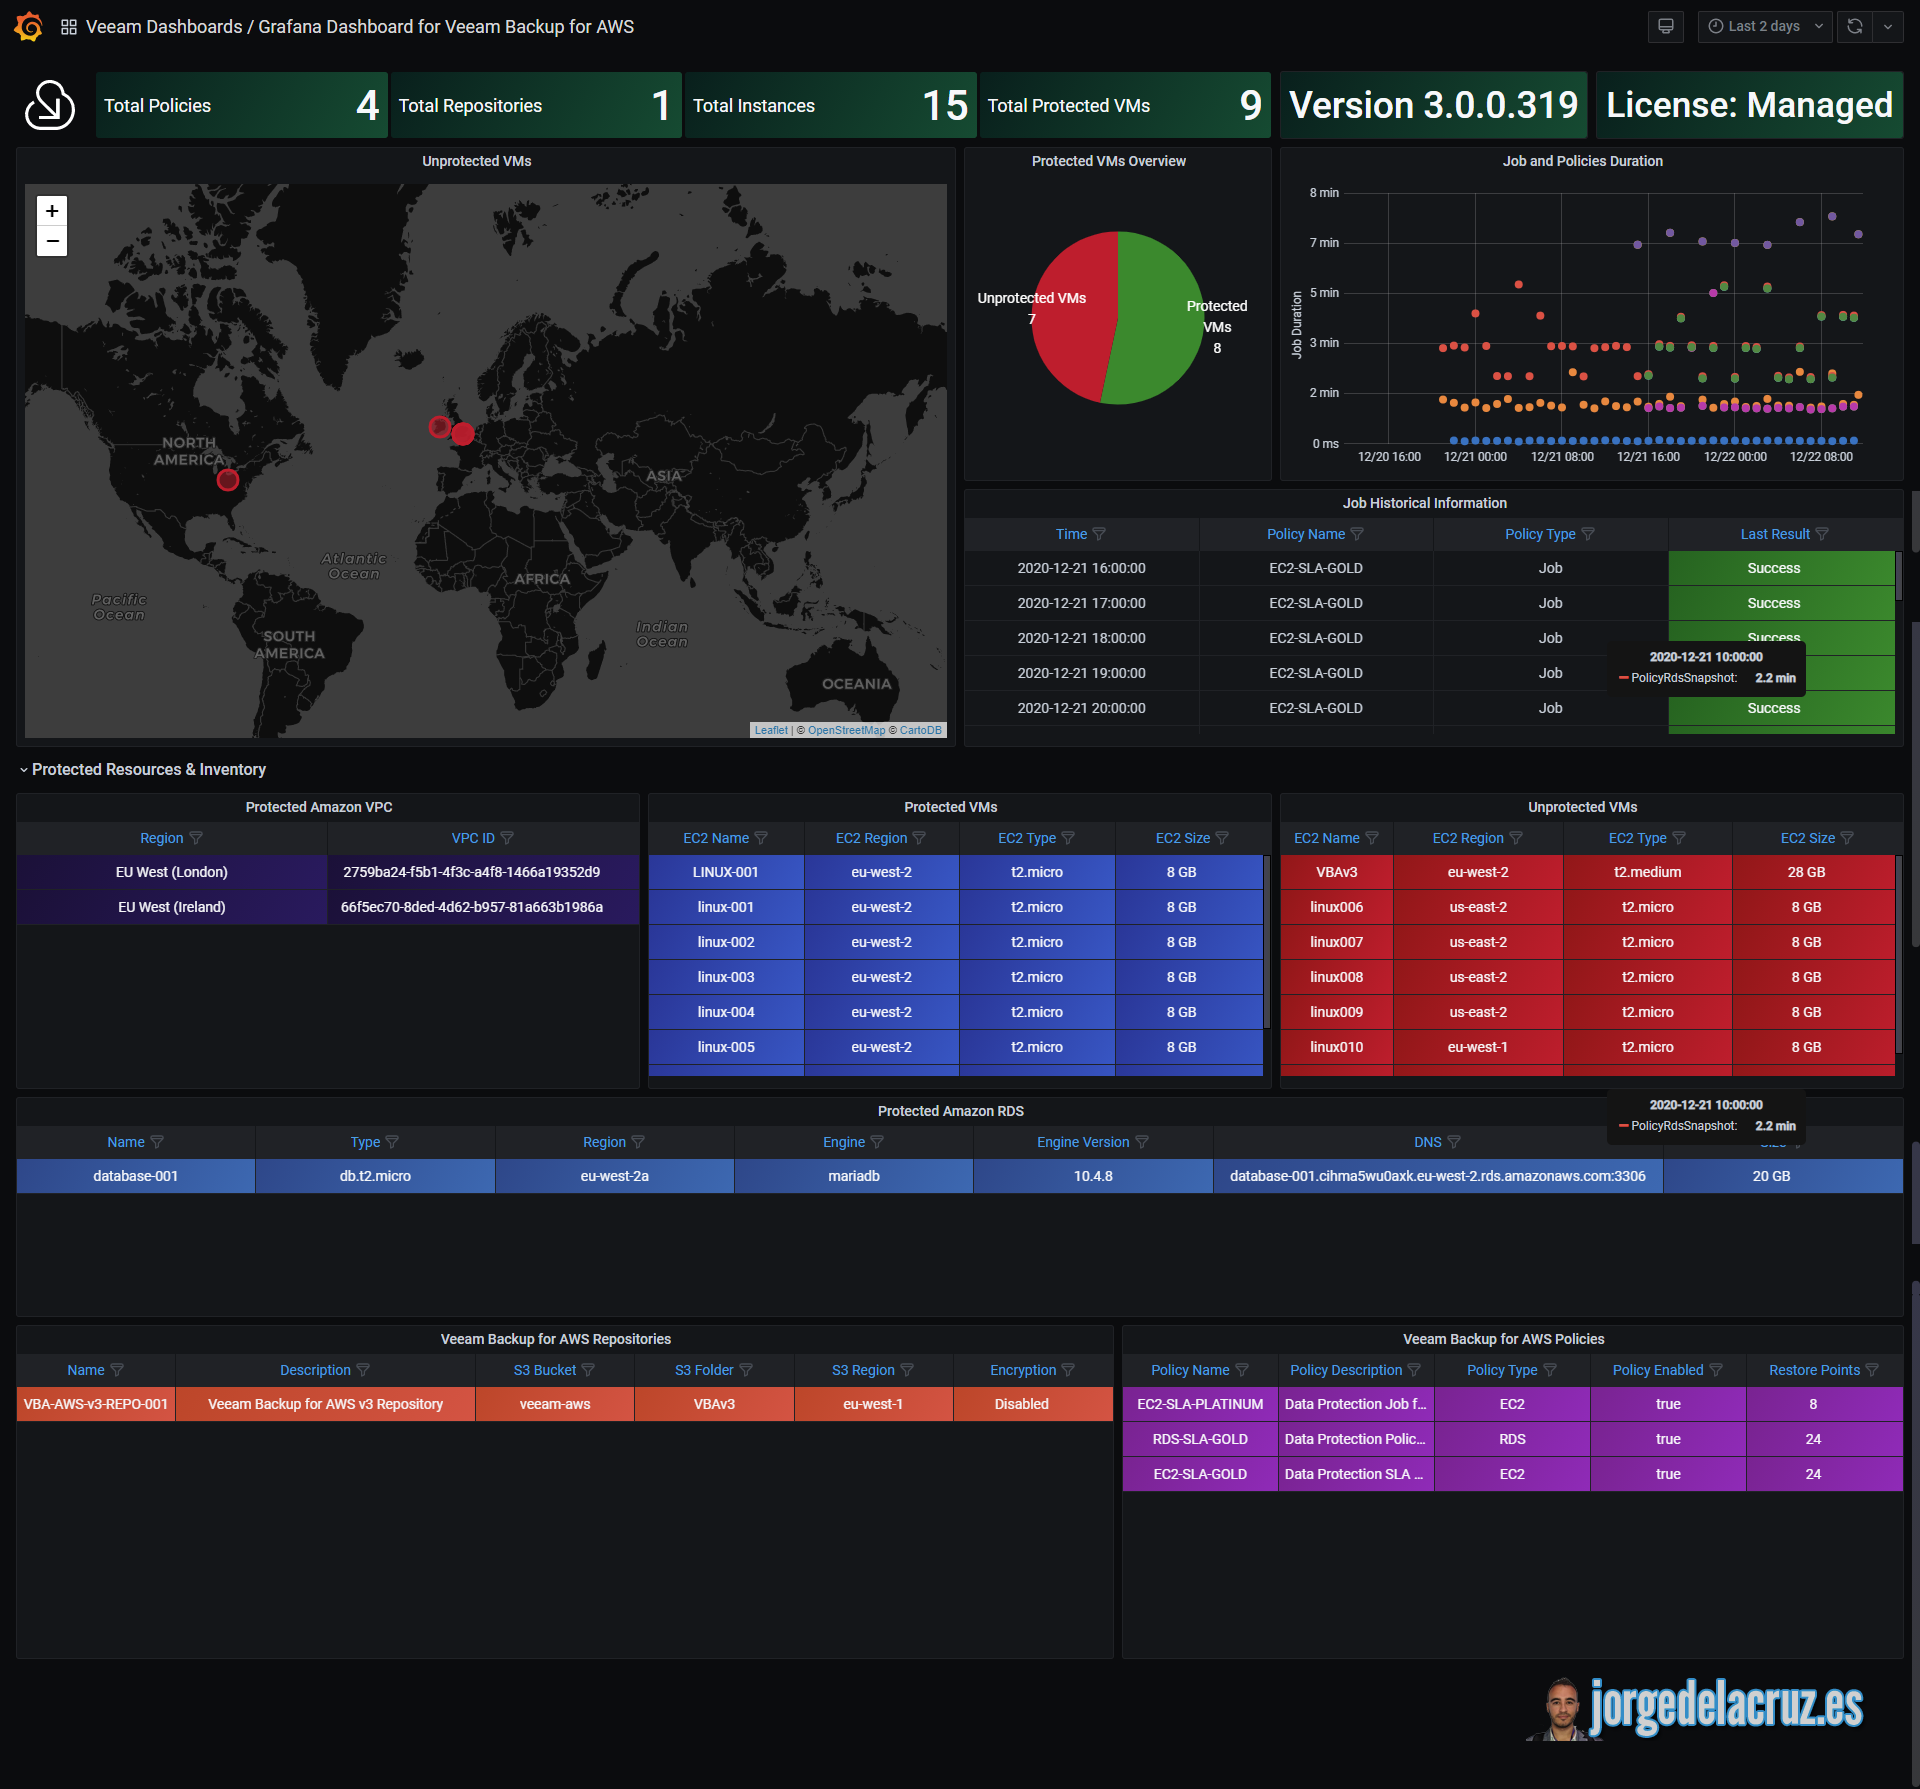
When we finish the entry we will have something similar to that Dashboard that will allow you to visualize:
I leave you a video summary if you want to see a little bit of what's new, it's in English:
Grafana Dashboard - Summary of features
- Summary - Total number of Repositories, Policies, Protected VMs, VBA Appliance version.
- Unprotected VMs - Both, in one handy list with size, region and name. And with a great visual map to see the unprotected blue regions
- Job History Information - A simple table with the latest jobs and status, also includes whether it is a snapshot or backup job
- Duration of Policies - A simple graph showing duration per job over time
- Protected vs. unprotected VM in a simple pie chart
- Tables with all the components protected, in a very comfortable way to consume.
Topology with all the logical components
This entry is a little different from the previous ones since in this case, we will use a combination of telegraph and shell script to collect the Veeam Backup metrics for AWS using RESTful API. The design would look something like this:
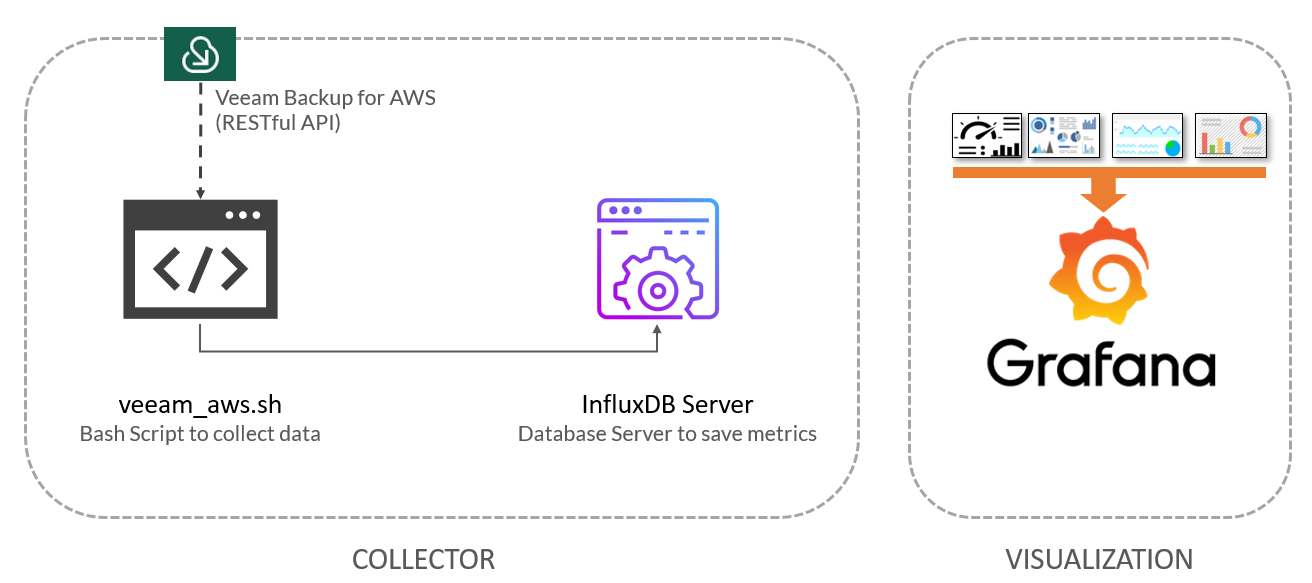
As we can see, the shell script will download the metrics from Veeam Backup for AWS using the RESTful API, which will send all the data to InfluxDB, from where we will be able to view them comfortably with Grafana.
Download, and configure the veeam_aws.sh script
We have almost everything ready, we have one last step, the script that will make all this work, we will download the latest version of the Github repository:
This shell script, can be downloaded and executed from the telegraf server, or influxDB, or any other Linux. We will have to edit the configuration parameters:
# Configurations ## # Endpoint URL for InfluxDB veeamInfluxDBURL="YOURINFLUXSERVER" ##Use https://fqdn or https://IP in case you use SSL veeamInfluxDBPort="8086" #Default Port veeamInfluxDB="YOURINFLUXDB" #Default Database veeamInfluxDBUser="YOURINFLUXUSER" #User for Database veeamInfluxDBPassword="YOURINFLUXPASS" #Password for Database
# Endpoint URL for login action veeamUsername="YOURVEEAMBACKUPUSER" veeamPassword="YOURVEEAMBACKUPPASS" veeamBackupAWSServer="https://YOURVEEAMBACKUPFORAWSIP"" veeamBackupAWSPort="11005" #Default Port
Once the changes are made, make the script executable with chmod:
chmod +x veeam_aws.sh
Execute it, and the output of the command should look something like the following, without errors
HTTP/1.1 204 No Content Content-Type: application/json Request-Id: 8f69ce88-444b-11eb-a3a2-0050569017a8 X-Influxdb-Build: OSS X-Influxdb-Version: 1.8.3 X-Request-Id: 8f69ce88-444b-11eb-a3a2-0050569017a8 Date: Tue, 22 Dec 2020 11:48:08 GMT
If so, please add this script to your crontab now, such as every 30 minutes:
*/30 * * * * /home/oper/veeam_aws.sh >> /var/log/veeamaws.log 2>&1
We are ready to go to the next step.
Grafana Dashboards
I created a Dashboard from scratch by selecting the best applications to the database, finishing the colors, thinking about the graphics and how to display them, and everything is automated to fit our environment without any problem and without having to edit anything manually. The Dashboard can be found here, once imported, you can use the top drop-down menus to select between policies, EC2, repositories, etc.:
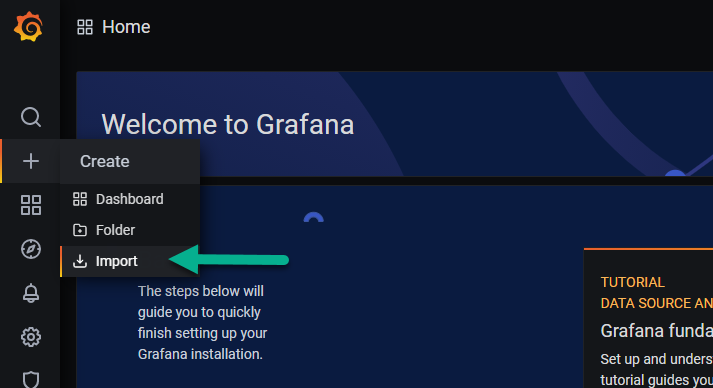
Import the Grafana Dashboard in a simple way
So you don't have to waste hours configuring a new Dashboard, and ingesting and debugging what you want, I have already created a wonderful Dashboard with everything you need to monitor our environment in a very simple way, it will look like the image I showed you above. Select the name you want and enter the ID: 13627, which is the unique ID of the Dashboard, or the URL:
With the menus on the top, we will be able to move between some options:

Please leave your comments here, or on GitHub. Thank you very much for reading!


