For ease of administration, I will use Portainer a lightweight Docker Container management solution to administer my Docker environment instead of using the Container Manager on Synology.
To proceed with this task, we have to first install the Container Manager on Synology. Launch the Package Center on your Synology NAS, and search for Container Manager. You will have to install it as shown below.
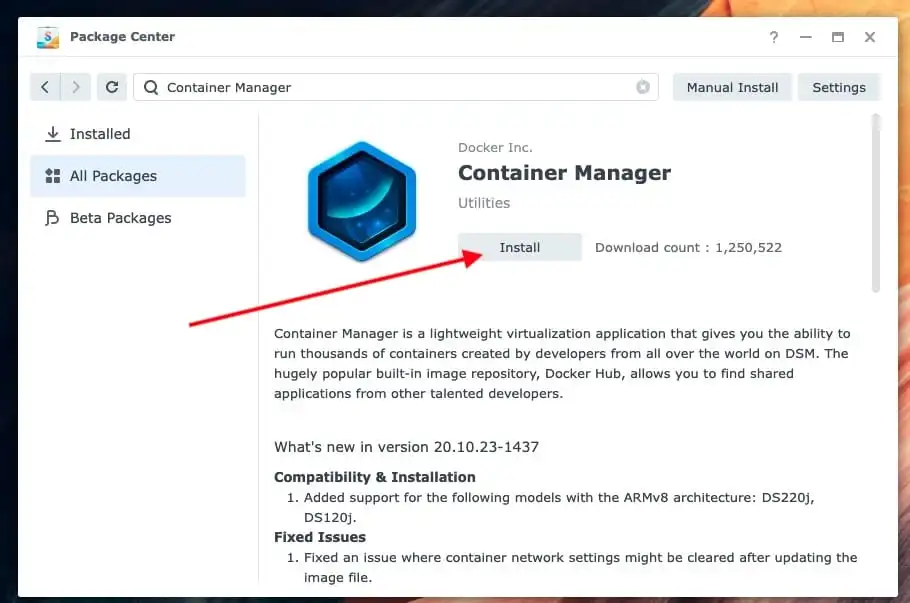
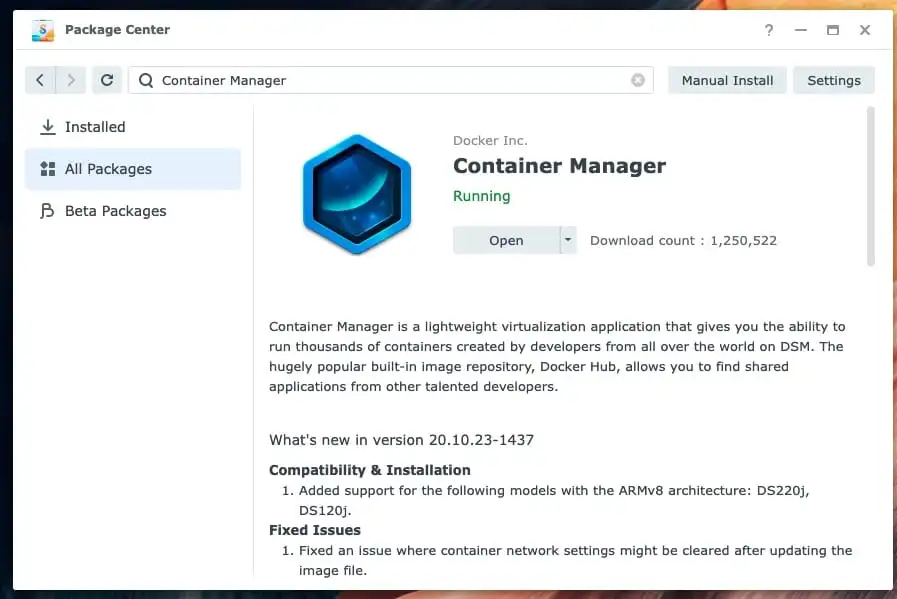
Note: When Installed, you can also open it and navigate to the Image tab, select the Prometheus image and click Launch. You will also have to do the same for Grafana. But as I said above, we will be using Portainer as it simplifies Docker management.
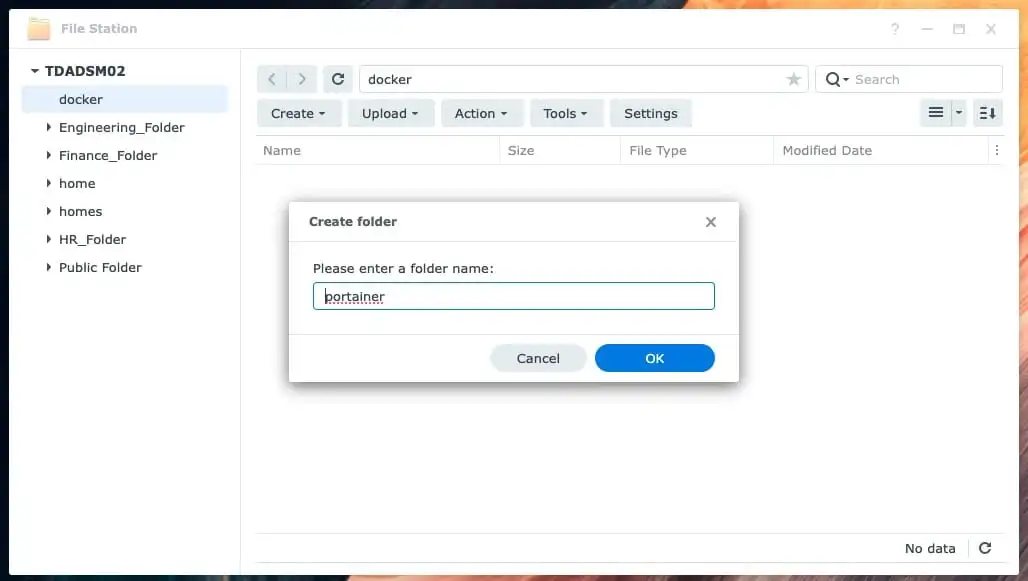
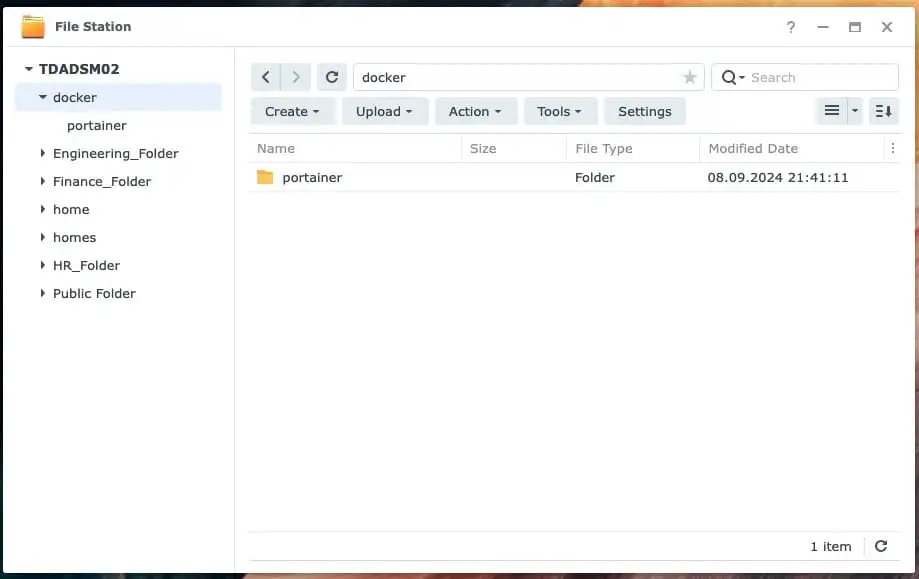
Next, we will have to create a folder for Portainer. Under the Docker Folder, we will create a directory that will be used to store the configuration and data for Persistent Storage. Here are some guides on how to manage User Permission on Synology with Active Directory [Part 1], and how to configure Synology DS923+ NAS for File Sharing [Part 2].
Install Portainer
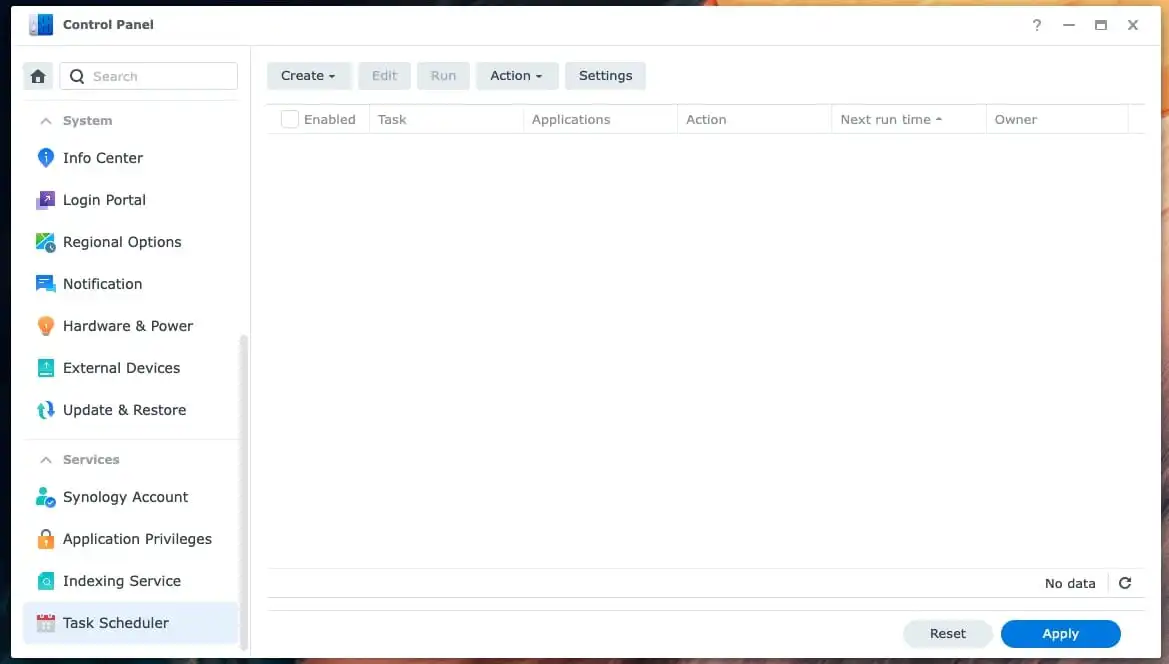
This step involves installing Portainer via the “Task Scheduler” via a custom script. Open Control Panel and navigate to the Task Scheduler.
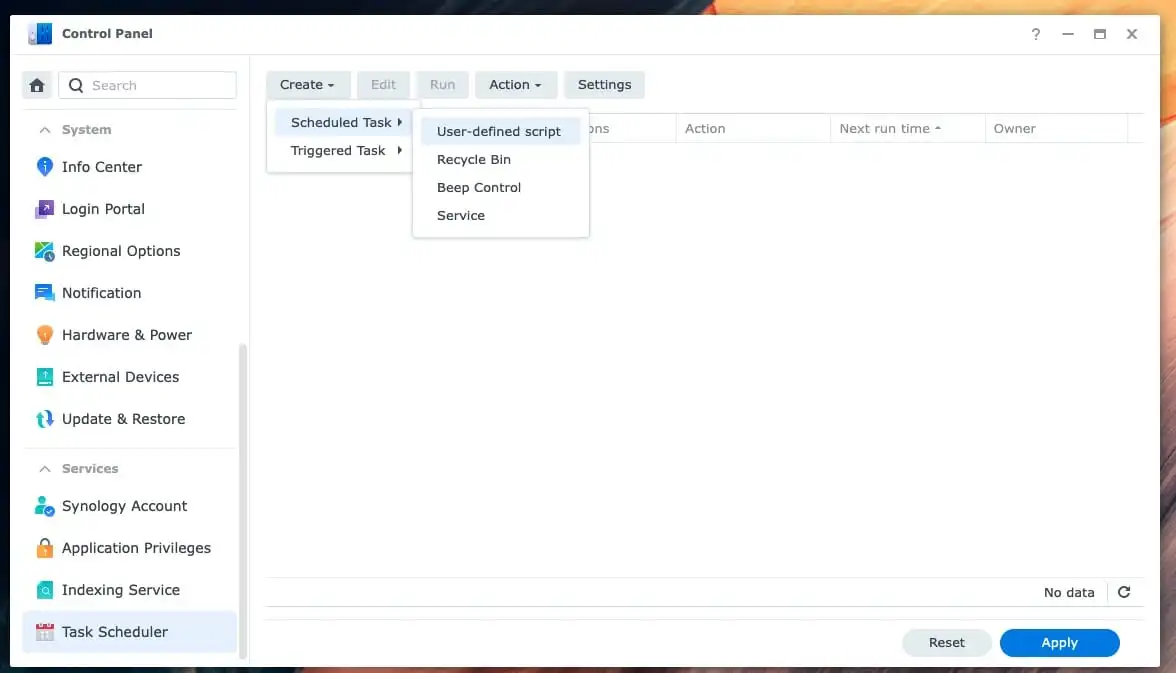
Create and select Scheduled Task and then on “User-defined script“.
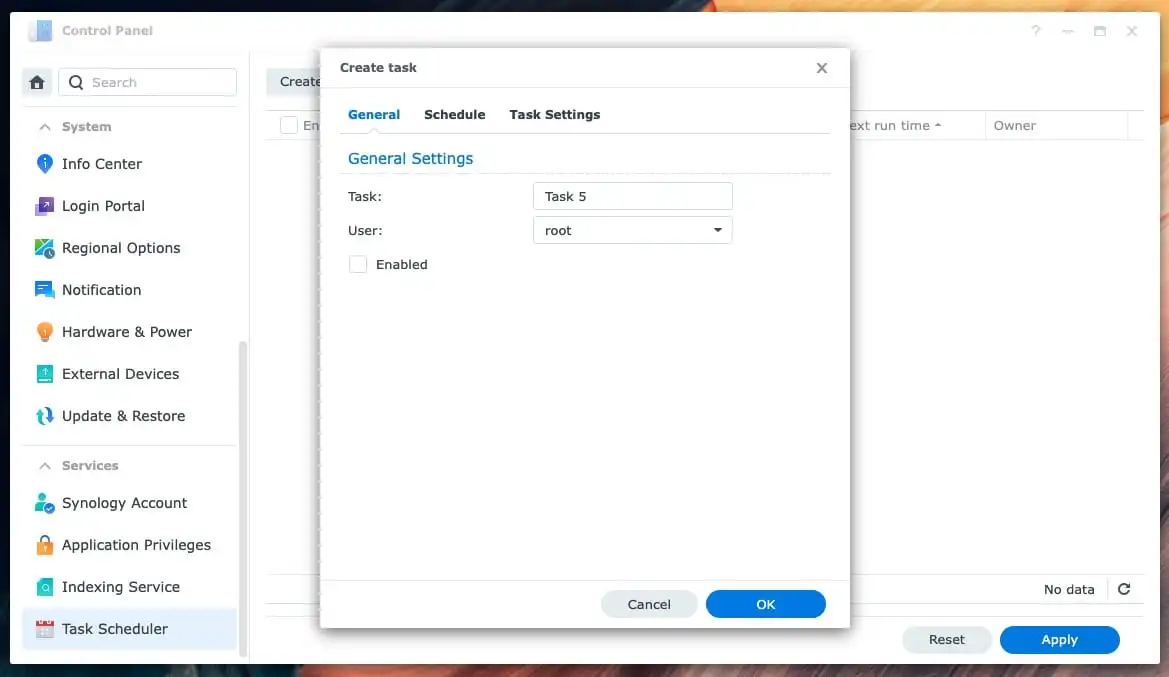
Under General, ensure the User is set to root and uncheck the “Enabled” option
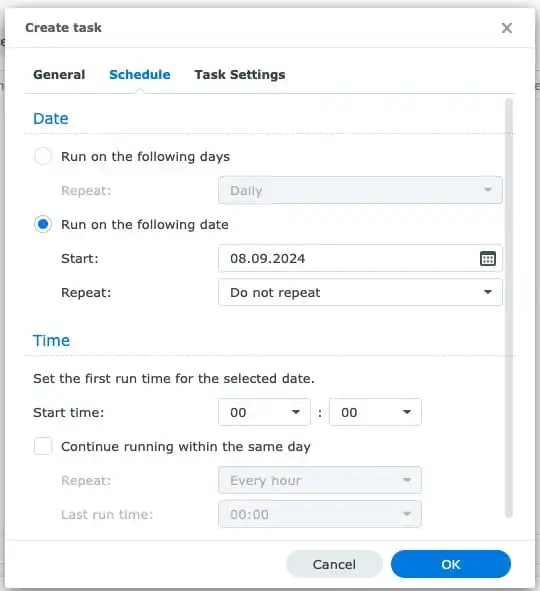
Under schedule, select Run on the following date then select “Do not repeat“.
On the task settings tab, check “Send run details by email“, and enter your email. Below is an alternative script that you can utilise. and click on Ok
#!/bin/bash
# from Christian TechDirectArchive
# Pull the latest Portainer image
docker pull portainer/portainer-ce:latest
# Create Portainer container and bind it to port 9000
docker run -d \
  --name=portainer \
  --restart=always \
  -p 8000:8000 \
  -p 9000:9000 \
  -v /var/run/docker.sock:/var/run/docker.sock \
  -v portainer_data:/data \
  portainer/portainer-ce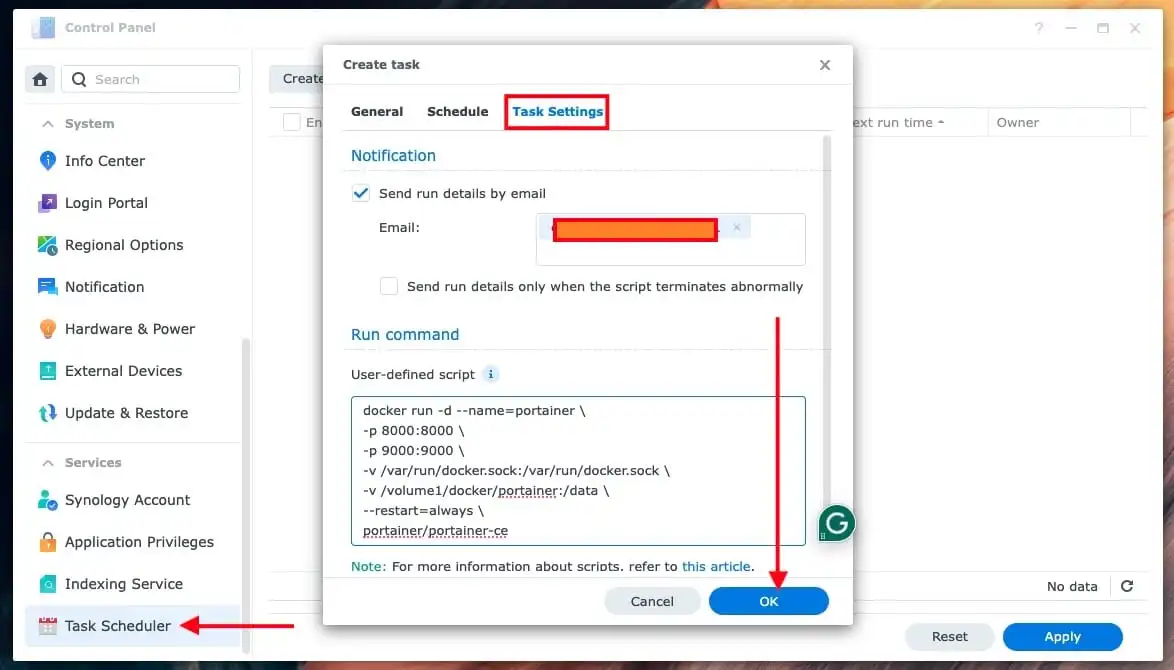
Click on OK again
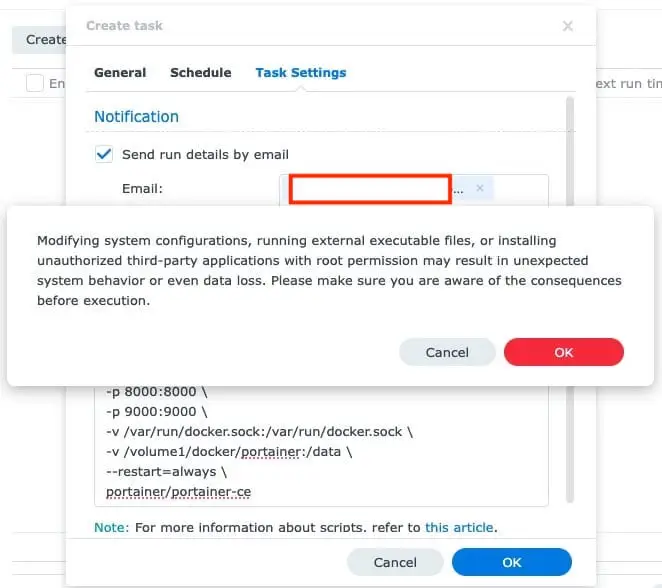
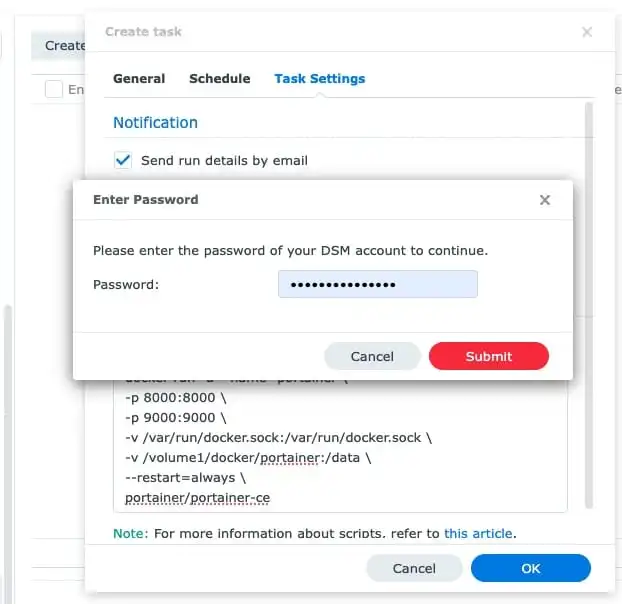
Enter your password
On the “Run Task” wizard, click on OK.
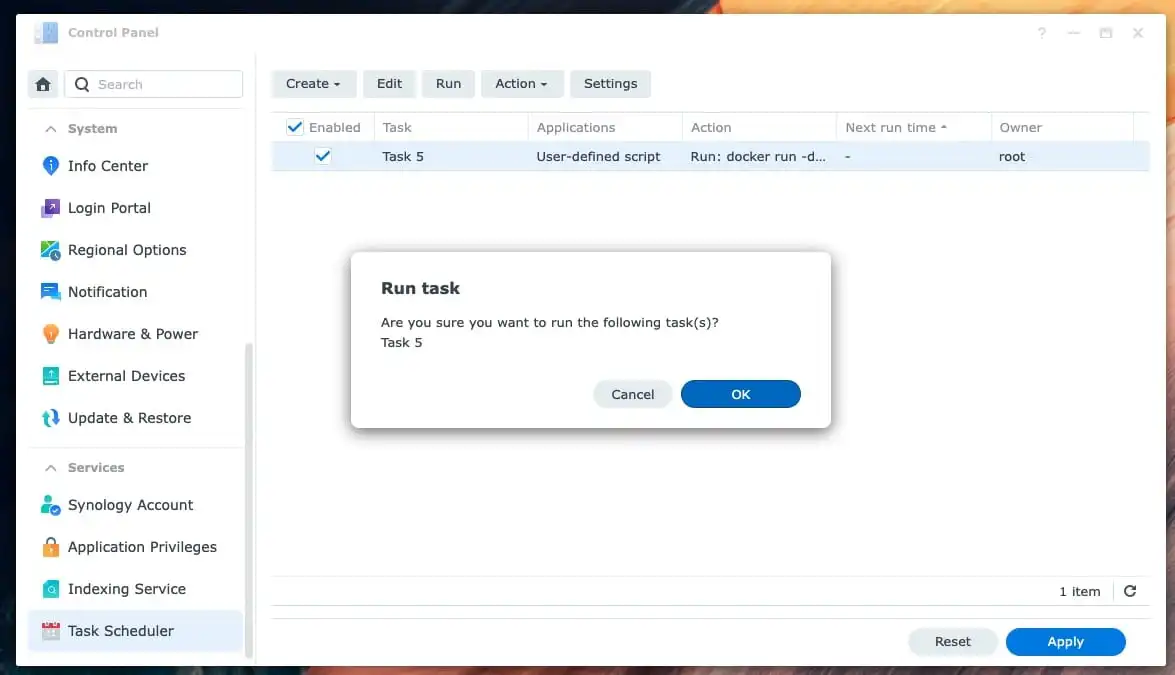
Shortly, the script will run on time as defined
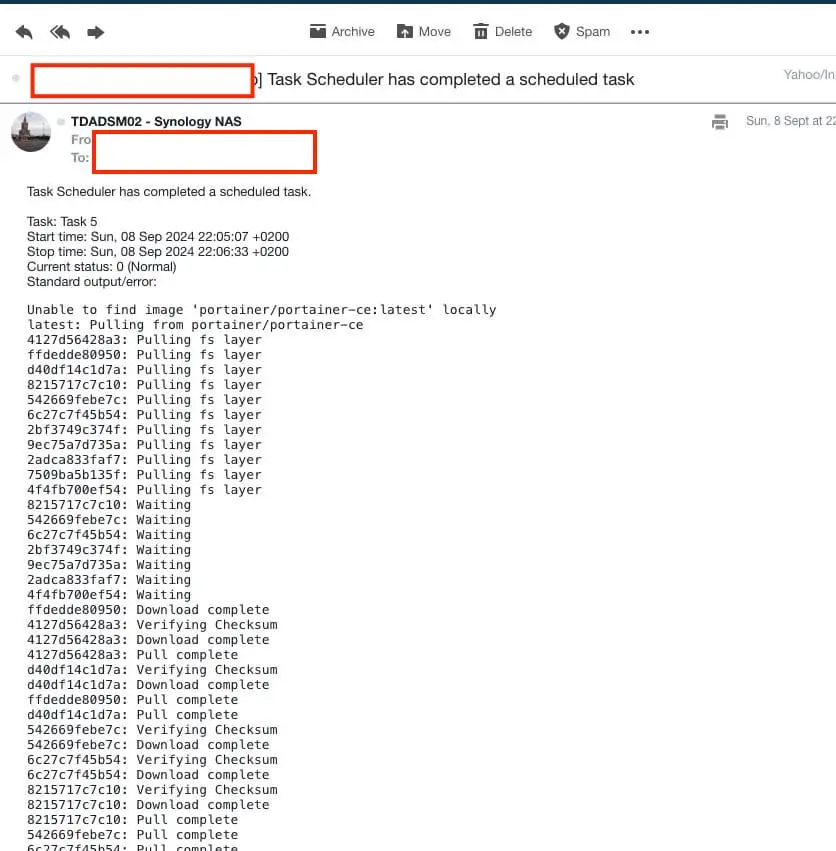
Launch the web-browser by typing
http://<synology-IP-address>:9000. The administrator account must be created (performed) within (5) minutes.
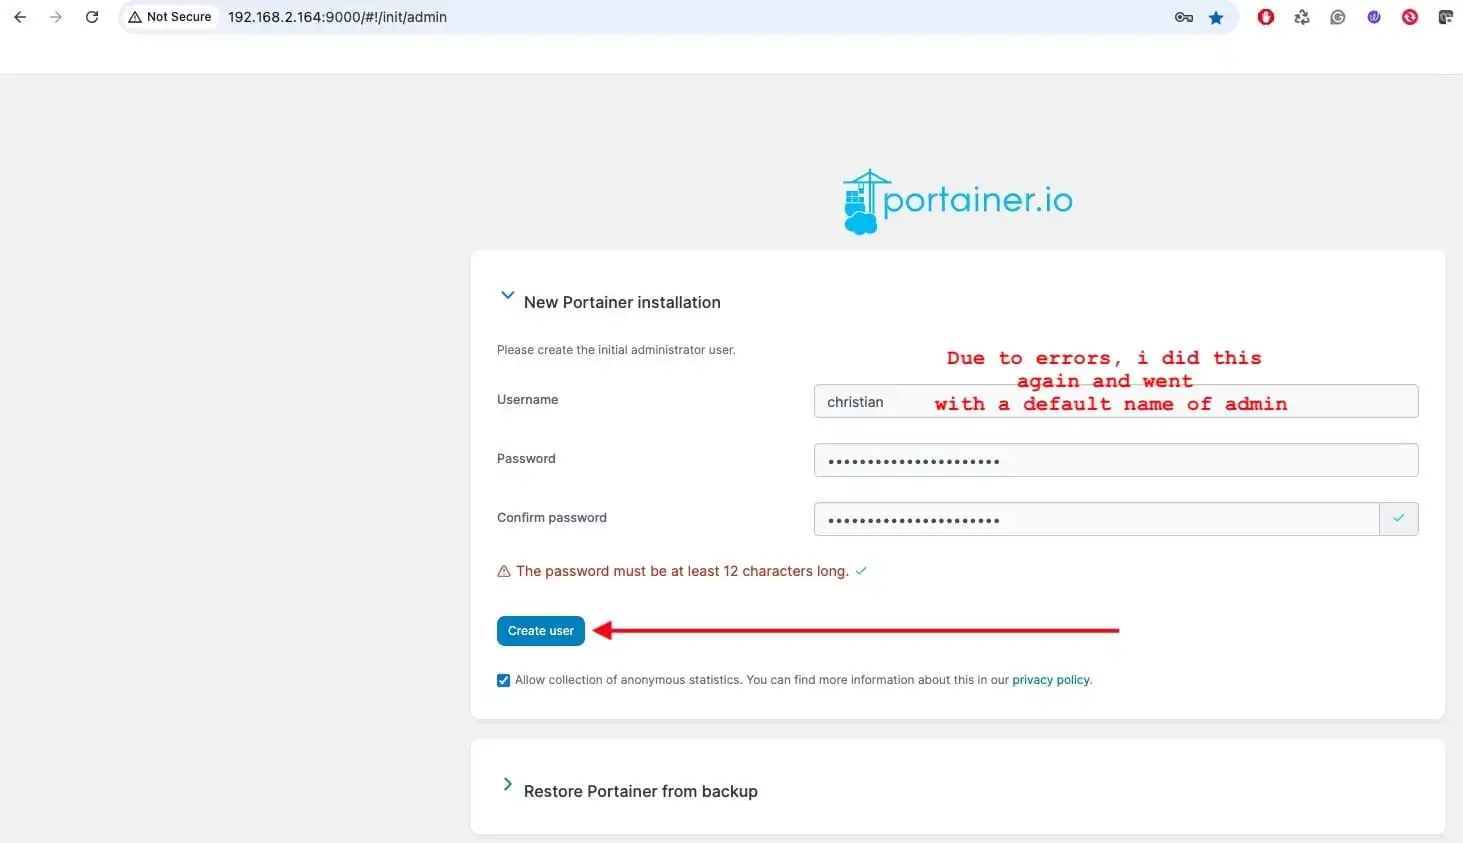
If you run into issues at this step, please take a look at the original blog post for the detailed steps and how to resolve this issue “Docker Setup: Monitoring Synology with Prometheus and Grafana”
Next, update Portainer environments by clicking on “Get Started with the local environment Portainer is running on”.
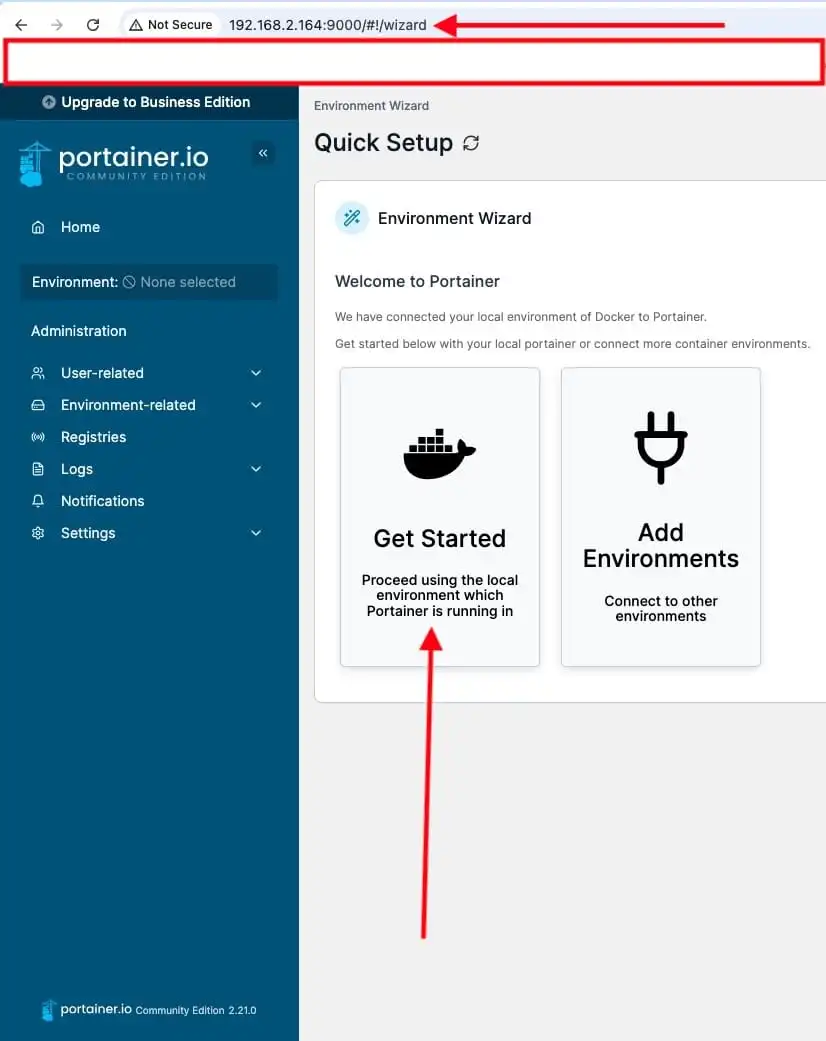
Edit the environment and enter the IP of your Synology NAS and save


Next, you will have to add some registries. These are external sources where Docker images are stored such as Docker Hub or private container image registries. In a nutshell, a registry is a repository where Docker images are hosted thereby allowing Portainer to pull images for container deployment. You can add custom or private registries, including Docker Trusted Registry (DTR) or other third-party container registries (e.g., Quay.io, AWS ECR, Google Container Registry)
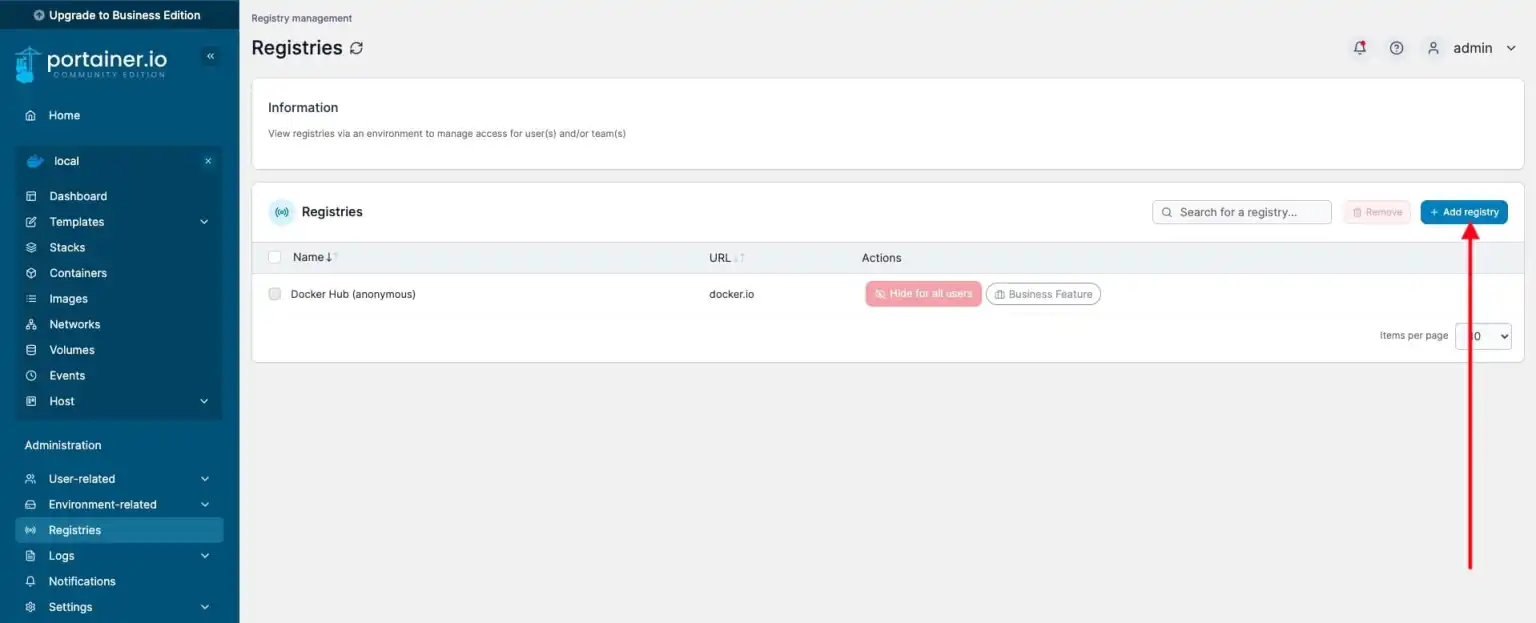
Click on Registry from the Portainer dashboard
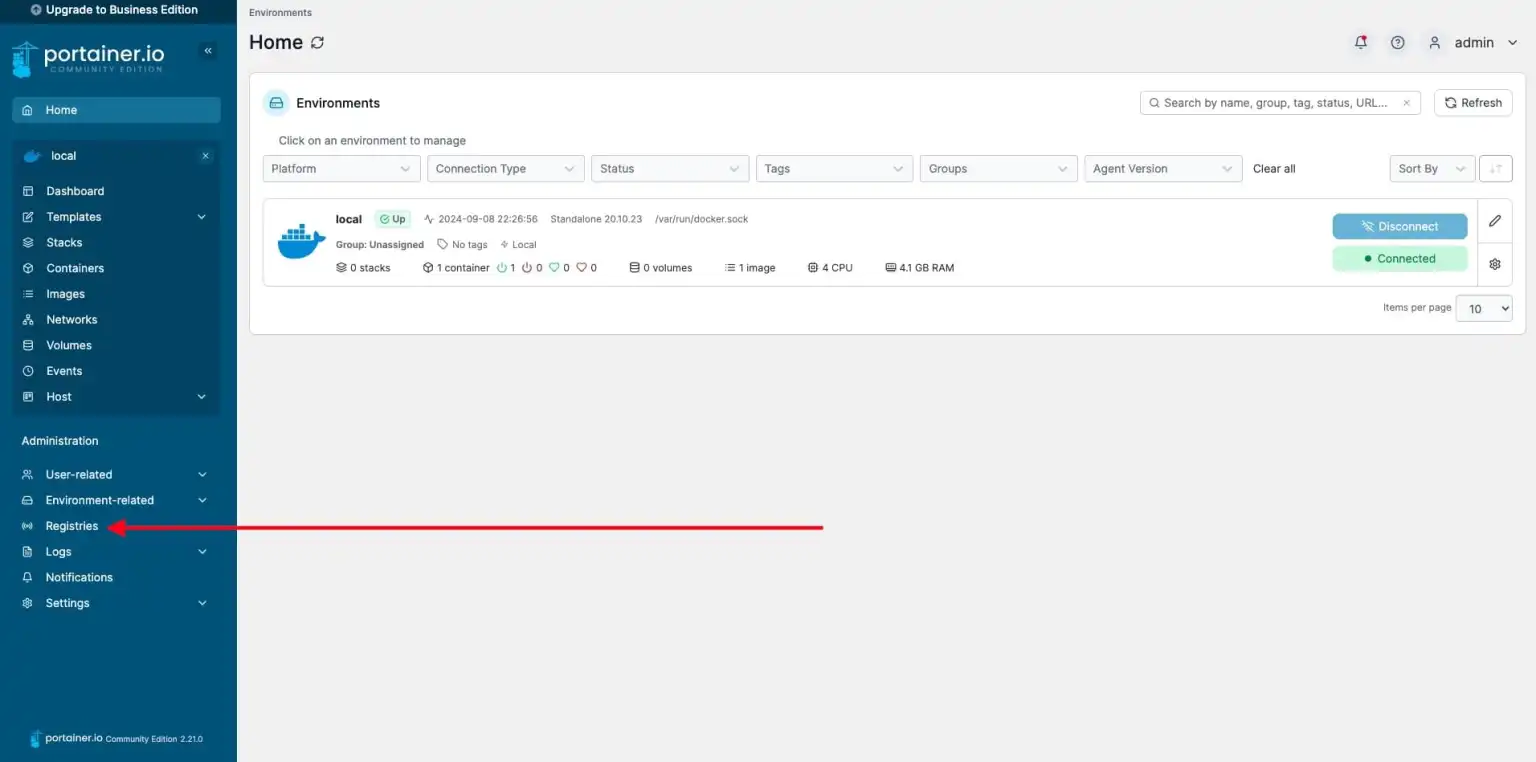
Click + Add registry
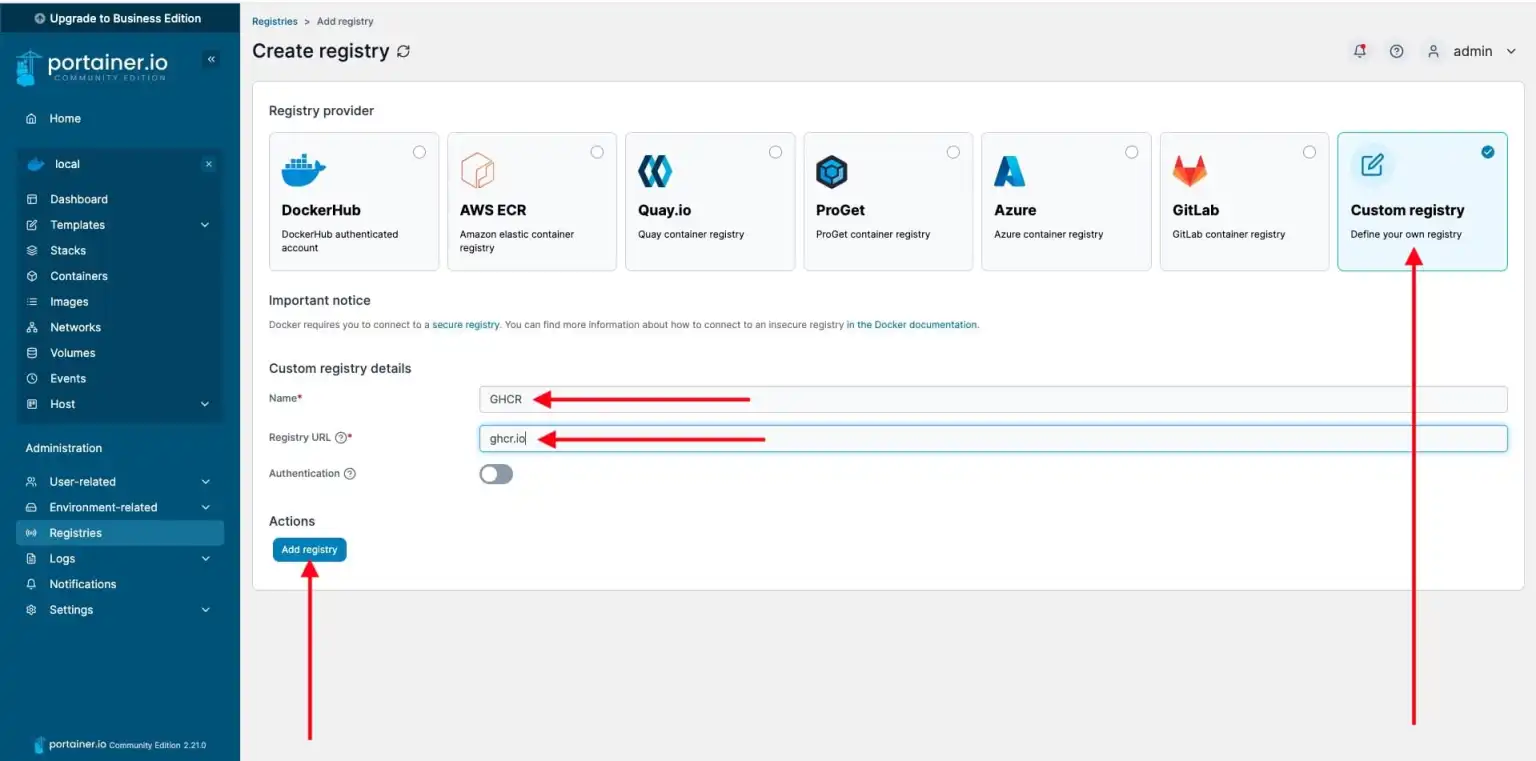
Select Custome registry and in the Name field area type in GHCR and in the Registry URL area type in ghcr.io and then click Add registry to save the settings.
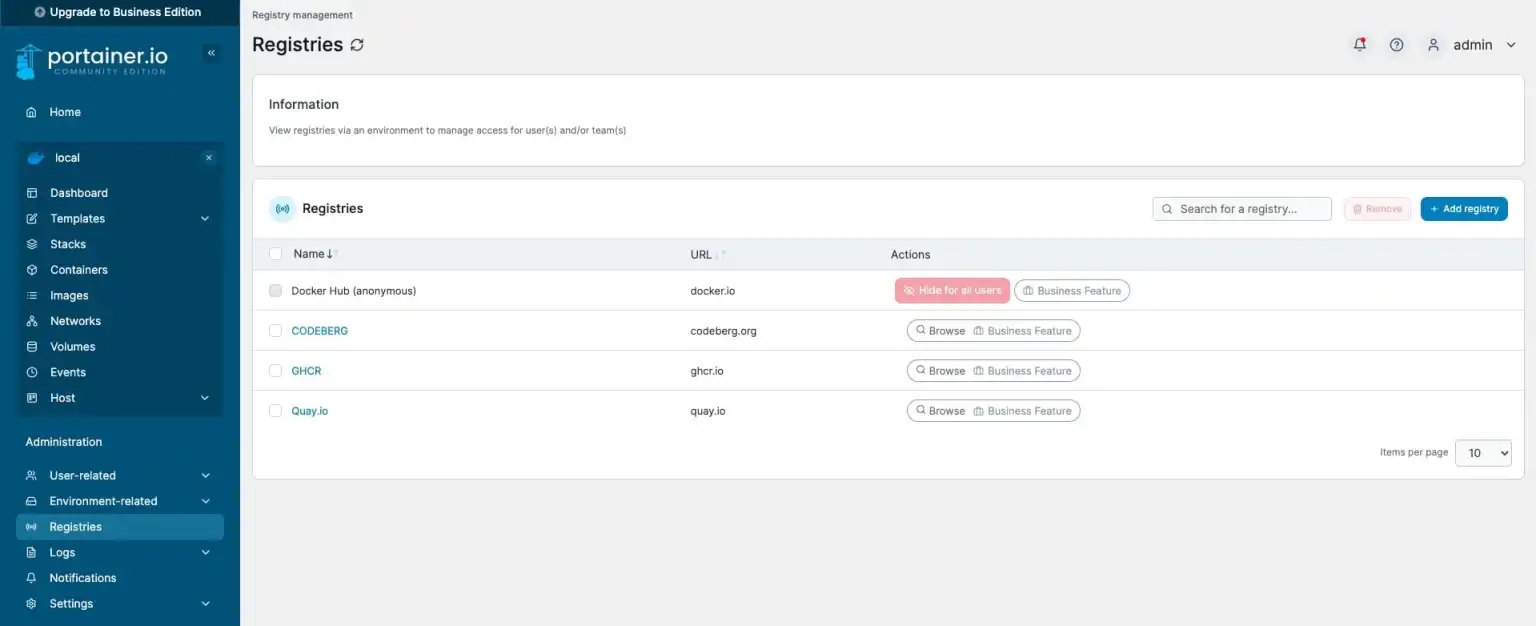
Also, add CODEBERG and in the Registry URL area type in codeberg.org and save and lastly, add Quay.io and in the Registry URL area type in quay.io and save the settings.
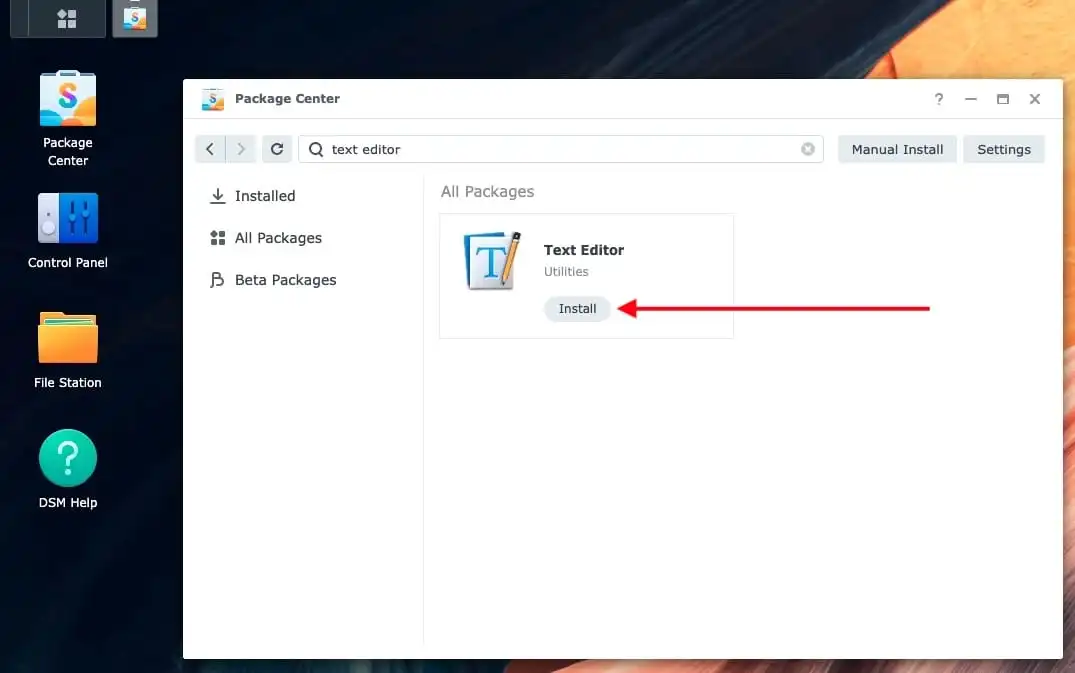
In order to be able to edit the prometheus.yml and snmp.yml with correct IP addresses, ports, and configurations on the synology nas, you will need a text editor. Therefore, launch the Package center and install a text editor as shown below.
Modify Synology Firewall Rules
If the firewall is enabled, ensure that you permit the IP addresses of the Prometheus and Grafana containers (CTs) by adding them to the allowed Source IP list on your Synology. Additionally, verify that the SNMP service is enabled. Else, you can leave it disabled which I do not recommend.
These steps will be discussed in a subsequent post in October during the Cyber-security awareness month.
Create Persistent Storage
Launch the “File Station” on your Synology NAS and have the Folders (directories) for Grafana and Prometheus created. These directories will be used to store the configuration and data for Grafana and Prometheus.
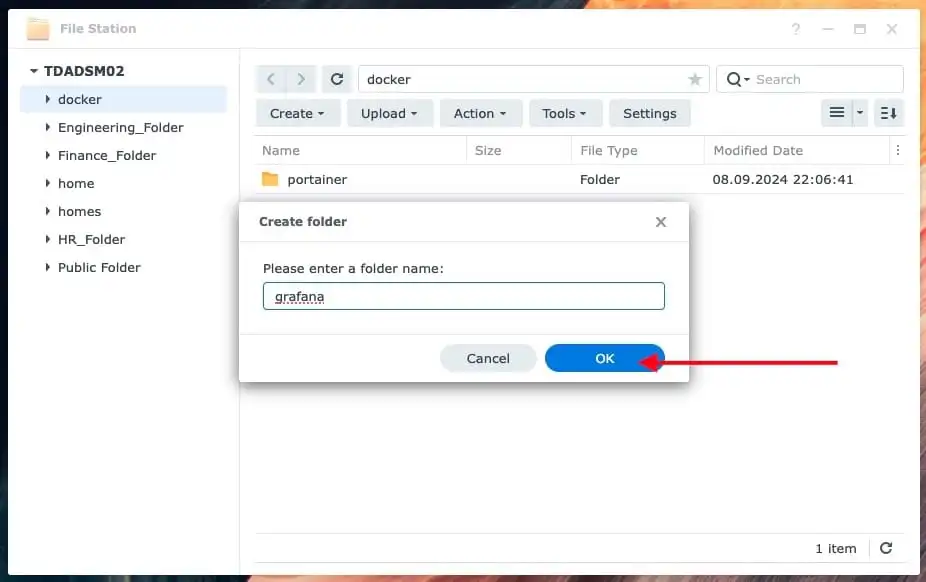
Next, we will be creating directories like data, Prometheus, and snmp in File Station under Grafana on the Synology NAS
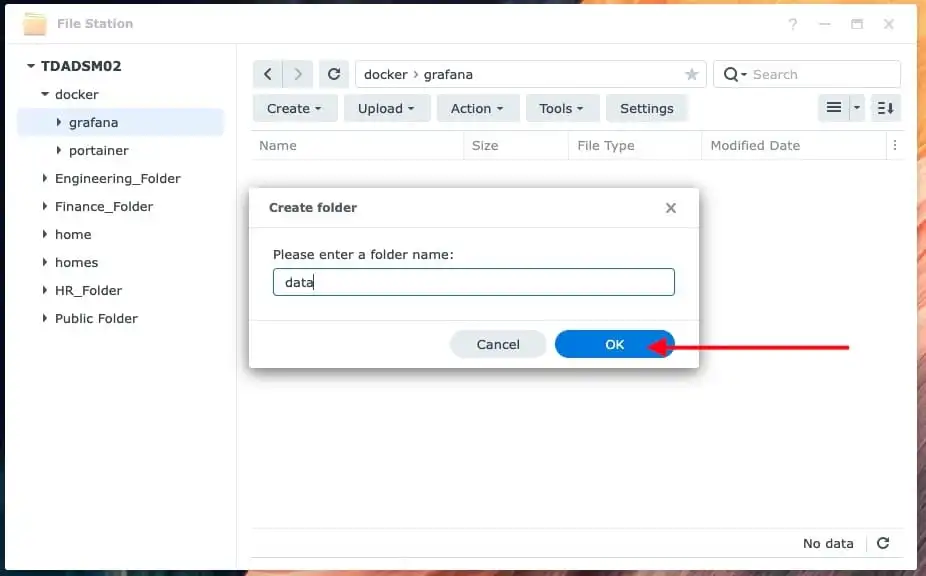
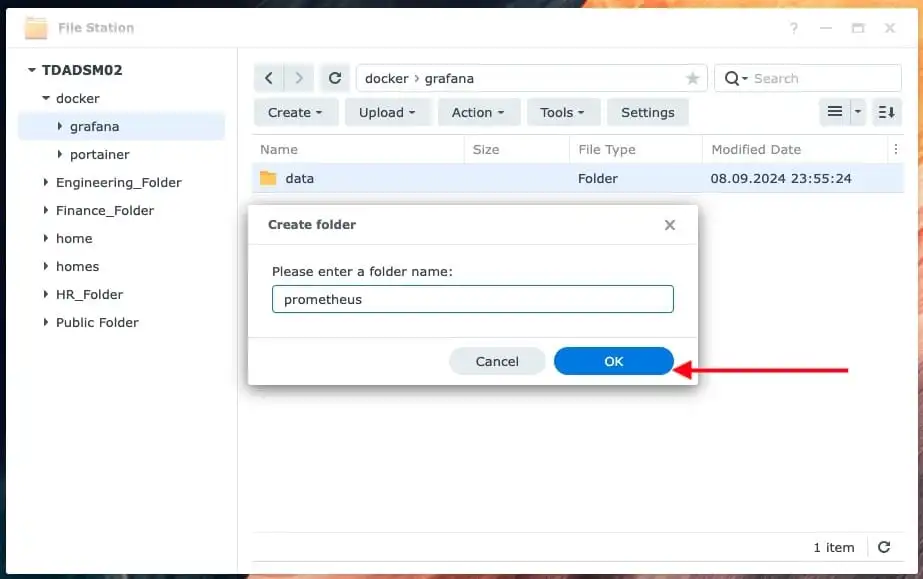
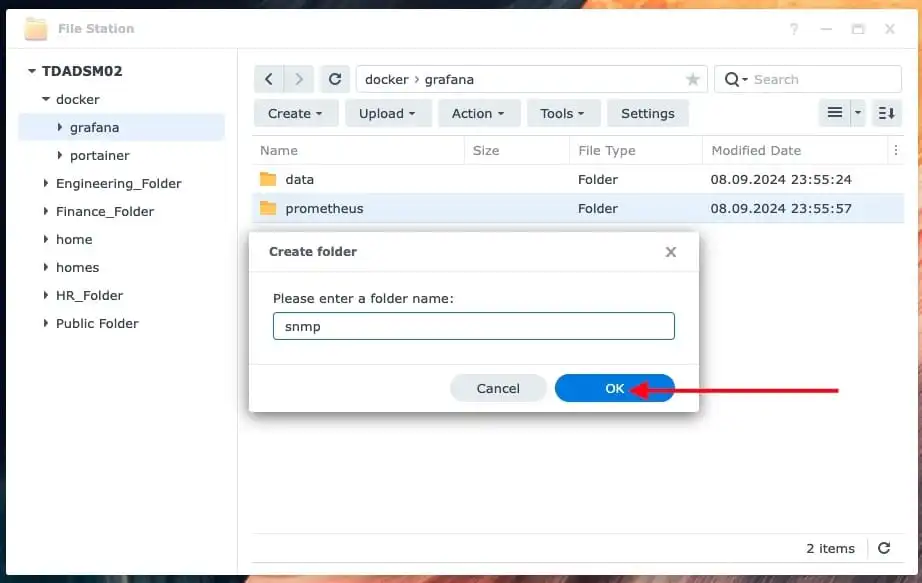
For a complete Docker stack on how to create a Grafana Dashboard etc., please visit the GitHub link for more information. Here you will find the required snmp.yml, pometheus.yml, synology-dashboard.json file already created
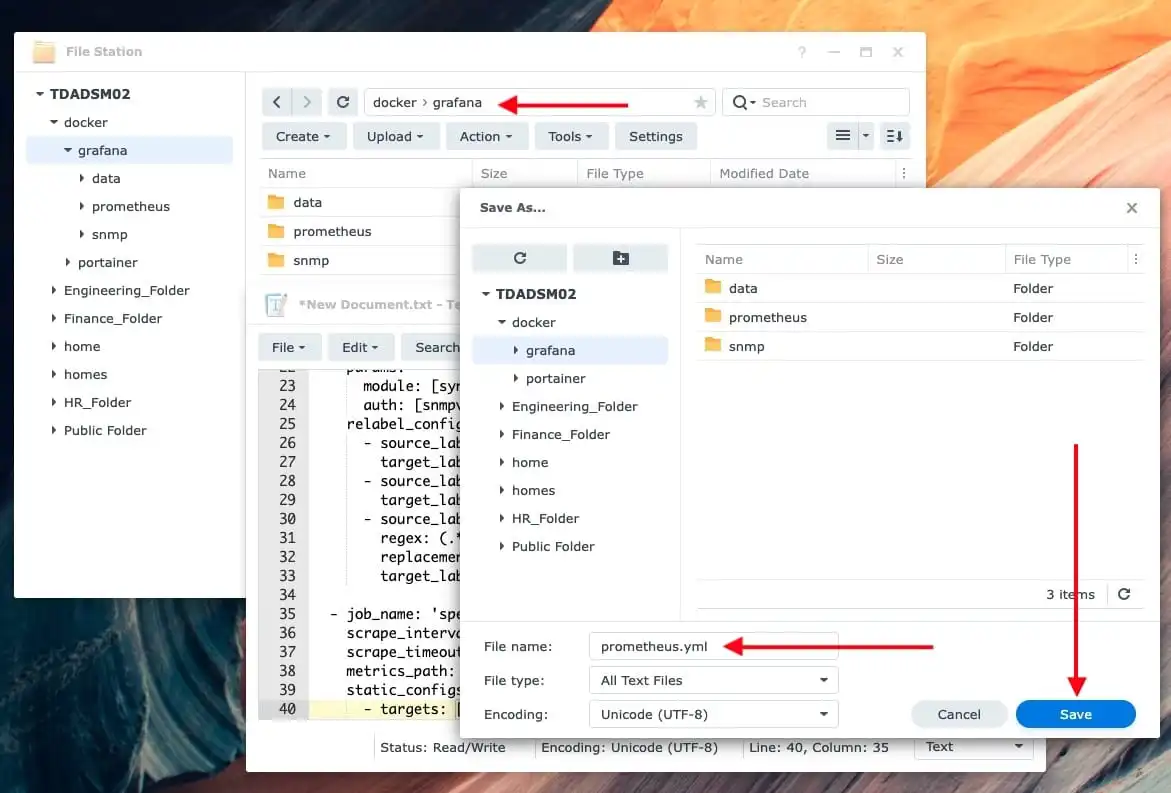
Upload Pometheus.yml configuration file to Grafana Folder you have downloaded from any of the sources above and ensure you edit the target with your own Synology NAS IP Address.
Upload snmp.yml configuration file to SNMP Folder. Upon downloading the snmp.yml file, we will also modify some basic parameters as set in the Synology NAS below. We will be using SNMPv3 with the username “snmp-exporter”, protocol “MD5′ and a password of our choice
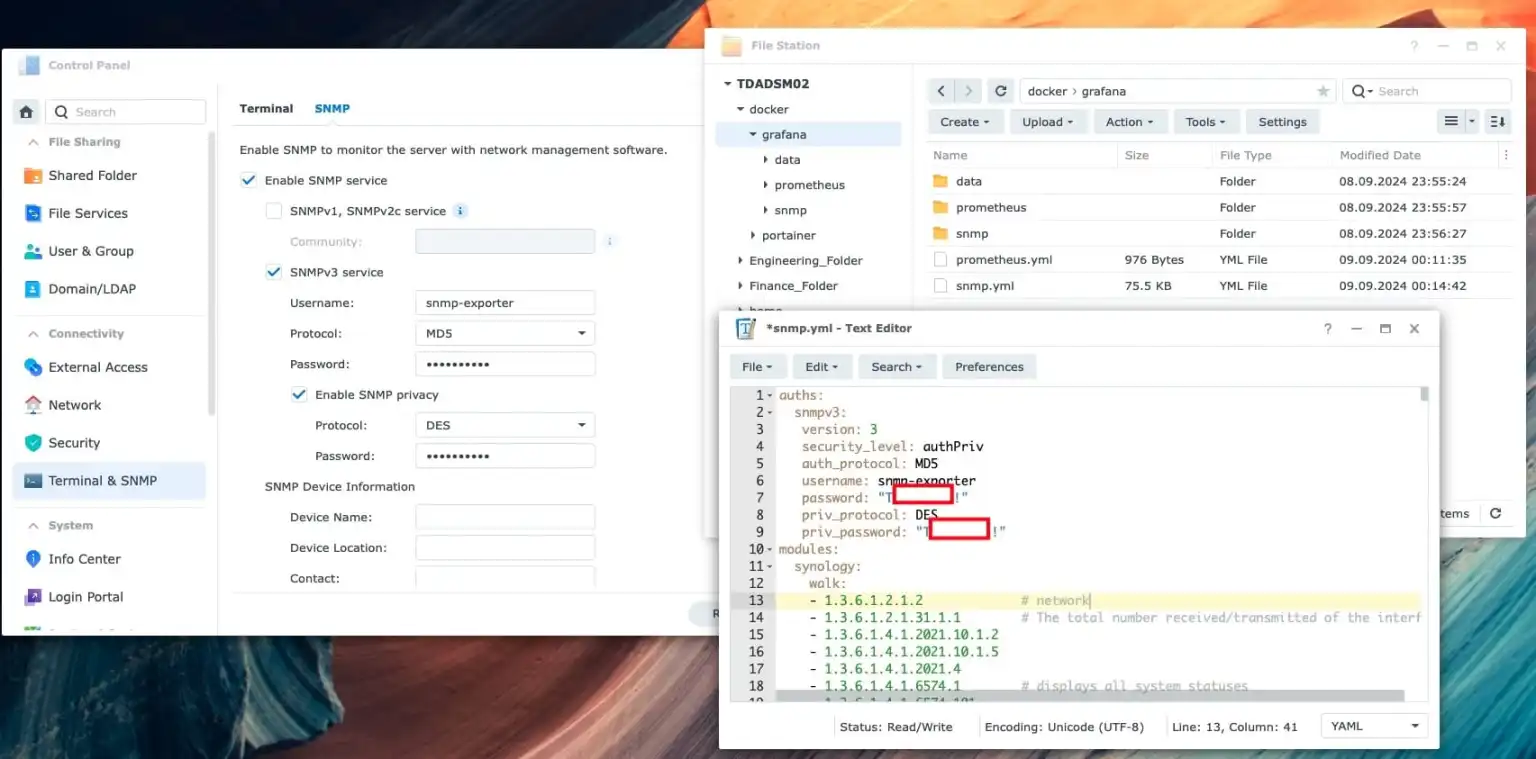
SNMPv3 enhances security significantly by incorporating features such as usernames, passwords, and encrypted data transmission. However, this added security comes with increased complexity and more configuration options compared to SNMPv2c.

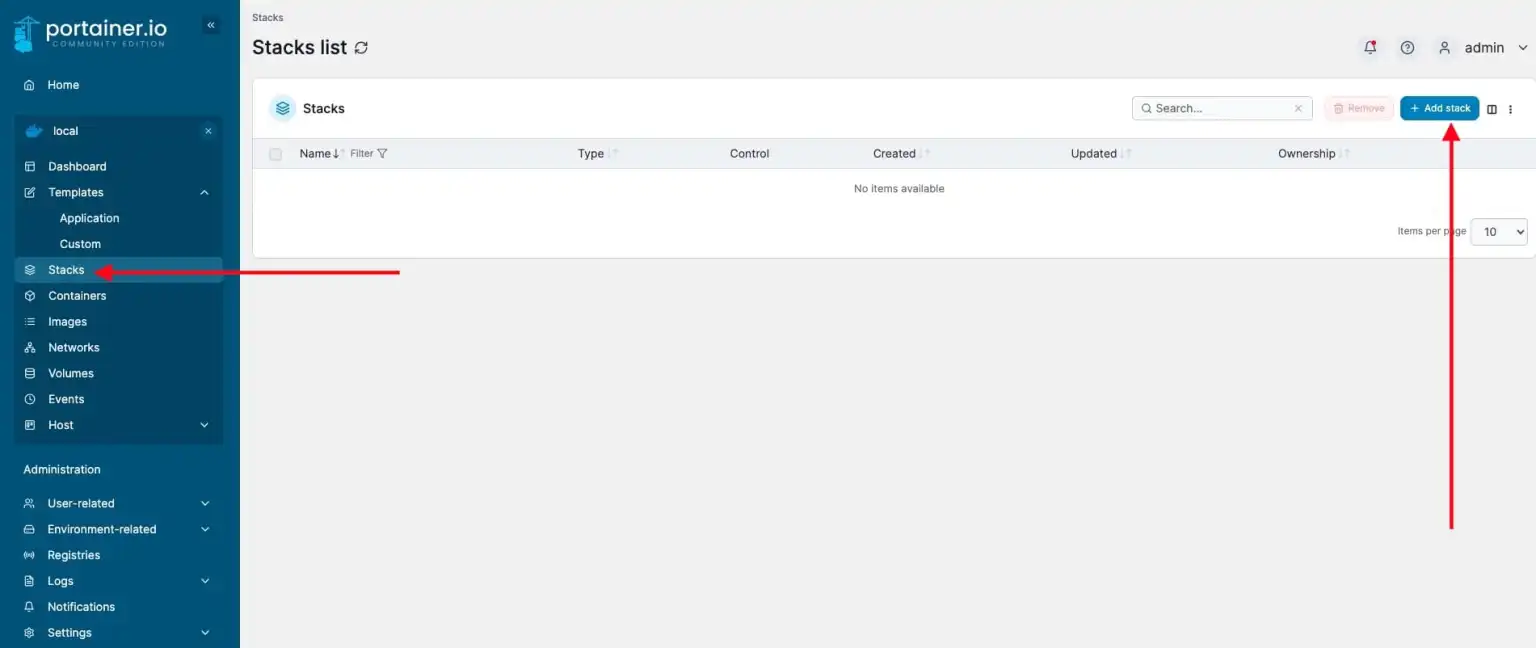
We will be creating a Docker Compose file that defines a stack of services, each running in its own container. This file help set up a monitoring environment using Grafana, Prometheus, and associated exporters (e.g., SNMP exporter, Node exporter etc). It also defines the network configurations that connect these containers. To do this, navigate to the Portainer dashboard and click on Stacks and then “Add Stack’.
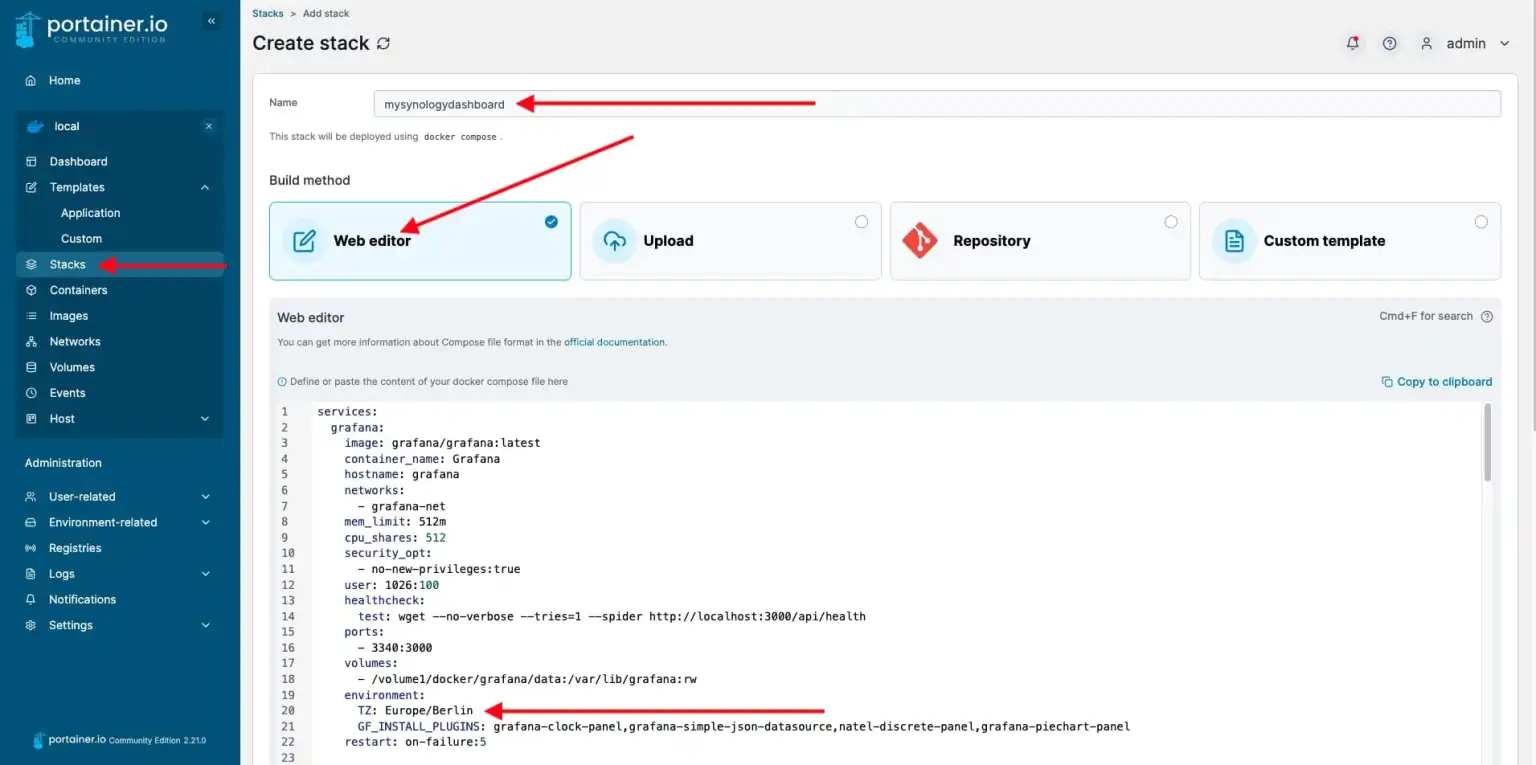
Select Web Editor and enter the Stack name as shown below. Also, enter the Docker compose file here. Please copy and paste this script. To re-use this script, kindly reference this link.
Click on “Deploy Stack” as shown below.
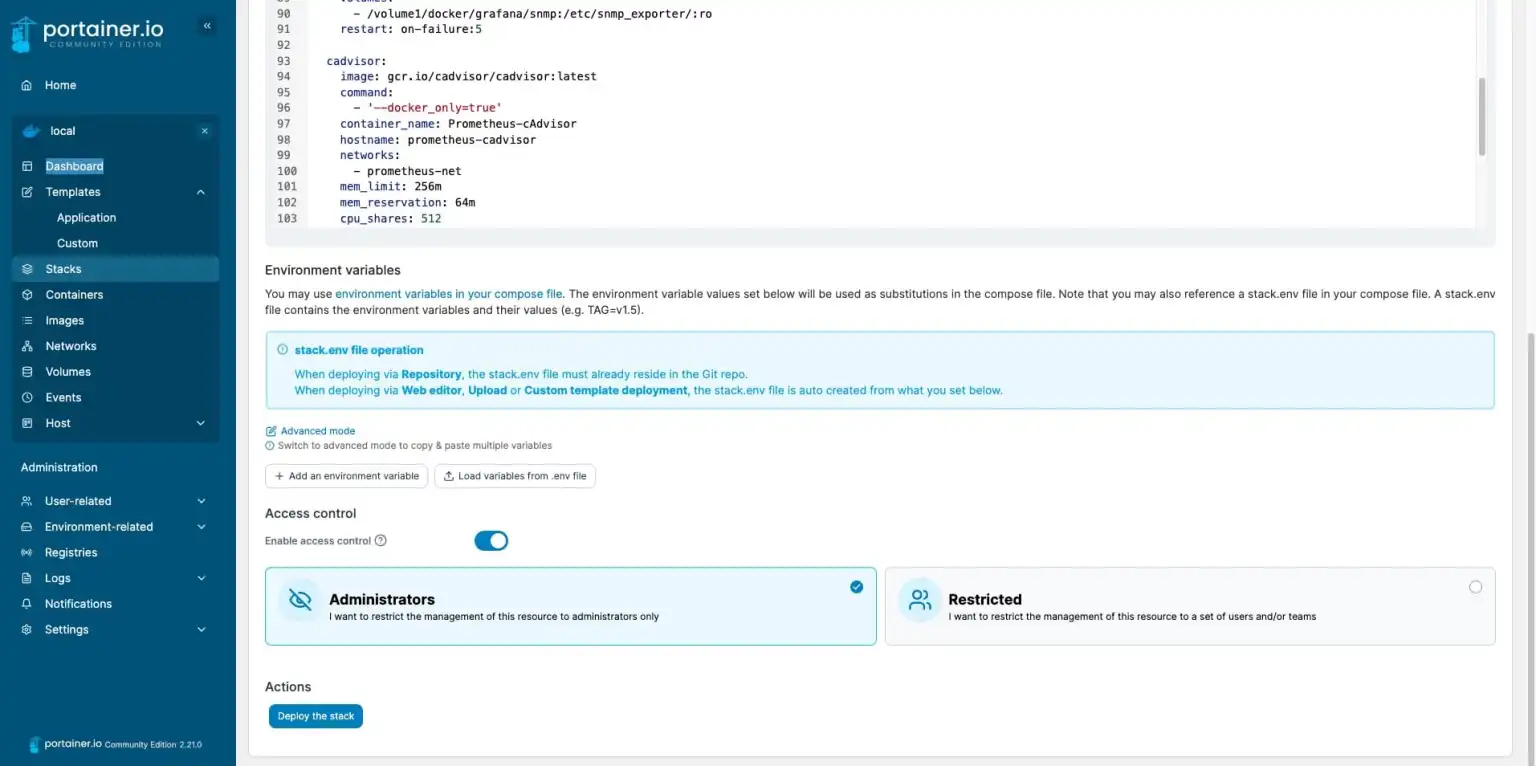
If successfully deployed, you will see a message, “success, stack successfully deployed”. Also, do not worry when you see the Grafana Container displays “unhealthy”. Just wait for few mins as it will turn healthy again.
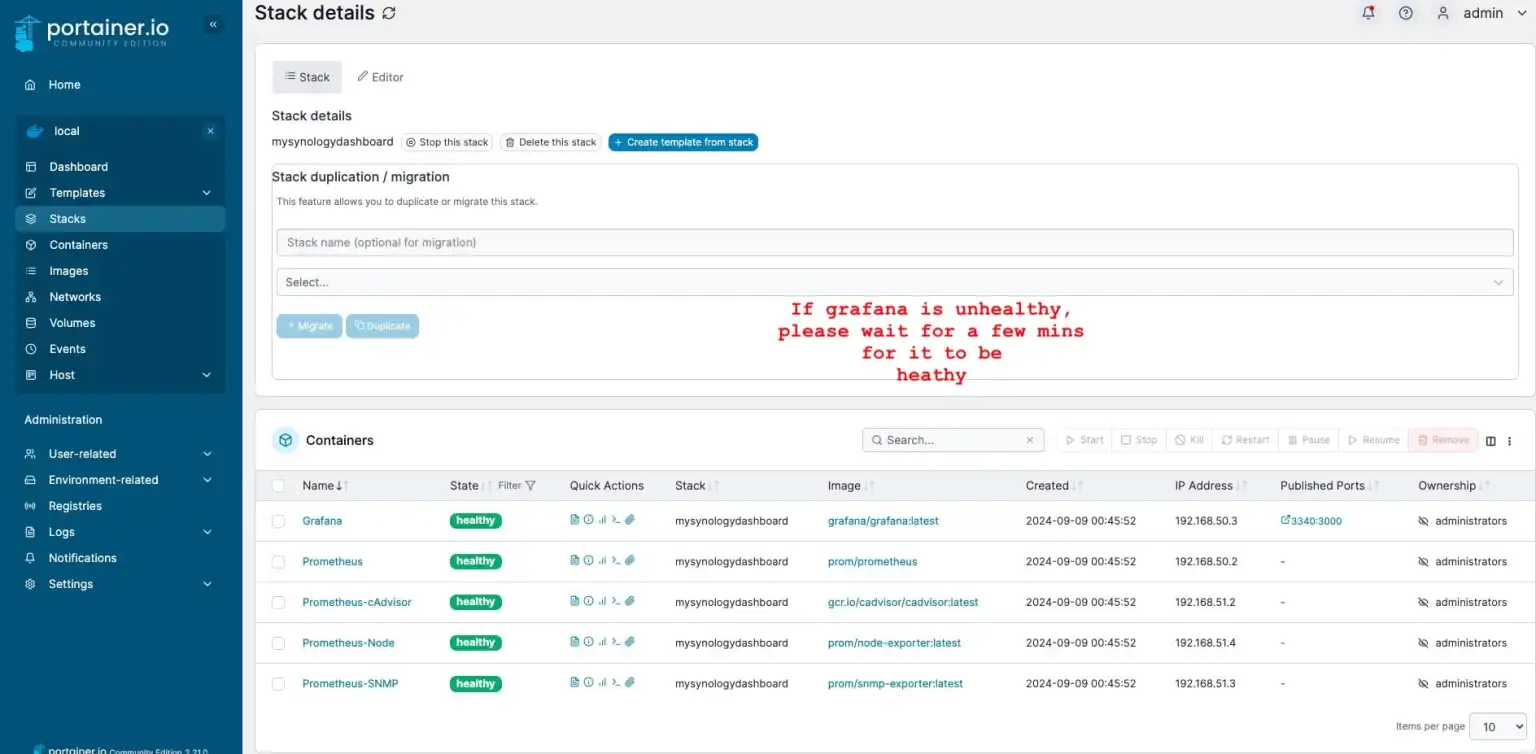
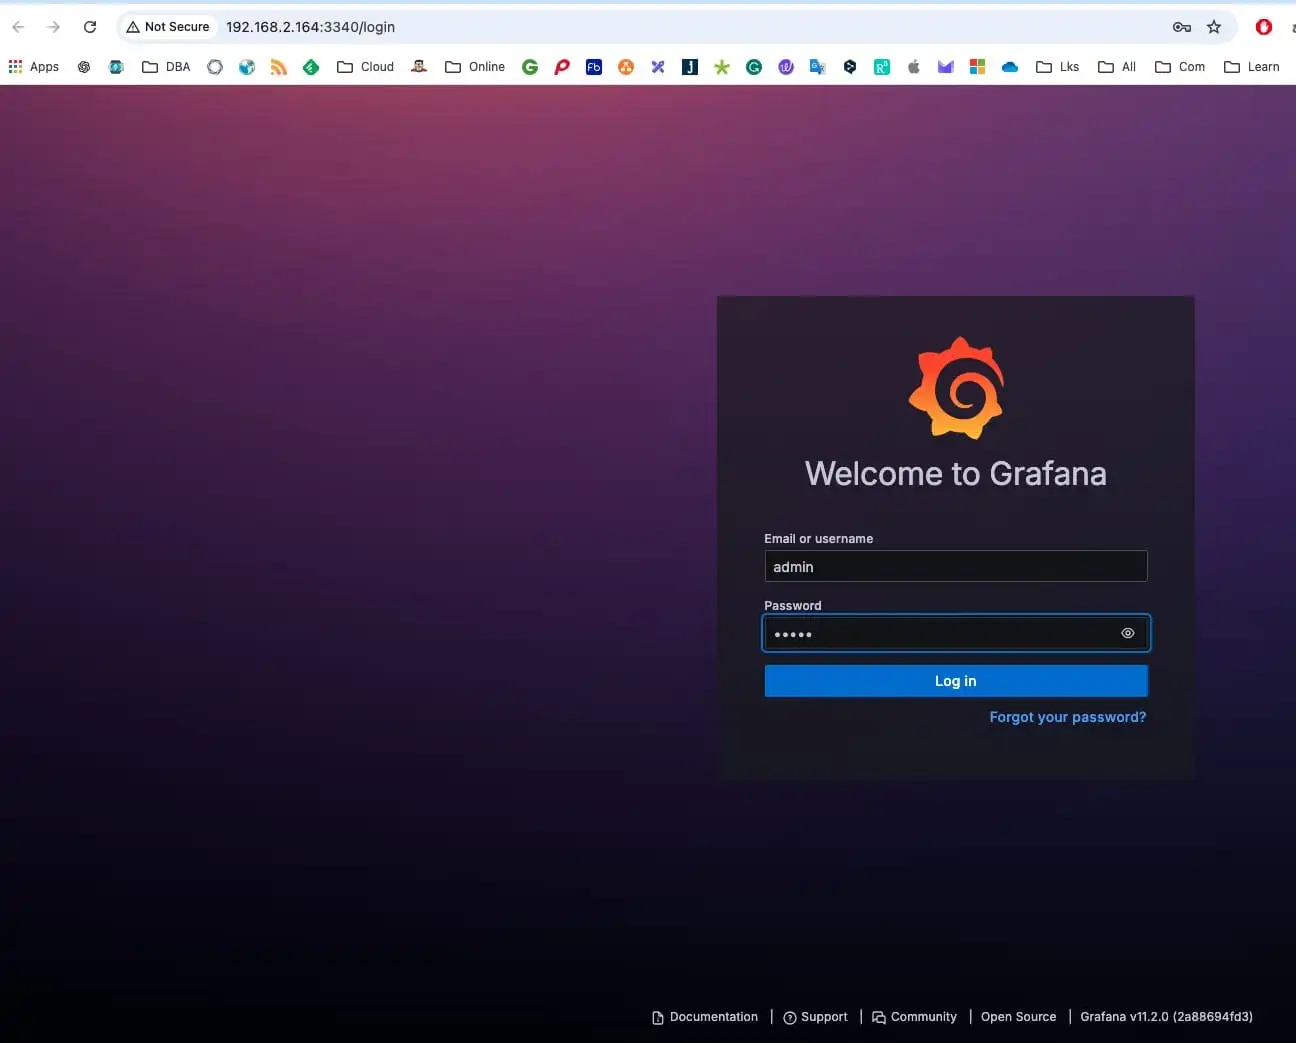
To access Grafana, launch a browser and go to http://<your-NAS-IP>:3000. You should see the Grafana login page. Upon login to Grafana. By the way, here is the default credentials (admin / admin).
We will have to add a connection on Grafana which is essential to pull data from external sources such as Prometheus or other data sources. Grafana itself does not store or collect data. It acts as a visualization and analytics tool.
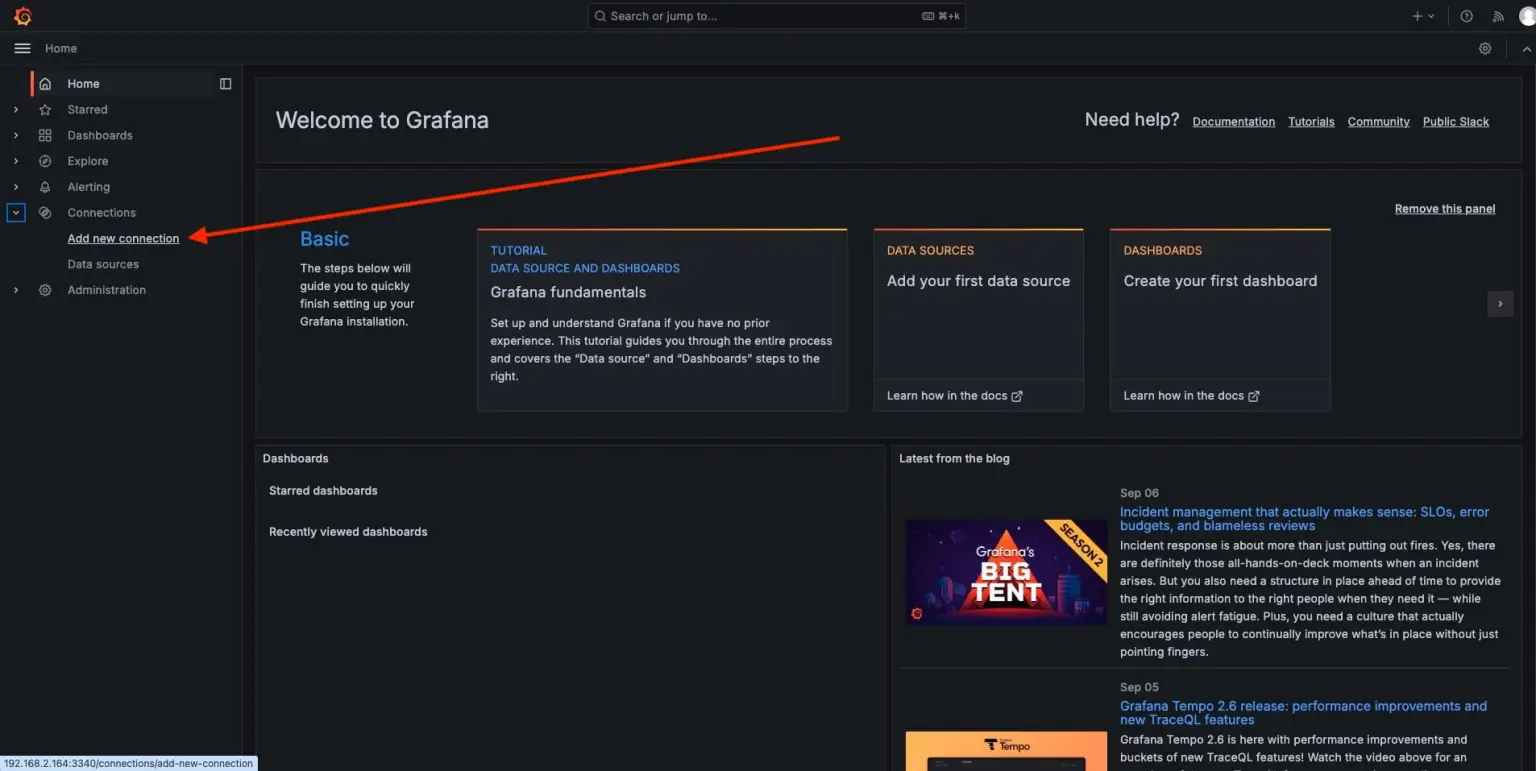
Search for Prometheus

Next, click on “Add new data source”

Enter the Prometheus server URL http://prometheus-server:9090 and name
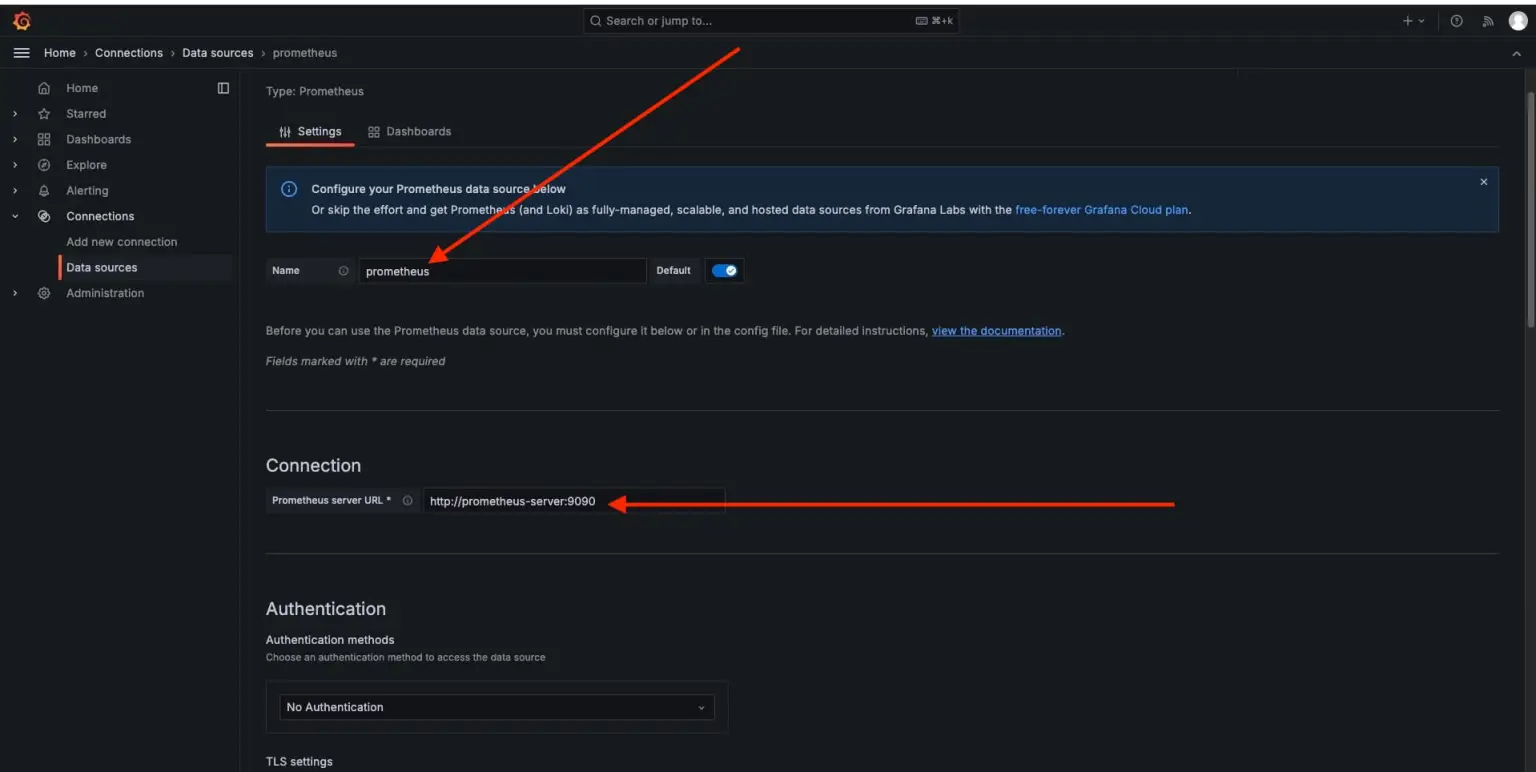
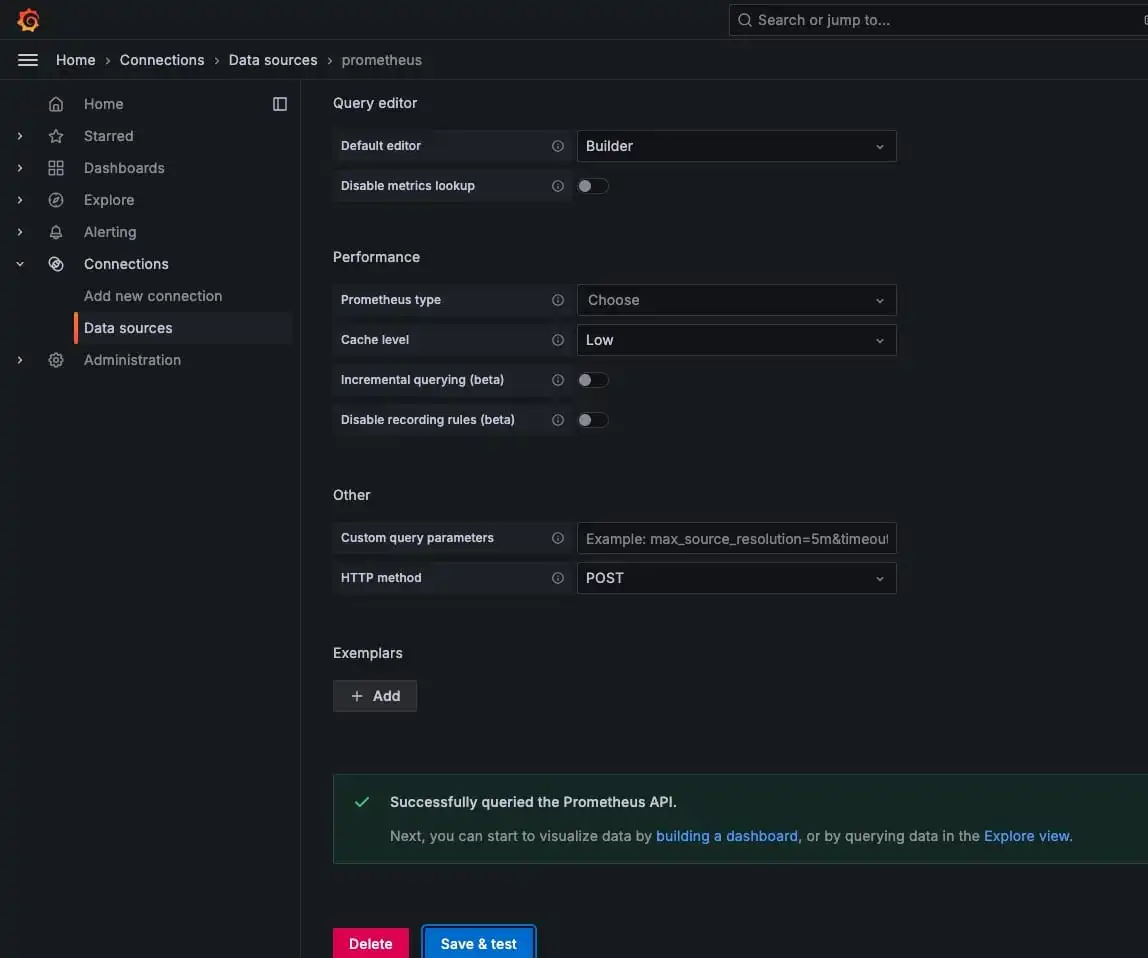
Save and test the connection
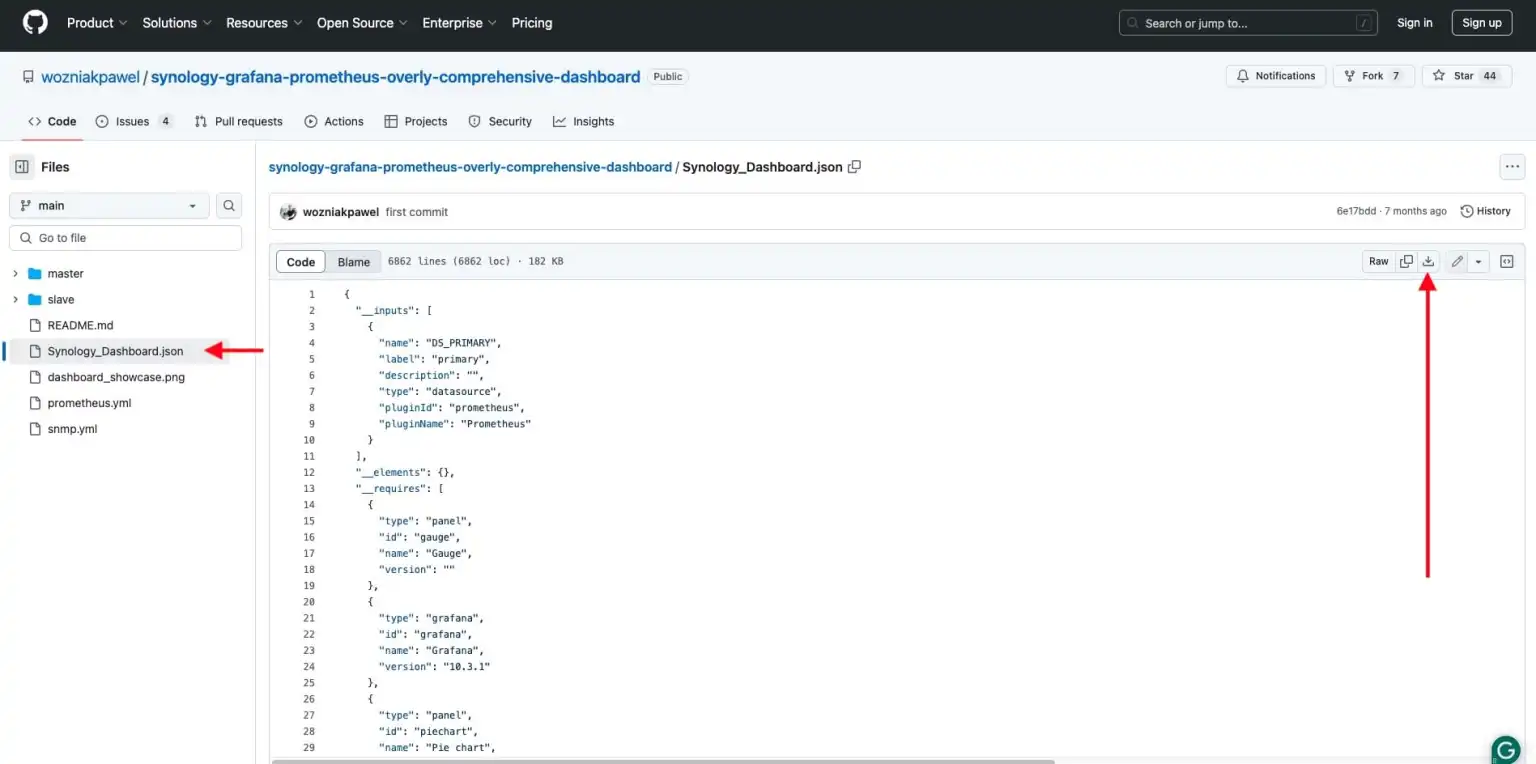
Now, you can create or import a dashboard. In the GitHub link referenced above, you will find a preconfigured synology_dashboard.json file. Please download it
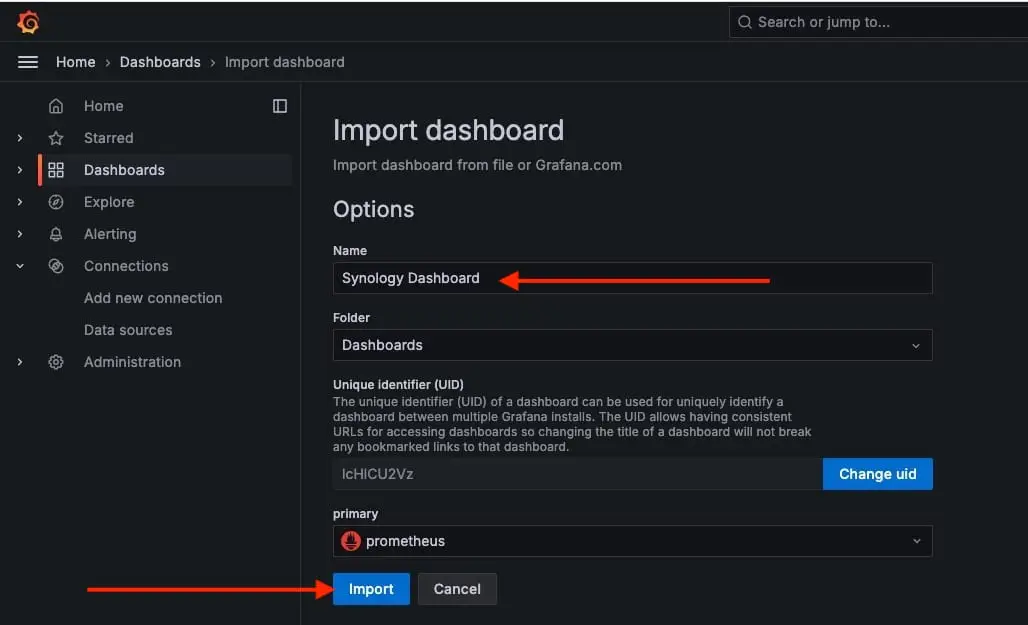
Click on import

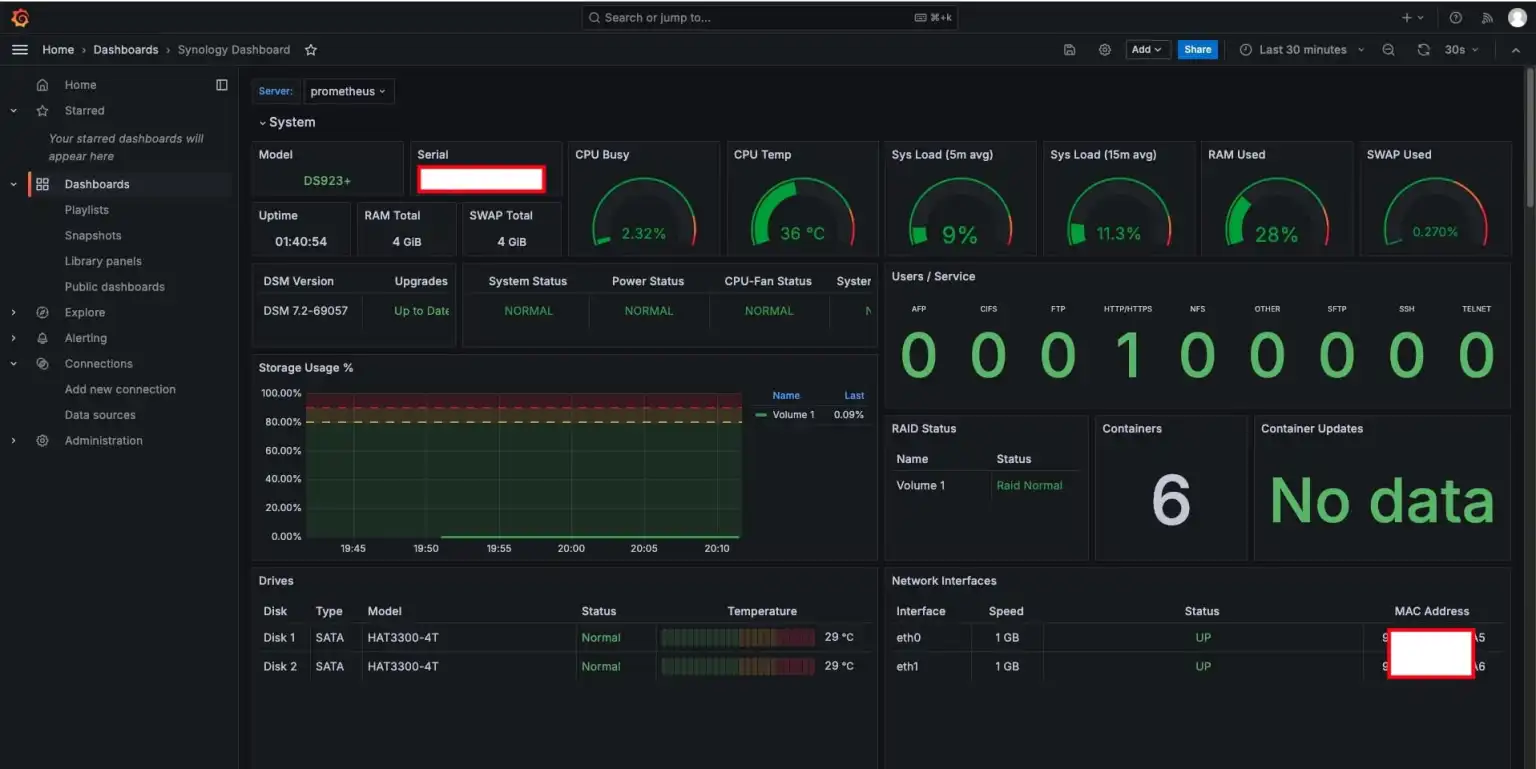
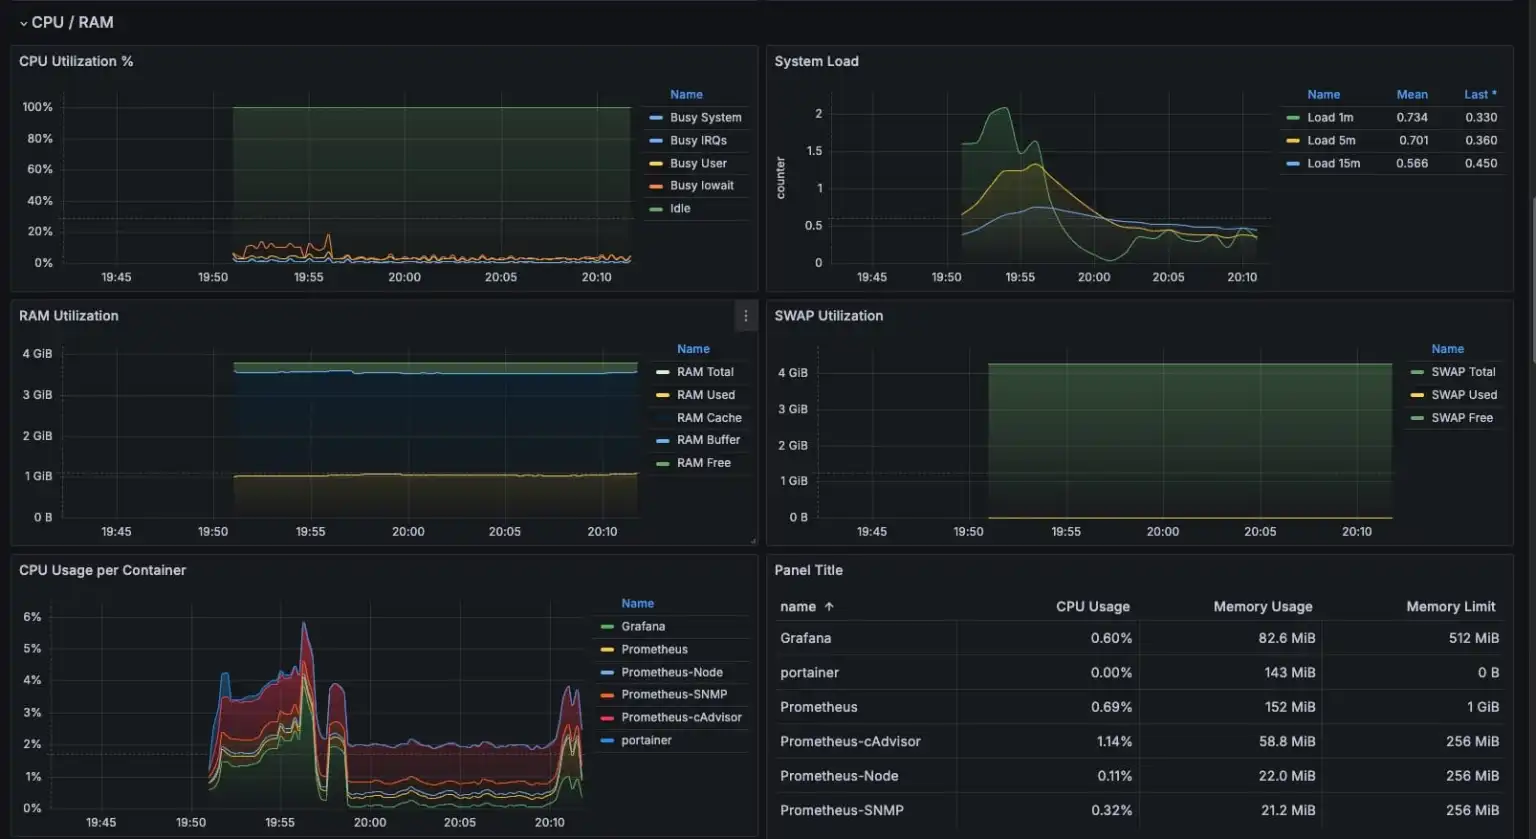
Connecting to data sources like Prometheus allows Grafana to display real-time data and trends from various services, including CPU usage, memory consumption, network traffic, and more as shown below. This helps in monitoring the health and performance of your Synology NAS.
For “J series Synology NAS devices” that cannot run Docker. Please take a look at this link. This does not require conatners such as “Cadvisor” or “Node_Exporter”. Since Docker isn’t supported on these models, you might want to explore other monitoring tools that don’t rely on containers such as Nagios and Zabbix.


