Question

K10 Multi-cluster dashboard not showing applications from all the cluster

  • 17 November 2023
  • 8 comments
  • 89 views

Userlevel 2

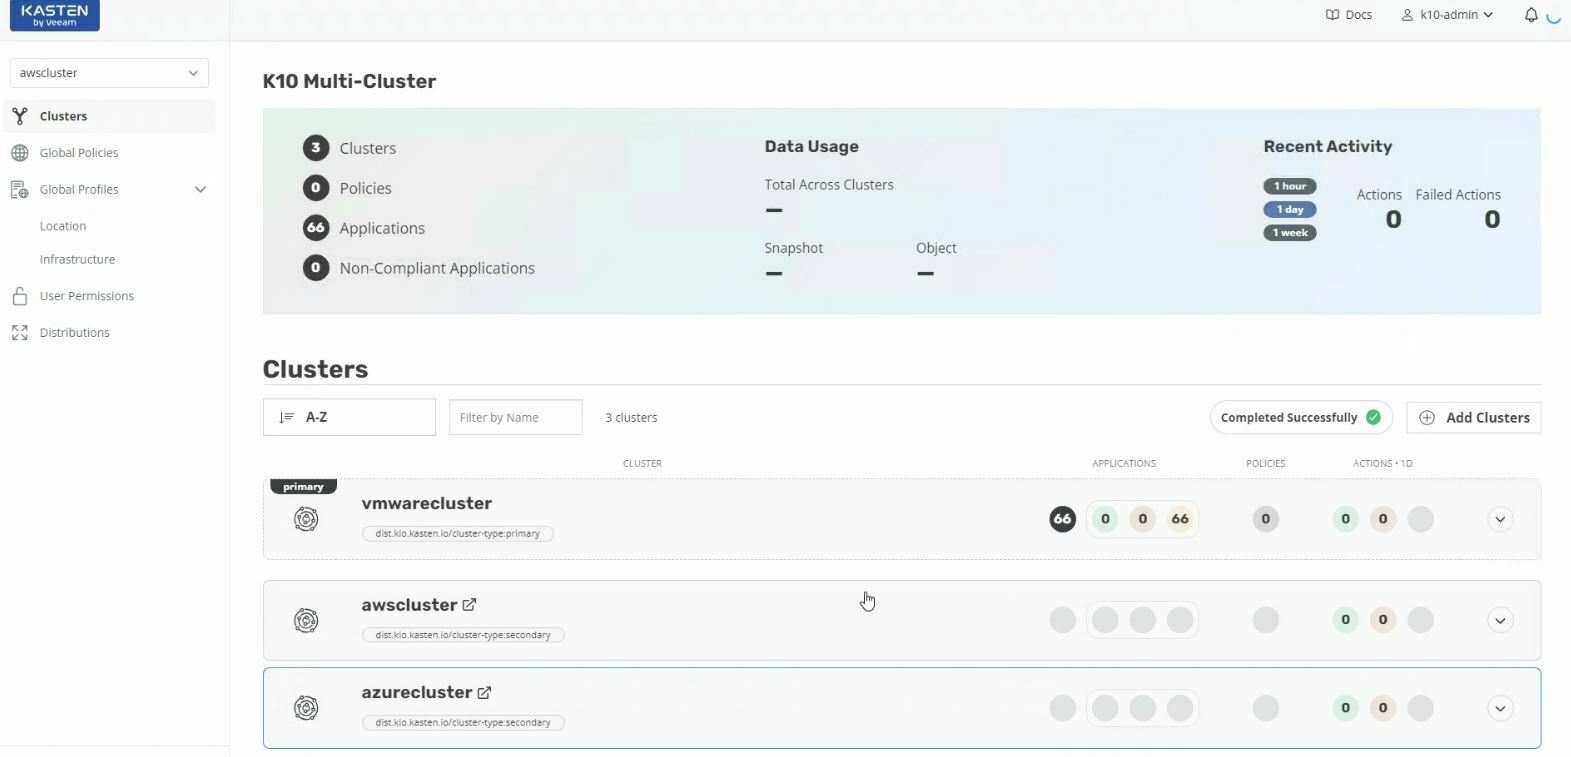
K10 Multi-cluster dashboard not showing applications from all the clusters. The user is K10-admin on this dashboard. If I click on individual clusters then user changes to k10-multi-cluster-user and I can view the applications for that cluster.

I would like to know what role (if any) is missing here to view the total number of applications from 3 clusters together. 


8 comments

Userlevel 6
Badge +2

@Shubhadip Pal Thanks for posting this topic here.

I see that you are not getting metrics from secondary cluster in the Multicluster manager dashboard.

This doesn’t seem to be role and permission related.

Would you be able to access primary k10 prometheus and look at the targets ?

<k10URL>/k10/prometheus/targets

Do you see any targets with the name of your secondary clusters ? what is the status of the target ?


Userlevel 2

Hi @jaiganeshjk , I am getting this window for the URL you said, not sure which cluster data is showing in this page.


Userlevel 6
Badge +2

Can you scroll down in the same page, You should see a Target (similar to the one that says httpServiceDiscovery in your screenshot) with your secondary cluster name. 

Do you see it failing to discover with an error or is it missing  ?

Userlevel 2

I see the lower page as below.


Userlevel 6
Badge +2

@Shubhadip Pal Thanks. This means that the prometheus doesn’t have the federation config.

Just one more question for me to understand why the prometheus doesn’t have the federation config.

Are you using K10 operator based installation for your primary K10 instance ?

Userlevel 2

yes, we did operator based installation.

Userlevel 6
Badge +2

Oh. Then I might have an idea what might be the issue.

It could be because the operator might remove the federation config from the prometheus configMap after the bootstrap of the secondary is completed. 

One thing we could do is to wait for the next release 6.5 to resolve this issue.

From the new release, K10 will not be relying on the prometheus federation to get the metrics from the secondary clusters. It will use a different messaging mechanism to get the metrics from the secondary cluster going forward. So this issue will get automatically resolved with this.


Still I will file an issue internally with the engineering to look into this.

Userlevel 2

Thanks for the update. Anyways, we can select  secondary cluster from drop down list and browse into individual cluster.

Comment