When troubleshooting vSAN issues, we need to complete understanding of the vSAN environment. Today I will introduce a good tool "vSAN Objects Viewer" that quickly converts vSAN information from text to graphics, including the followings:
- vSAN cluster topology
- vSAN nodes information
- vSAN disk group information
- VM and object composition
- Component distribution and status
Requirements
- VMware vSAN OSA 6.x/7.x/8.x
- Docker
Deploying the Tool
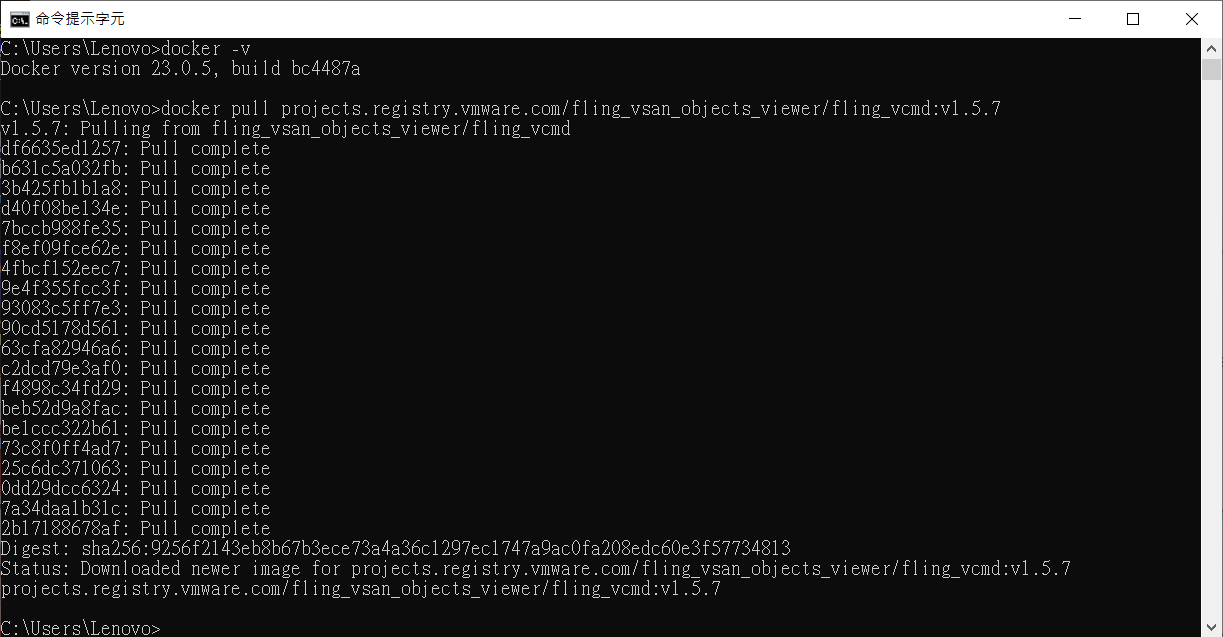
Pull the Docker image by running the following command:
docker pull projects.registry.vmware.com/fling_vsan_objects_viewer/fling_vcmd:v1.5.7
Deploy the container by running the following command:
docker run -d -p 30000:80 projects.registry.vmware.com/fling_vsan_objects_viewer/fling_vcmd:v1.5.7
Run the following command on any ESXi hosts within the vSAN cluster and download the output file to your local host or a remote web server:
cmmds-tool find -f json > /tmp/output.txt
Uploading the output file
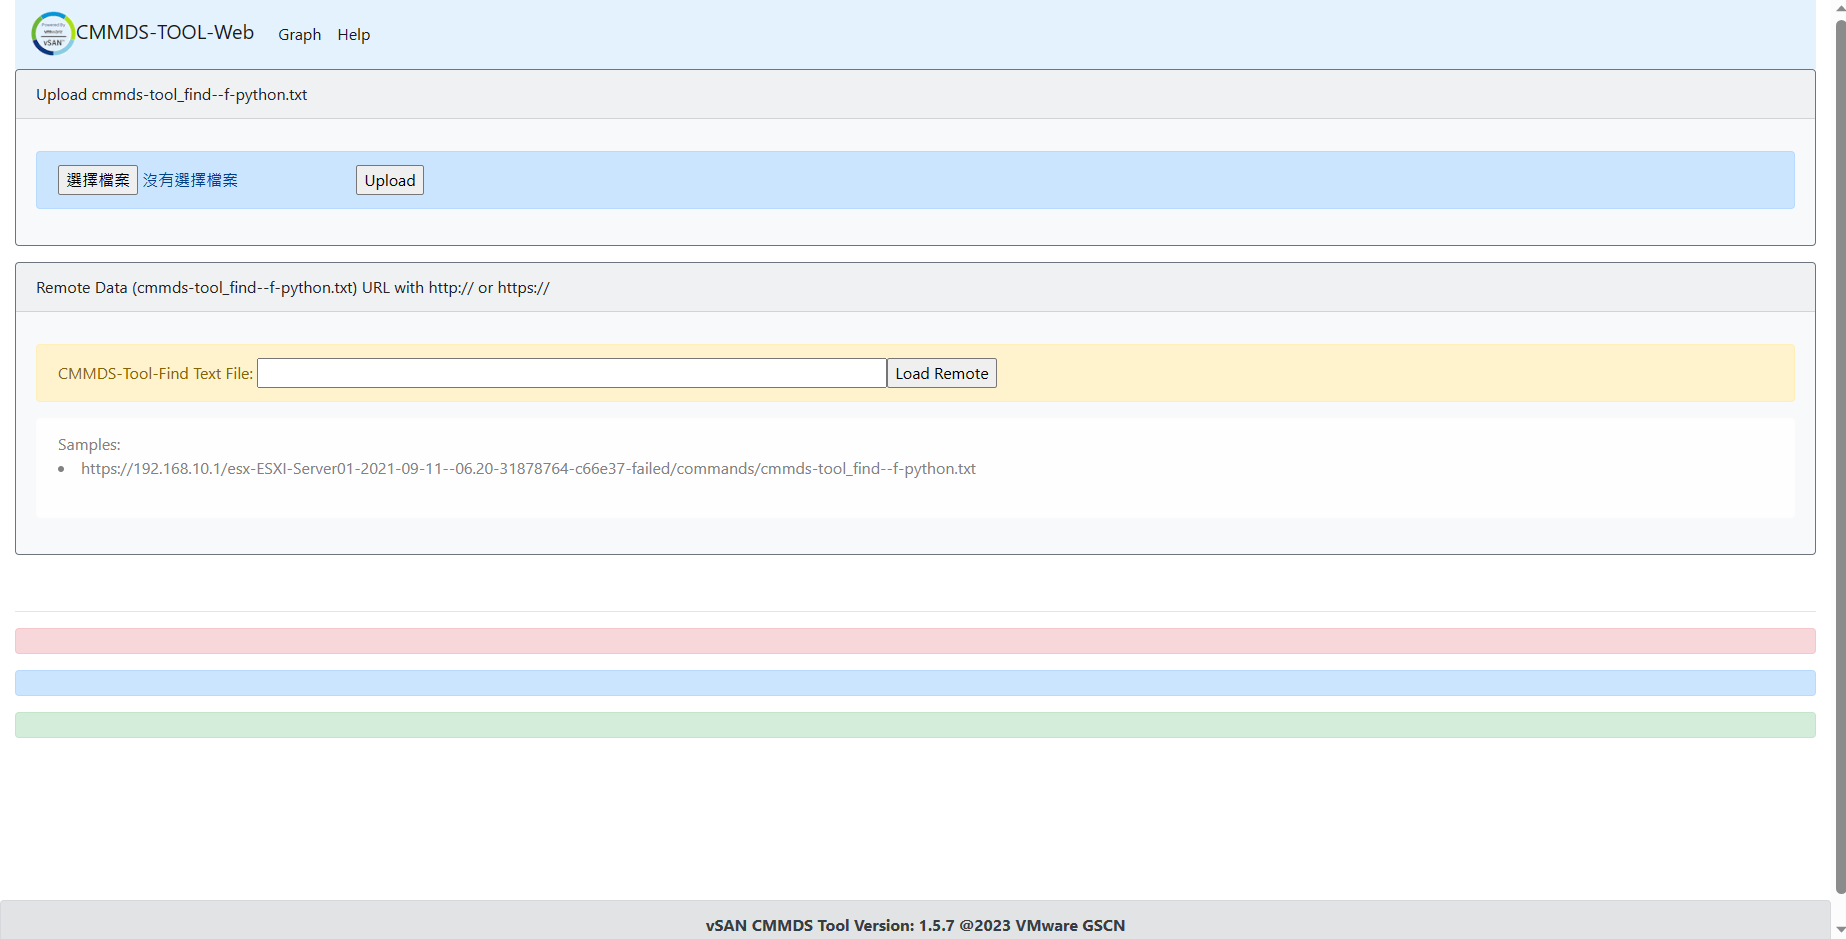
Access the tool by a web browser and entering the correct IP address and port, e.g. http://<<Tool's IP address>>:30000/vcmd/graph/
Click "Choose File" and select your output file. Click "Upload".
Remark: It supports two methods for uploading the output file to the tool.
vSAN Viewer Overview
Once you uploaded the output file, you can obtain a comprehensive overview of your vSAN cluster.
There are four colors to indicate component status.
Green: Healthy
Yellow: Absent. Blue: Reconfiguration
Red: Degraded
For details, please refer to this link https://flings.vmware.com/vsan-objects-viewer


