Solved

Difference in performance BCJ

  • 1 December 2023
  • 4 comments
  • 47 views

Userlevel 7
Badge +1

Hello,

I would like to know why are there so many differences in performance of BCJ?
This is all in one BCJ.
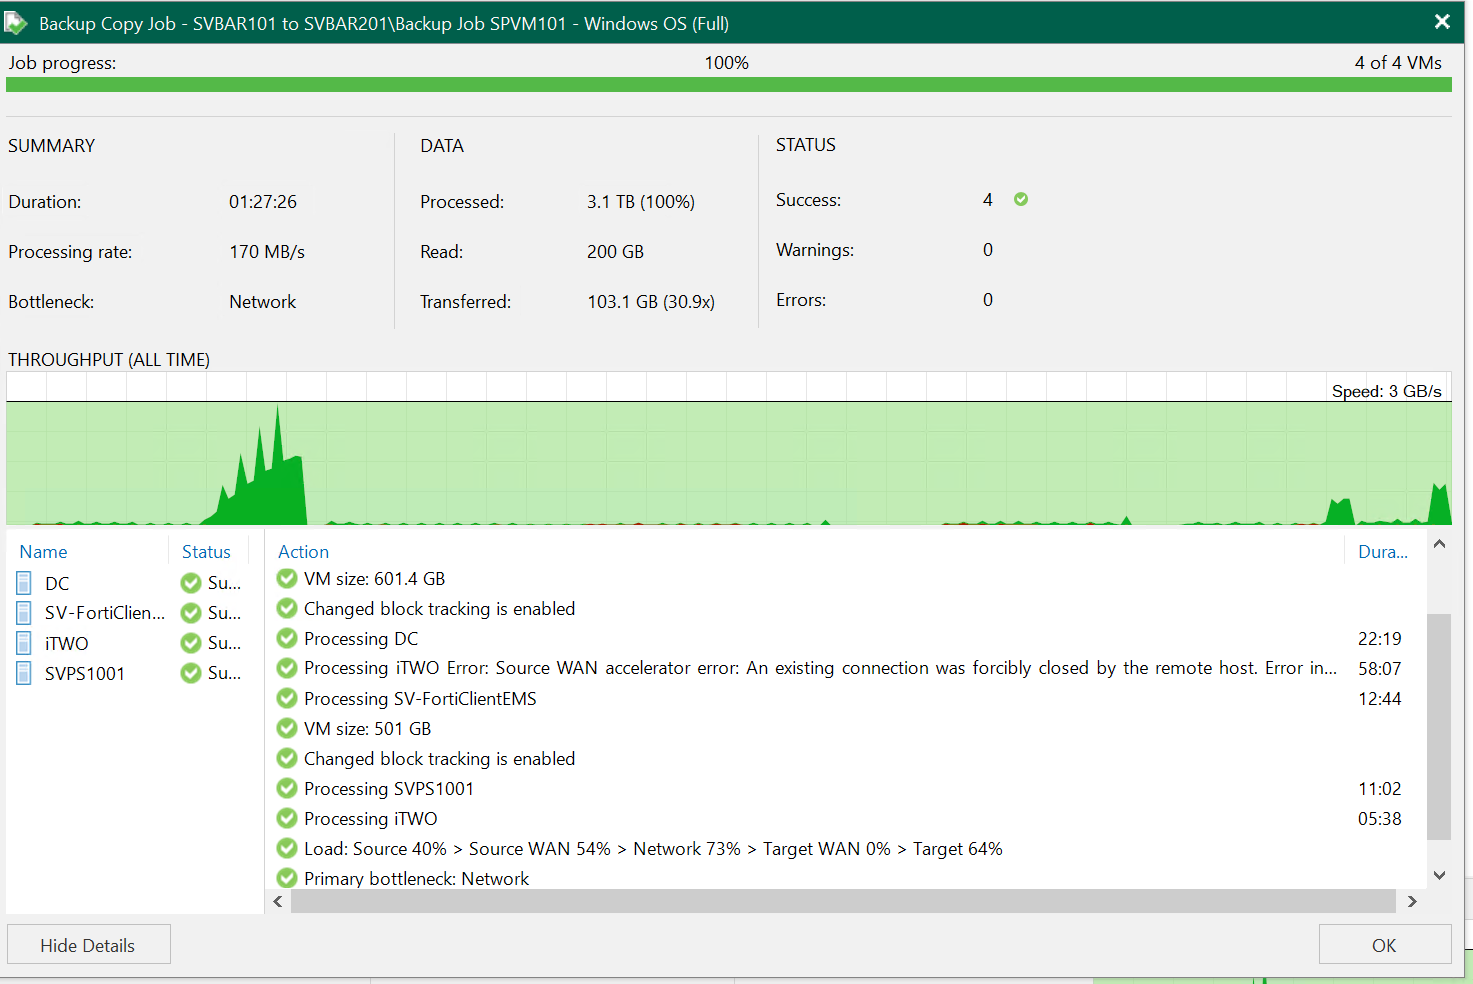
Result of already finished one:
 

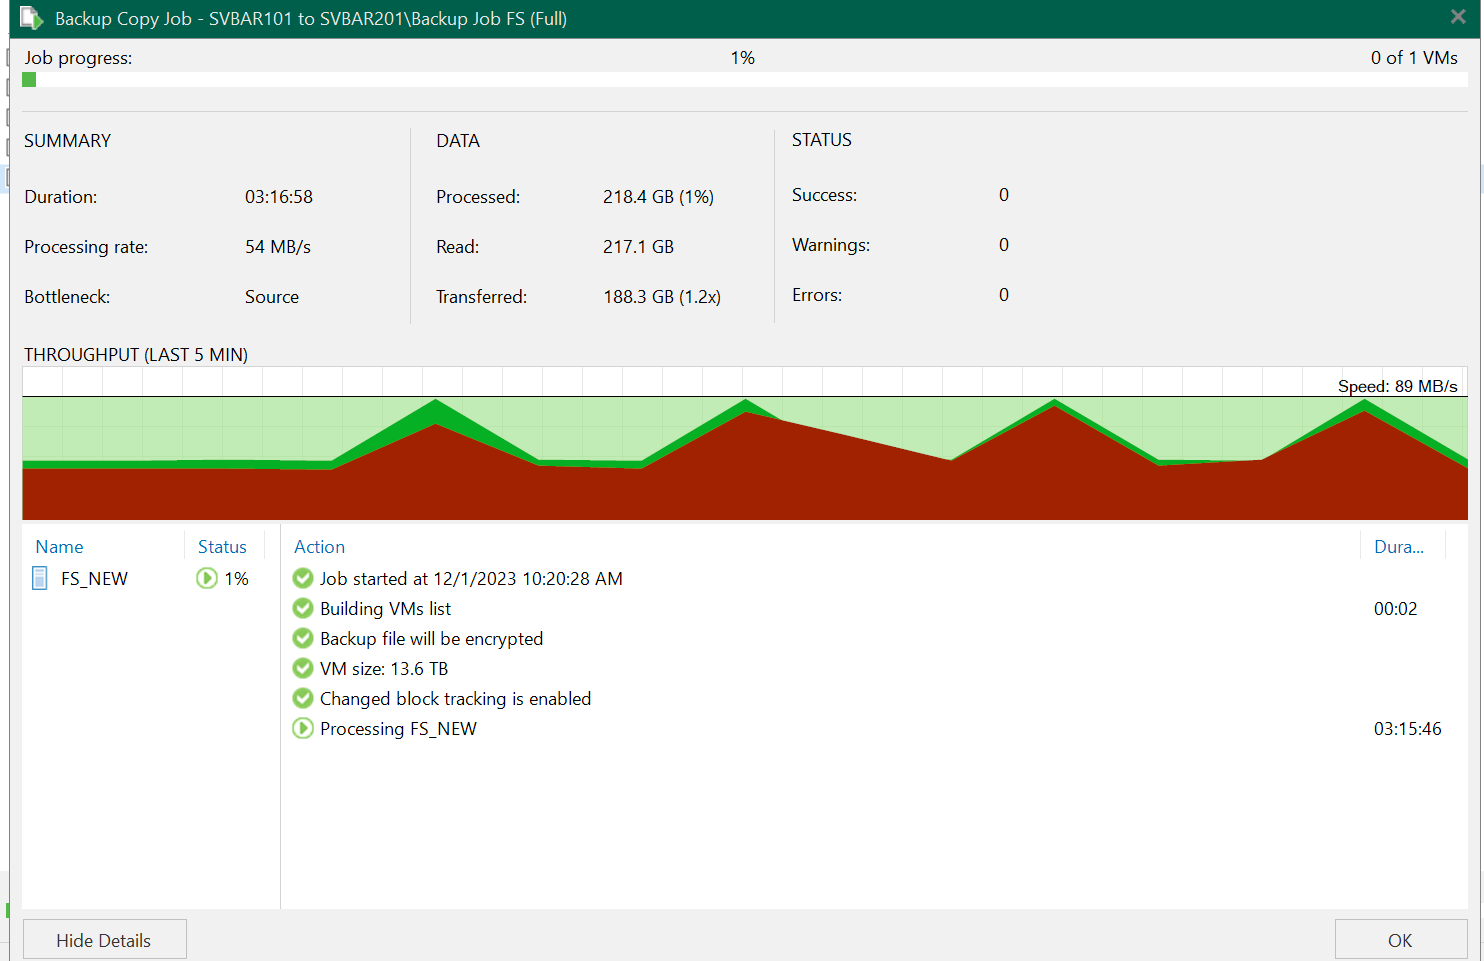
Results of currently running one:


icon

Best answer by coolsport00 1 December 2023, 13:59

View original

4 comments

Userlevel 7
Badge +17

Performance has to do with many factors - source side storage, network and data path from source to target, WAN Accelerator performance (compute resources, other), and target side storage. There’s no concrete answer to give. For example, you could have latency on the source or even target storage devices based off I/O settings configured in Veeam. As such, Veeam will ‘throttle’ a job (Backup or Backup Copy) based off those settings. Your Proxy and Repository settings have “max concurrent tasks” (Proxy) and Read/Write latency & concurrent task settings on the Repo, which would also throttle back performance of a job. Then there’s network. If your “pipe” is saturated, that can cause performance differences. The only way to be more concrete on where latency/performance issues lie is to test each layer.

Hope that helps clarify a bit.

Userlevel 7
Badge +20

The main thing to look at in both those screenshots is the Bottleneck - the first one was Network and the second is Source.  The Source is typically the source repository which it is reading the backups from as it could be the number of tasks set on the repository.  The first one was Network but still a pretty good transfer rate to me.

Userlevel 6
Badge +3

Looking at the transferred data, there is a large difference here as well.
Job 1 took 87 minutes to transfer 103 GB data of 200 GB read of 3TB frontend data.
Job 2 took 196 minutes to transfer 188 GB data 217 GB read of 218 GB frontend data, little over 2x the time for little under 2x the data, sounds pretty reasonable given it’s a single VM vs many VMs and potentially less parallel processing able to happen.

Also, it looks like job 2 is a brand-new backup job, or an almost completely unique data set compared to job 1 that looks like an incremental, or at the very least a lot of common data between machines in the job.

If you rerun the job after it finishes, it’ll probably process a lot “faster” because there won’t be as much unique data to transfer this time.

Userlevel 7
Badge +8

As @NZ_BenThomas already mentioned: Your numbers between the two jobs seem reasonable. You always have to look at “transferred data”. Frontend data could even be just empty blocks not being transferred at all. This is also why the green area sometimes shoots up like crazy and relaxes again.

Compare the compression ratios of both jobs (number behind “transferred”): 1.2 vs. 30.9. A huge difference that IMHO is the main reason for the observed differences in net speed.

Comment