Veeam ONE v12 has been launched, and it is massive! Among so many other great features, I would like to extend today and focus on this particular new security feature, Auditing, as per the What’s New:

When I saw that functionality, I was already so excited to see what level of audit we would have.
How to enable Veeam ONE v12 Auditing?
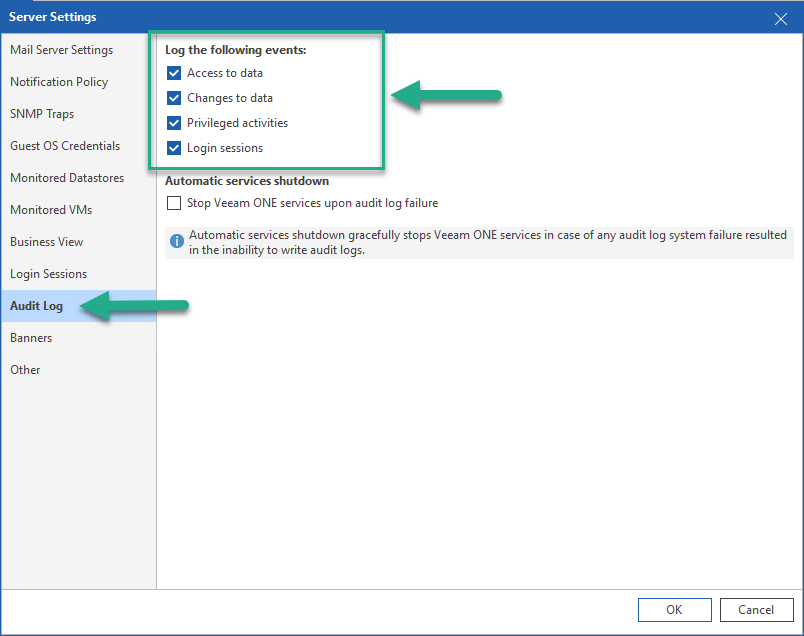
It is really easy under the Server Settings, you will find the section called Auditing, then mark what is most relevant for you. I would mark all of them:

After we enable them, we can quickly go to our traditional Microsoft Windows Events Log, and we will find a new section called Veeam ONE. Inside this category, we can find different events, with event category, etc.:

If you explore a bit more, you could filter by Event ID, so as a quick example:
- Event ID: 10006 - These are authentication anomalies, meaning wrong user/password.
- Event ID: 2 - These are usually Veeam ONE Settings changes, like a new password added, a new report saved/created, etc.
- Event ID: 3 - These are usually Veeam ONE Infrastructure changes, like adding a new ESXi to monitor, resolving alarms, etc.
I hope you get the idea. This is absolutely superb!
The Art of the possible - Monitoring Veeam ONE Audit Events with telegraf, InfluxDB, and Grafana
I have recorded a video with the how-to get all these Windows Events Logs regarding Veeam ONE and quickly visualize them with Grafana, but of course, it can be something else.
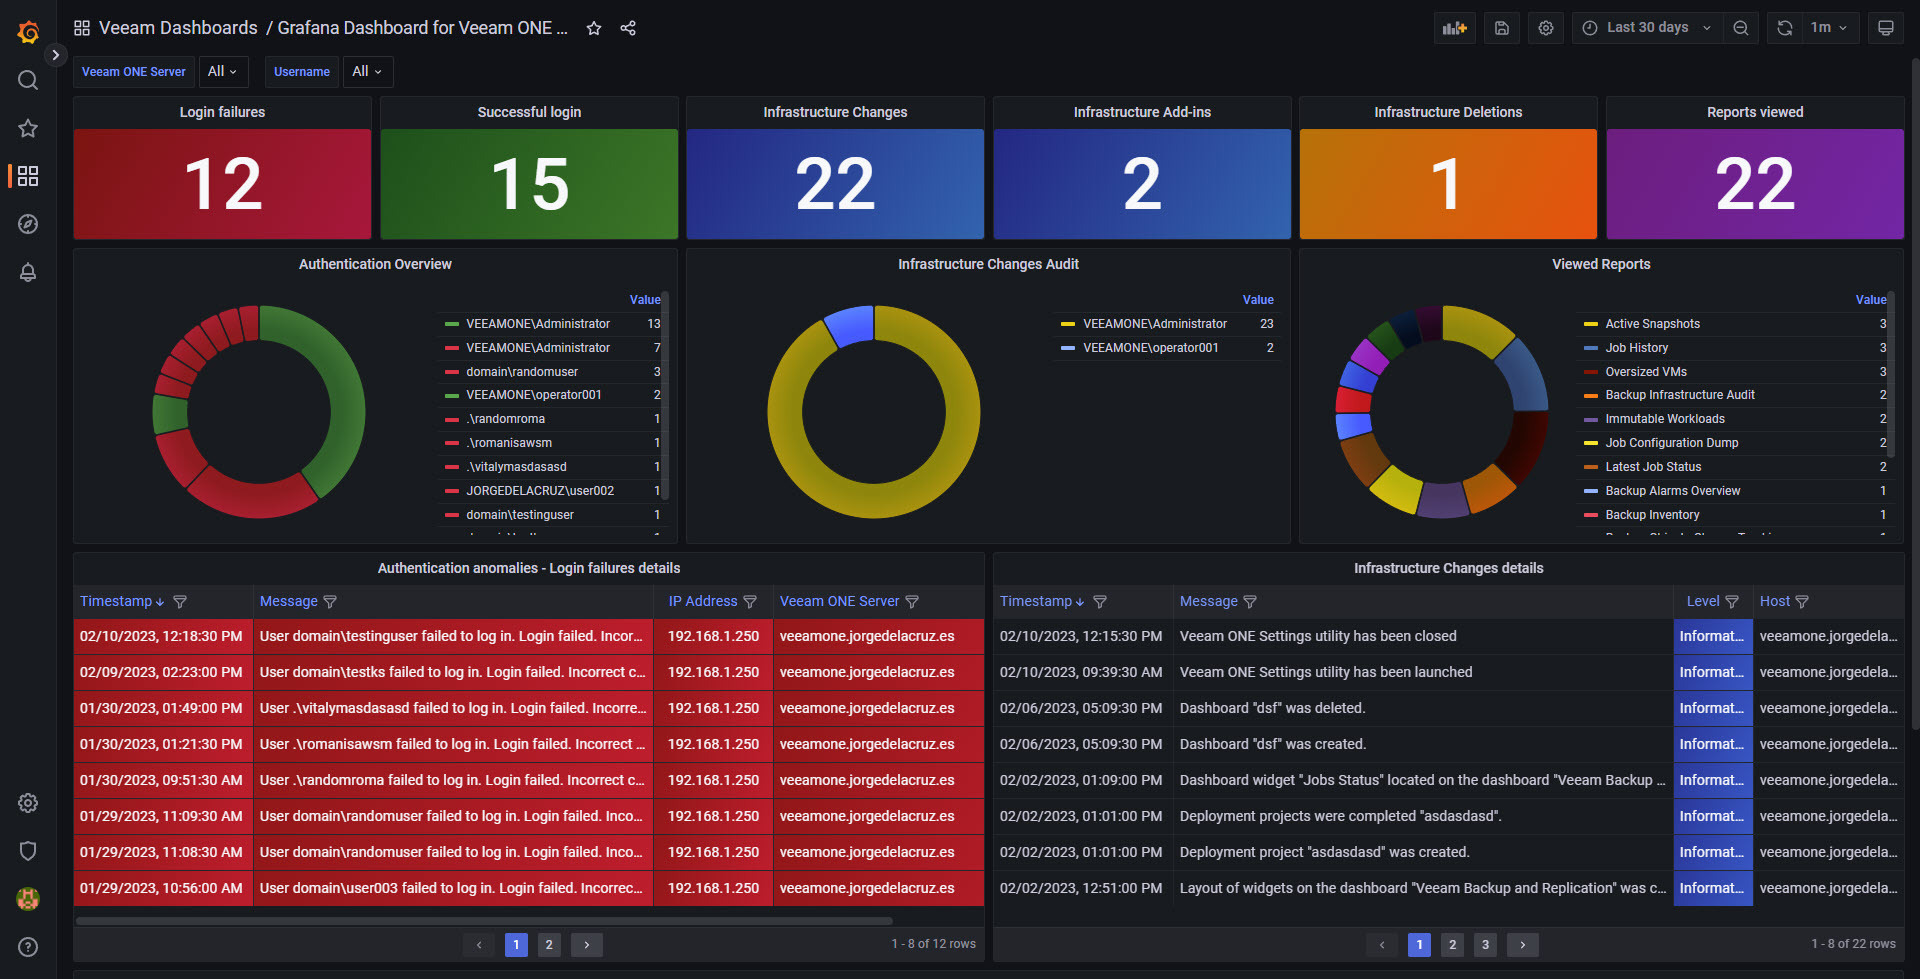
After you follow all the steps, you should see something like the next Dashboard, which updates in pretty much real-time, perfect to be on top of the authentication anomalies:

Please share your thoughts about the new VONE Audit feature, and the “How-to monitor the Monitor” :) thanks a lot!


