Monitoring of Capacity Tier Jobs and Tasks


Userlevel 7
Badge +6

Greetings Community,

I have been working for a few weeks on parsing all things Veeam Logs, deep stuff that is for sure. On this specific Post I want to cover the Monitoring of the Capacity Tier Jobs and Tasks.

This is work in progress, so I am writing this post seeking help from you, to try it on your lab, or on your environments (always remembering it is Community Stuff and not supported)

System Requirements

  • You should have Telegraf+InfluxDB+Grafana installed
  • Grafana should be the version 8.0.2 - In case you have an inferior version, or superior, please just run this sudo apt-get install grafana=8.0.2
  • You should have telegraf installed on the VBR, I hope properly configured sending metrics to your InfluxDB. Ping me if need anything. But it is really simple.
  • The telegraf.conf at the end should contain this at the end of the file (this is the fairy dust that makes us fly :))
# Offload Job - ID and final status
[[inputs.tail]]
files = ["C:\\ProgramData\\Veeam\\Backup\\*\\Offload*.log"]
from_beginning = true
name_override = "veeam_capacitytier_offload"
watch_method = "poll"

grok_patterns = ['%{CAPACITYTIER_LOG}']
grok_custom_patterns = '''
DATESTAMP_VEEAM %{MONTHDAY}.%{MONTHNUM}.%{YEAR} %{TIME}
CAPACITYTIER_LOG \[%{DATESTAMP_VEEAM:timestamp:ts-"2.1.2006 15:04:05"}\] \<%{NUMBER:nrjob}\> %{WORD}%{SPACE}%{WORD}%{SPACE}%{WORD}%{SPACE} '%{DATA:jobid:tag}' has been completed, status: '%{DATA:status:tag}', '%{DATA:totaltransferred} %{DATA:valuetransferred:tag}' of '%{DATA:sourcetransferred} %{DATA:valuesource:tag}' bytes, '%{DATA:totaltasks}' of '%{DATA:sourcetasks}' tasks, '%{DATA:taskoverviewsuccess}' successful, '%{DATA:taskoverviewfailed}' failed
'''
data_format = "grok"

# Offload Job - Task ID and final status per VM
[[inputs.tail]]
files = ["C:\\ProgramData\\Veeam\\Backup\\SOBR_Offload_*\\*\\Task.*.log"]
from_beginning = true
name_override = "veeam_capacitytier_offload_vm"
watch_method = "poll"

grok_patterns = ['%{CAPACITYTIER_VM_JOBID_LOG}','%{CAPACITYTIER_VM_TASKID_LOG}','%{CAPACITYTIER_VM_BOTTLENECK_LOG}','%{CAPACITYTIER_VM_TASKSTATUS_LOG}'
]
grok_custom_patterns = '''
DATESTAMP_VEEAM %{MONTHDAY}.%{MONTHNUM}.%{YEAR} %{TIME}
CAPACITYTIER_VM_JOBID_LOG \[%{DATESTAMP_VEEAM:timestamp:ts-"2.1.2006 15:04:05"}\] \<%{NUMBER:nrjobid}\> %{WORD}%{SPACE}\[%{WORD}\]%{SPACE}%{WORD} '%{DATA:jobid:tag}'
CAPACITYTIER_VM_TASKID_LOG \[%{DATESTAMP_VEEAM:timestamp:ts-"2.1.2006 15:04:05"}\] \<%{NUMBER:nrtaskid}\> %{WORD}%{SPACE}Set status '%{WORD}' for task session '%{DATA:taskid:tag}', object name '%{DATA:protectedvm:tag}'
CAPACITYTIER_VM_BOTTLENECK_LOG \[%{DATESTAMP_VEEAM:timestamp:ts-"2.1.2006 15:04:05"}\] \<%{NUMBER:nrbottleneck}\> %{WORD}%{SPACE} Busy: Source %{NUMBER:source}% > Proxy %{NUMBER:proxy}% > Network %{NUMBER:network}% > Target %{NUMBER:target}%
CAPACITYTIER_VM_TASKSTATUS_LOG \[%{DATESTAMP_VEEAM:timestamp:ts-"2.1.2006 15:04:05"}\] \<%{NUMBER:nrvmtask}\> %{WORD}%{SPACE}Task session \[%{DATA:taskid:tag}] has been completed, status: %{DATA:status:tag}, %{DATA:totaltransferred} of %{DATA:sourcetransferred} bytes
'''
data_format = "grok"

After this, just restart telegraf service and it should start parsing everything, in real-time and without impacting VBR, even if parsing years of logs.

Grafana Dashboard

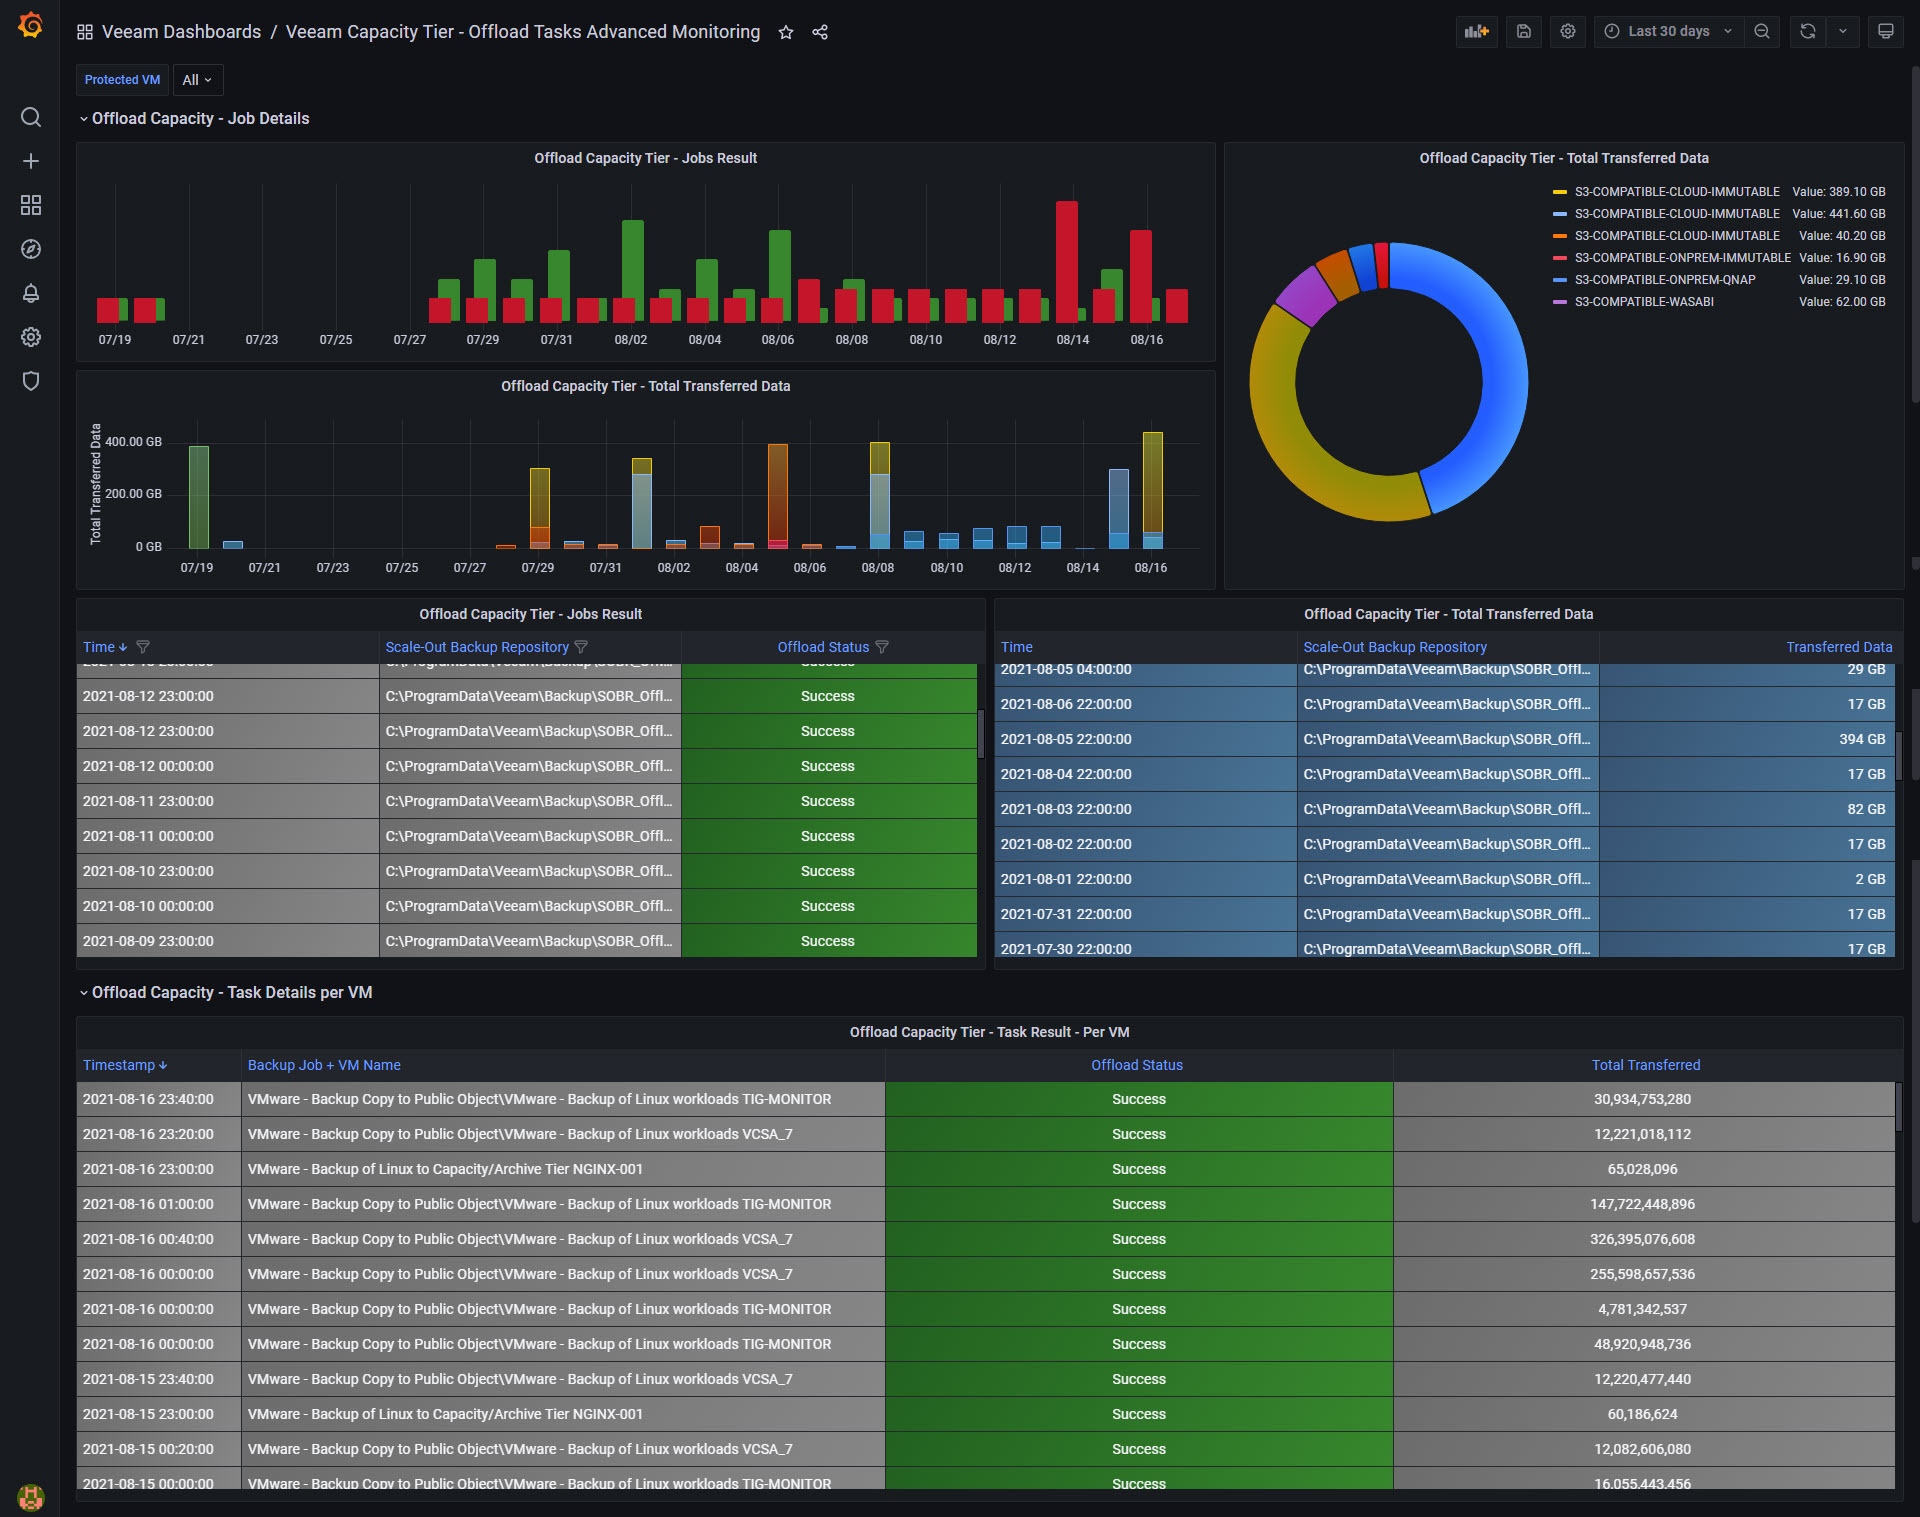
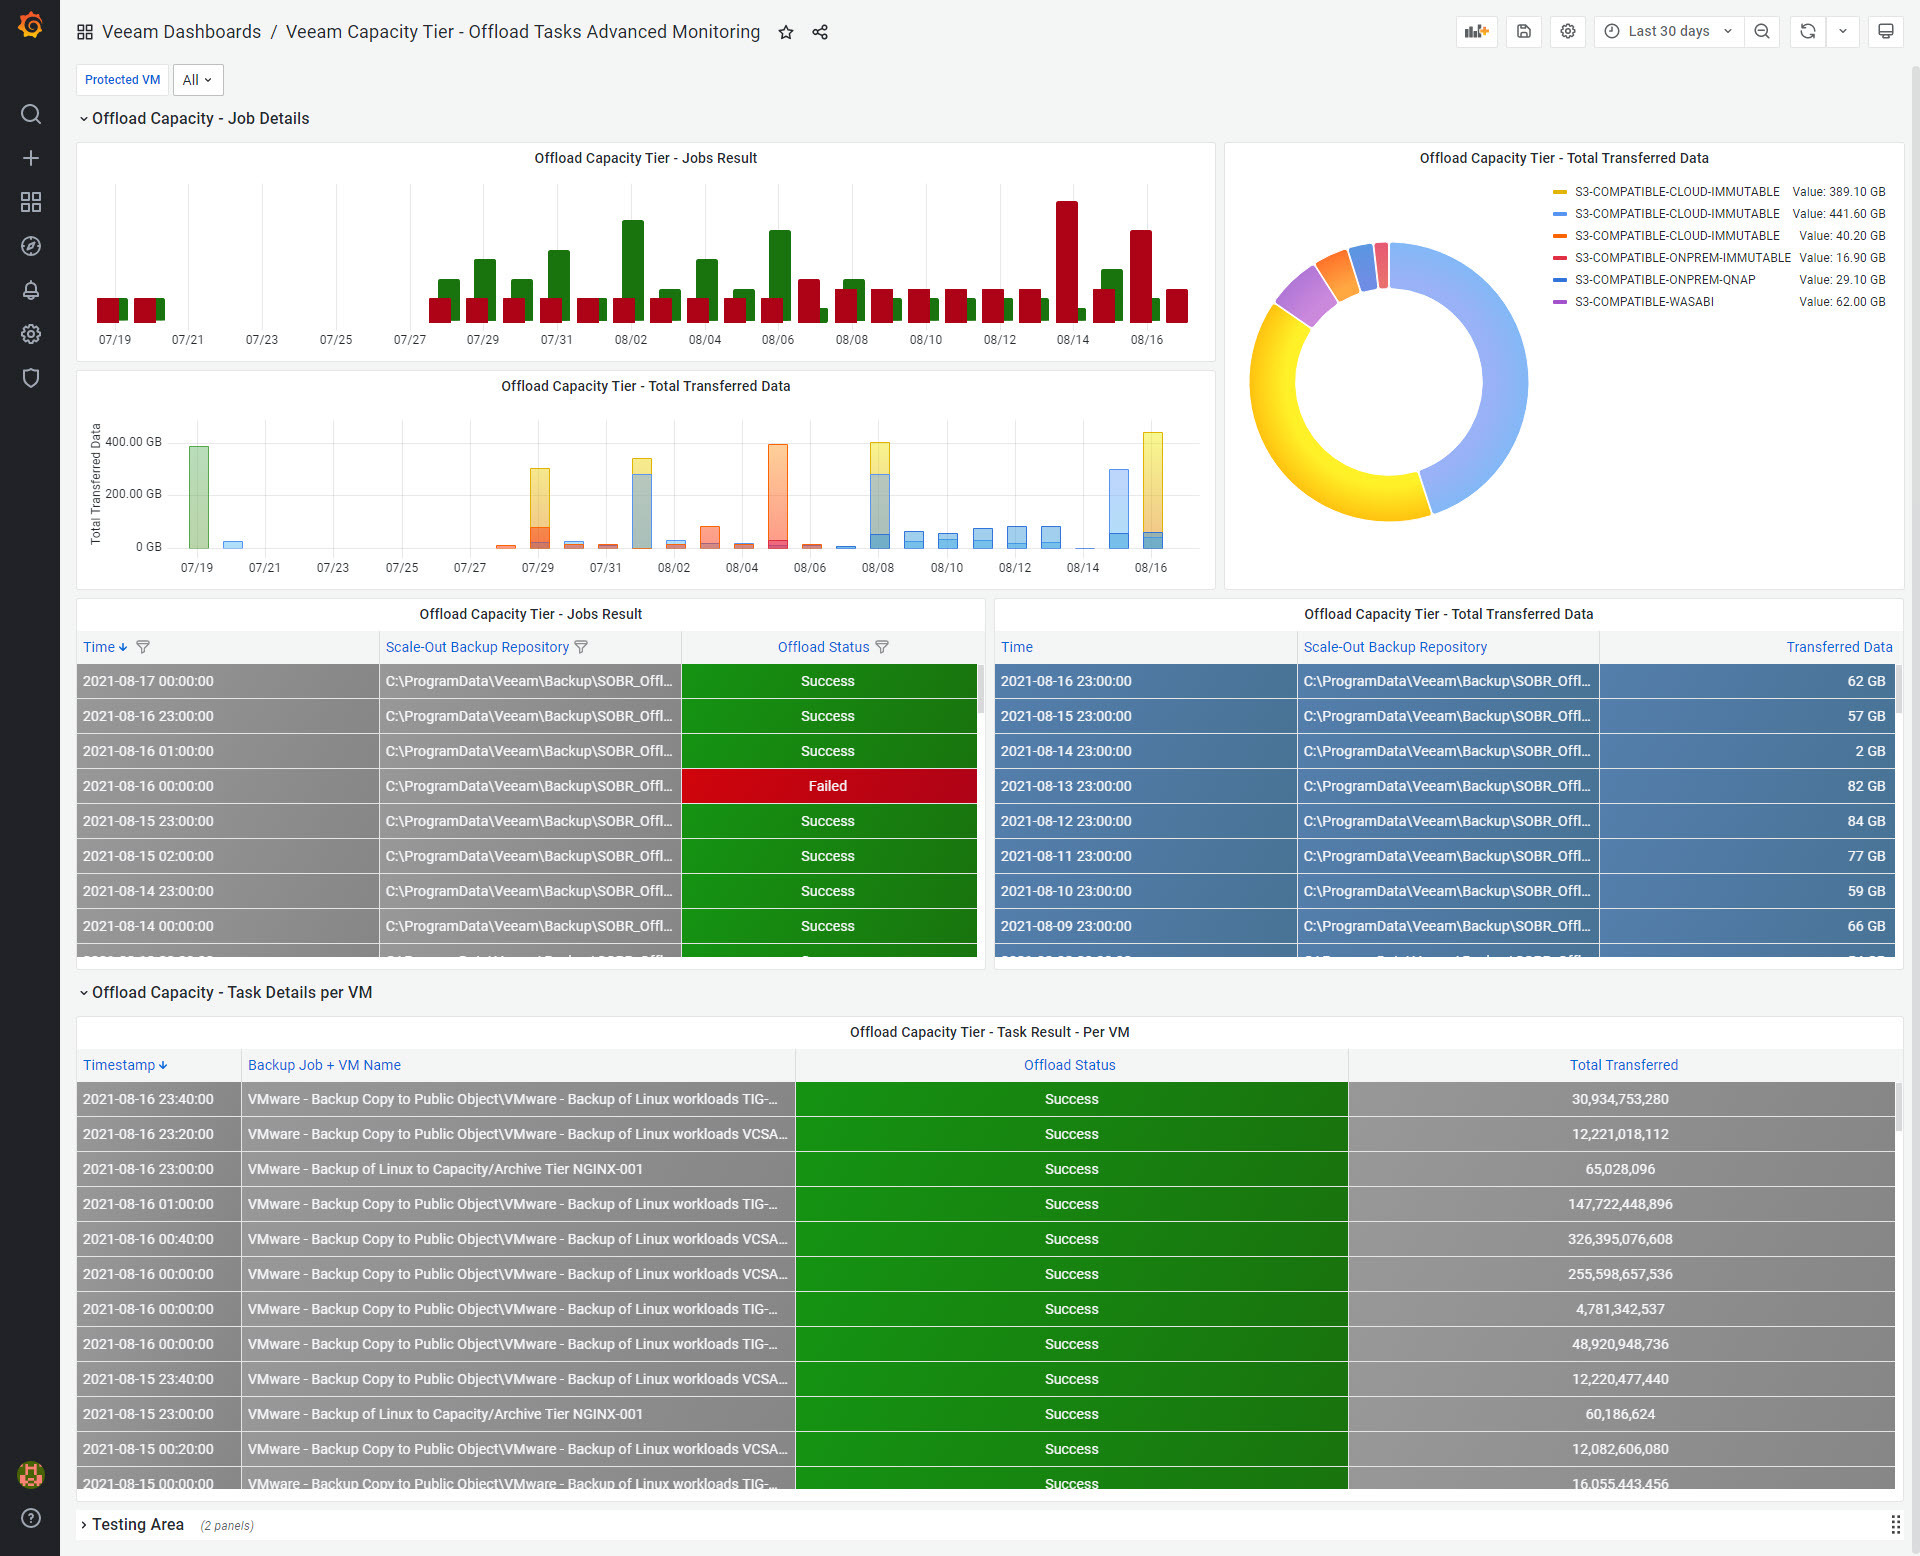
I will not give you something without the proper Dashboard to follow, just download the next .json and import it on your Grafana as per usual - Download now If all is as it should be, you should see something cool like this:

Dark theme

Light theme

As said at the start of the post, your help would be welcome, feedback, ideas, etc. Still work in progress, and better parsing is needed, etc. Thanks guys!


18 comments

Userlevel 7
Badge +20

Awesome post. Always wanted to look in to Grafana now is a better time than any. 😂

Userlevel 7
Badge +11

Wow, awesome post @jorge.delacruz.


So, the correctflow is Telegraf send data to InfluxDB and Grafana read InfluxDB.

Is it right?

Userlevel 7
Badge +6

Hello,

That is exactly right @wolff.mateus telegraf is a lightweight agent that, in this case, parses the Logs as you have added the magic recipe to your telegraf.conf, then that info is sent to InfluxDB, and then with Grafana you show it in a very nice format, which is all built and works out of the box :)

With the top right date selection the Dashboard changes dynamically to show you more, or less, Capacity Tier Tasks.

Let me know :)

Userlevel 7
Badge +11

Hello,

That is exactly right @wolff.mateus telegraf is a lightweight agent that, in this case, parses the Logs as you have added the magic recipe to your telegraf.conf, then that info is sent to InfluxDB, and then with Grafana you show it in a very nice format, which is all built and works out of the box :)

With the top right date selection the Dashboard changes dynamically to show you more, or less, Capacity Tier Tasks.

Let me know :)

Im gonna do some labs about that!

Do you use one VM per service? For example, 1 VM to InfluxDB and 1 BM to Grafana or make it all in one?

What distro Linux do you often use?


Userlevel 7
Badge +6

Hello @wolff.mateus I usually have one single VM for everything, if you are looking for a step-by-step that works out of the box:

Let me know when you get to the Veeam part! We have so many other Veeam stuff monitored with this TIG Stack, but if you can give me feedback on this, that will be awesome.

Let me know, mate.

Userlevel 7
Badge +11

Hello @wolff.mateus I usually have one single VM for everything, if you are looking for a step-by-step that works out of the box:

Let me know when you get to the Veeam part! We have so many other Veeam stuff monitored with this TIG Stack, but if you can give me feedback on this, that will be awesome.

Let me know, mate.

Yeah! I think that I can help and feedback you with something!

But on this last link that you send I see Telegraf installation on Linux.

Is it not made on Veeam B&R?

Userlevel 7
Badge +6

Yes, that is telegraf in Linux, which you can skip, and then go just directly for the telegraf in Windows - https://docs.influxdata.com/telegraf/v1.19/administration/windows_service/

Which is really simple, download, put it on c:/program files/telegraf/telegraf.exe and the conf, make the needed changes to the [agent] to send the data to Influx, and then add at the end my recipe to the file, and restart the service.

Let me know.

Userlevel 7
Badge +9

These guides are really very basic. But for those of us that would like to install Grafana on Linux and Windows should use any of the guides below. In this way, you will be able to reproduce this awesome task.

- https://techdirectarchive.com/2020/07/02/how-to-install-grafana-on-ubuntu/

- https://techdirectarchive.com/2020/07/03/how-to-install-grafana-on-windows-10-and-windows-server/

Userlevel 7
Badge +9

Awesome post. Always wanted to look in to Grafana now is a better time than any. 😂

I have attached some links on how to go with the basic installation of Grafana on Windows or Linux. 

Userlevel 7
Badge +20

Awesome post. Always wanted to look in to Grafana now is a better time than any. 😂

I have attached some links on how to go with the basic installation of Grafana on Windows or Linux. 

Thanks.  Is there a separate post for this?  I would be interested to see them.

Userlevel 7
Badge +12

Awesome post. Always wanted to look in to Grafana now is a better time than any. 😂

I have attached some links on how to go with the basic installation of Grafana on Windows or Linux. 

Thanks.  Is there a separate post for this?  I would be interested to see them.

@Chris.Childerhose 

Yes, read 2 posts above your post. The links are posted there.

Userlevel 7
Badge +20

Awesome post. Always wanted to look in to Grafana now is a better time than any. 😂

I have attached some links on how to go with the basic installation of Grafana on Windows or Linux. 

Thanks.  Is there a separate post for this?  I would be interested to see them.

@Chris.Childerhose

Yes, read 2 posts above your post. The links are posted there.

Ah yes my bad I thought it was another post altogether 😂

Userlevel 7
Badge +20

These guides are really very basic. But for those of us that would like to install Grafana on Linux and Windows should use any of the guides below. In this way, you will be able to reproduce this awesome task.

- https://techdirectarchive.com/2020/07/02/how-to-install-grafana-on-ubuntu/

- https://techdirectarchive.com/2020/07/03/how-to-install-grafana-on-windows-10-and-windows-server/

Thanks for posting these. Will check them out to get started.

Userlevel 7
Badge +9

Awesome post. Always wanted to look in to Grafana now is a better time than any. 😂

I have attached some links on how to go with the basic installation of Grafana on Windows or Linux. 

Thanks.  Is there a separate post for this?  I would be interested to see them.

@Chris.Childerhose

Yes, read 2 posts above your post. The links are posted there.

Ah yes my bad I thought it was another post altogether 😂

 I am sorry I responded late, I was on the road all through! 

Userlevel 7
Badge +9

These guides are really very basic. But for those of us that would like to install Grafana on Linux and Windows should use any of the guides below. In this way, you will be able to reproduce this awesome task.

- https://techdirectarchive.com/2020/07/02/how-to-install-grafana-on-ubuntu/

- https://techdirectarchive.com/2020/07/03/how-to-install-grafana-on-windows-10-and-windows-server/

Thanks for posting these. Will check them out to get started.

You are welcome!

Userlevel 7
Badge +11

Nice post @jorge.delacruz , thx for sharing

Userlevel 7
Badge +6

Thanks so much guys for so much great comments and likes, please let me know if you have some time to test it.


Best regards

Userlevel 7
Badge +4

Good one @jorge.delacruz 

Comment