Hello Community!

For years, I have been Looking for the Perfect Dashboard, using different technologies and approaches, which includes Veeam ONE, Elastic, Splunk, and Grafana. All the mentioned technologies are great for deep visibility, log inspection, capacity planning, etc.

But as Veeam has been moving into the right direction of including RESTful API on all products, I finally decided myself to use a combination of Bash Shell Script, InfluxDB, and Grafana.

Here it is myself with a Grafana t-shirt I made, on the example monitoring Veeam :)


How does all of this looks like?

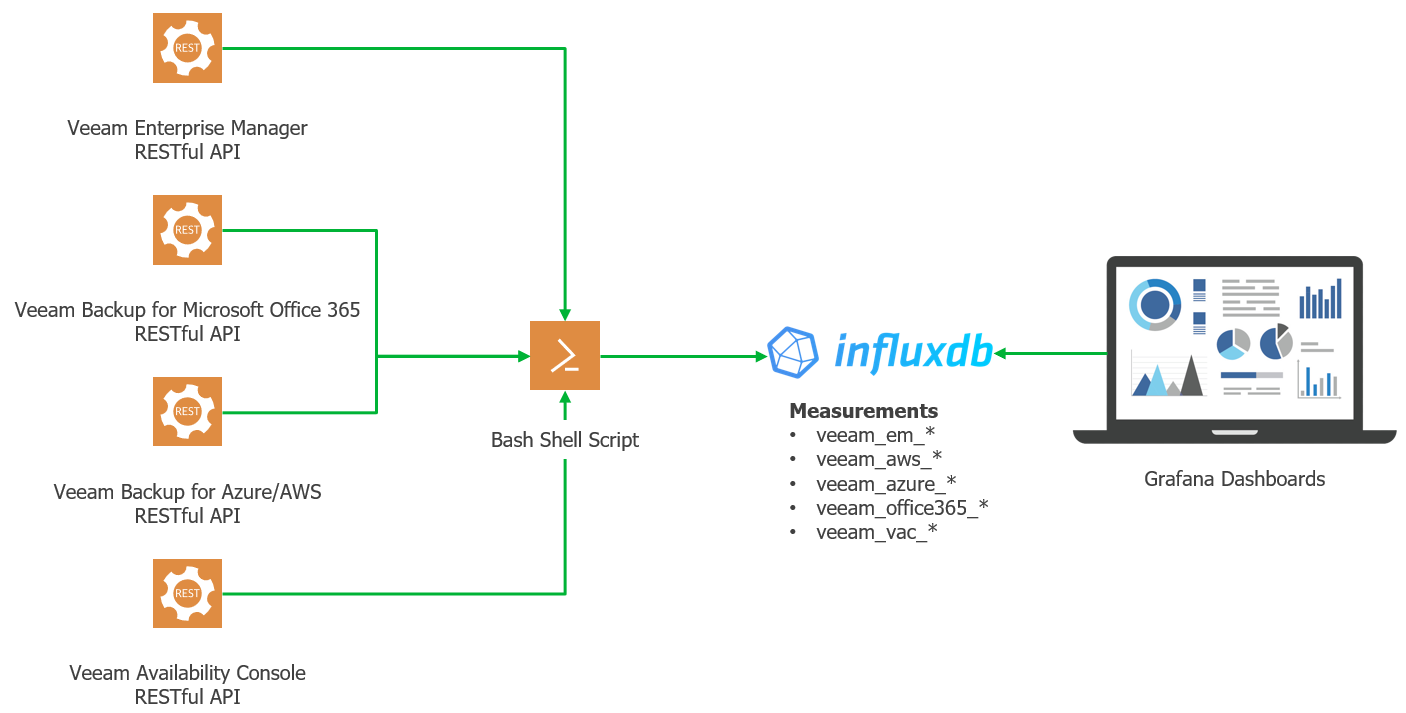
So, if you are wondering how all of this might look, it is indeed quite easy, so on the left we have all sort of Veeam Products, with their RESTful API, in this case:

Then we capture all with different bash shell scripts, one per product, save them to InfluxDB, and finally we visualize all that data with Grafana. Pretty neat isn’t?
 

What I usually need to get this up and running?

Now we understand the diagram, concept, and data flow. We will need:

  • The Veeam product we want to monitor, with proper license when required (Enterprise Manager requires Enterprise Plus or VUL), and the RESTful API enabled whenever required as well.
  • Download the Bash Shell Script for the Veeam product you want to monitor, luckily they can all be found here - https://github.com/VeeamHub/grafana
  • Finally, you will need a small VM, either on-prem, or in the Cloud, with InfluxDB, and Grafana installed and running. 

Veeam Grafana Dashboards ready-to-consume

As said, I have been working on this way of extracting data, and making it gorgeous, yet useful Dashboards, you can find them on the VeeamHub, but I want to show them over here so you can quickly watch them, and hopefully you find some ideas and inspiration:

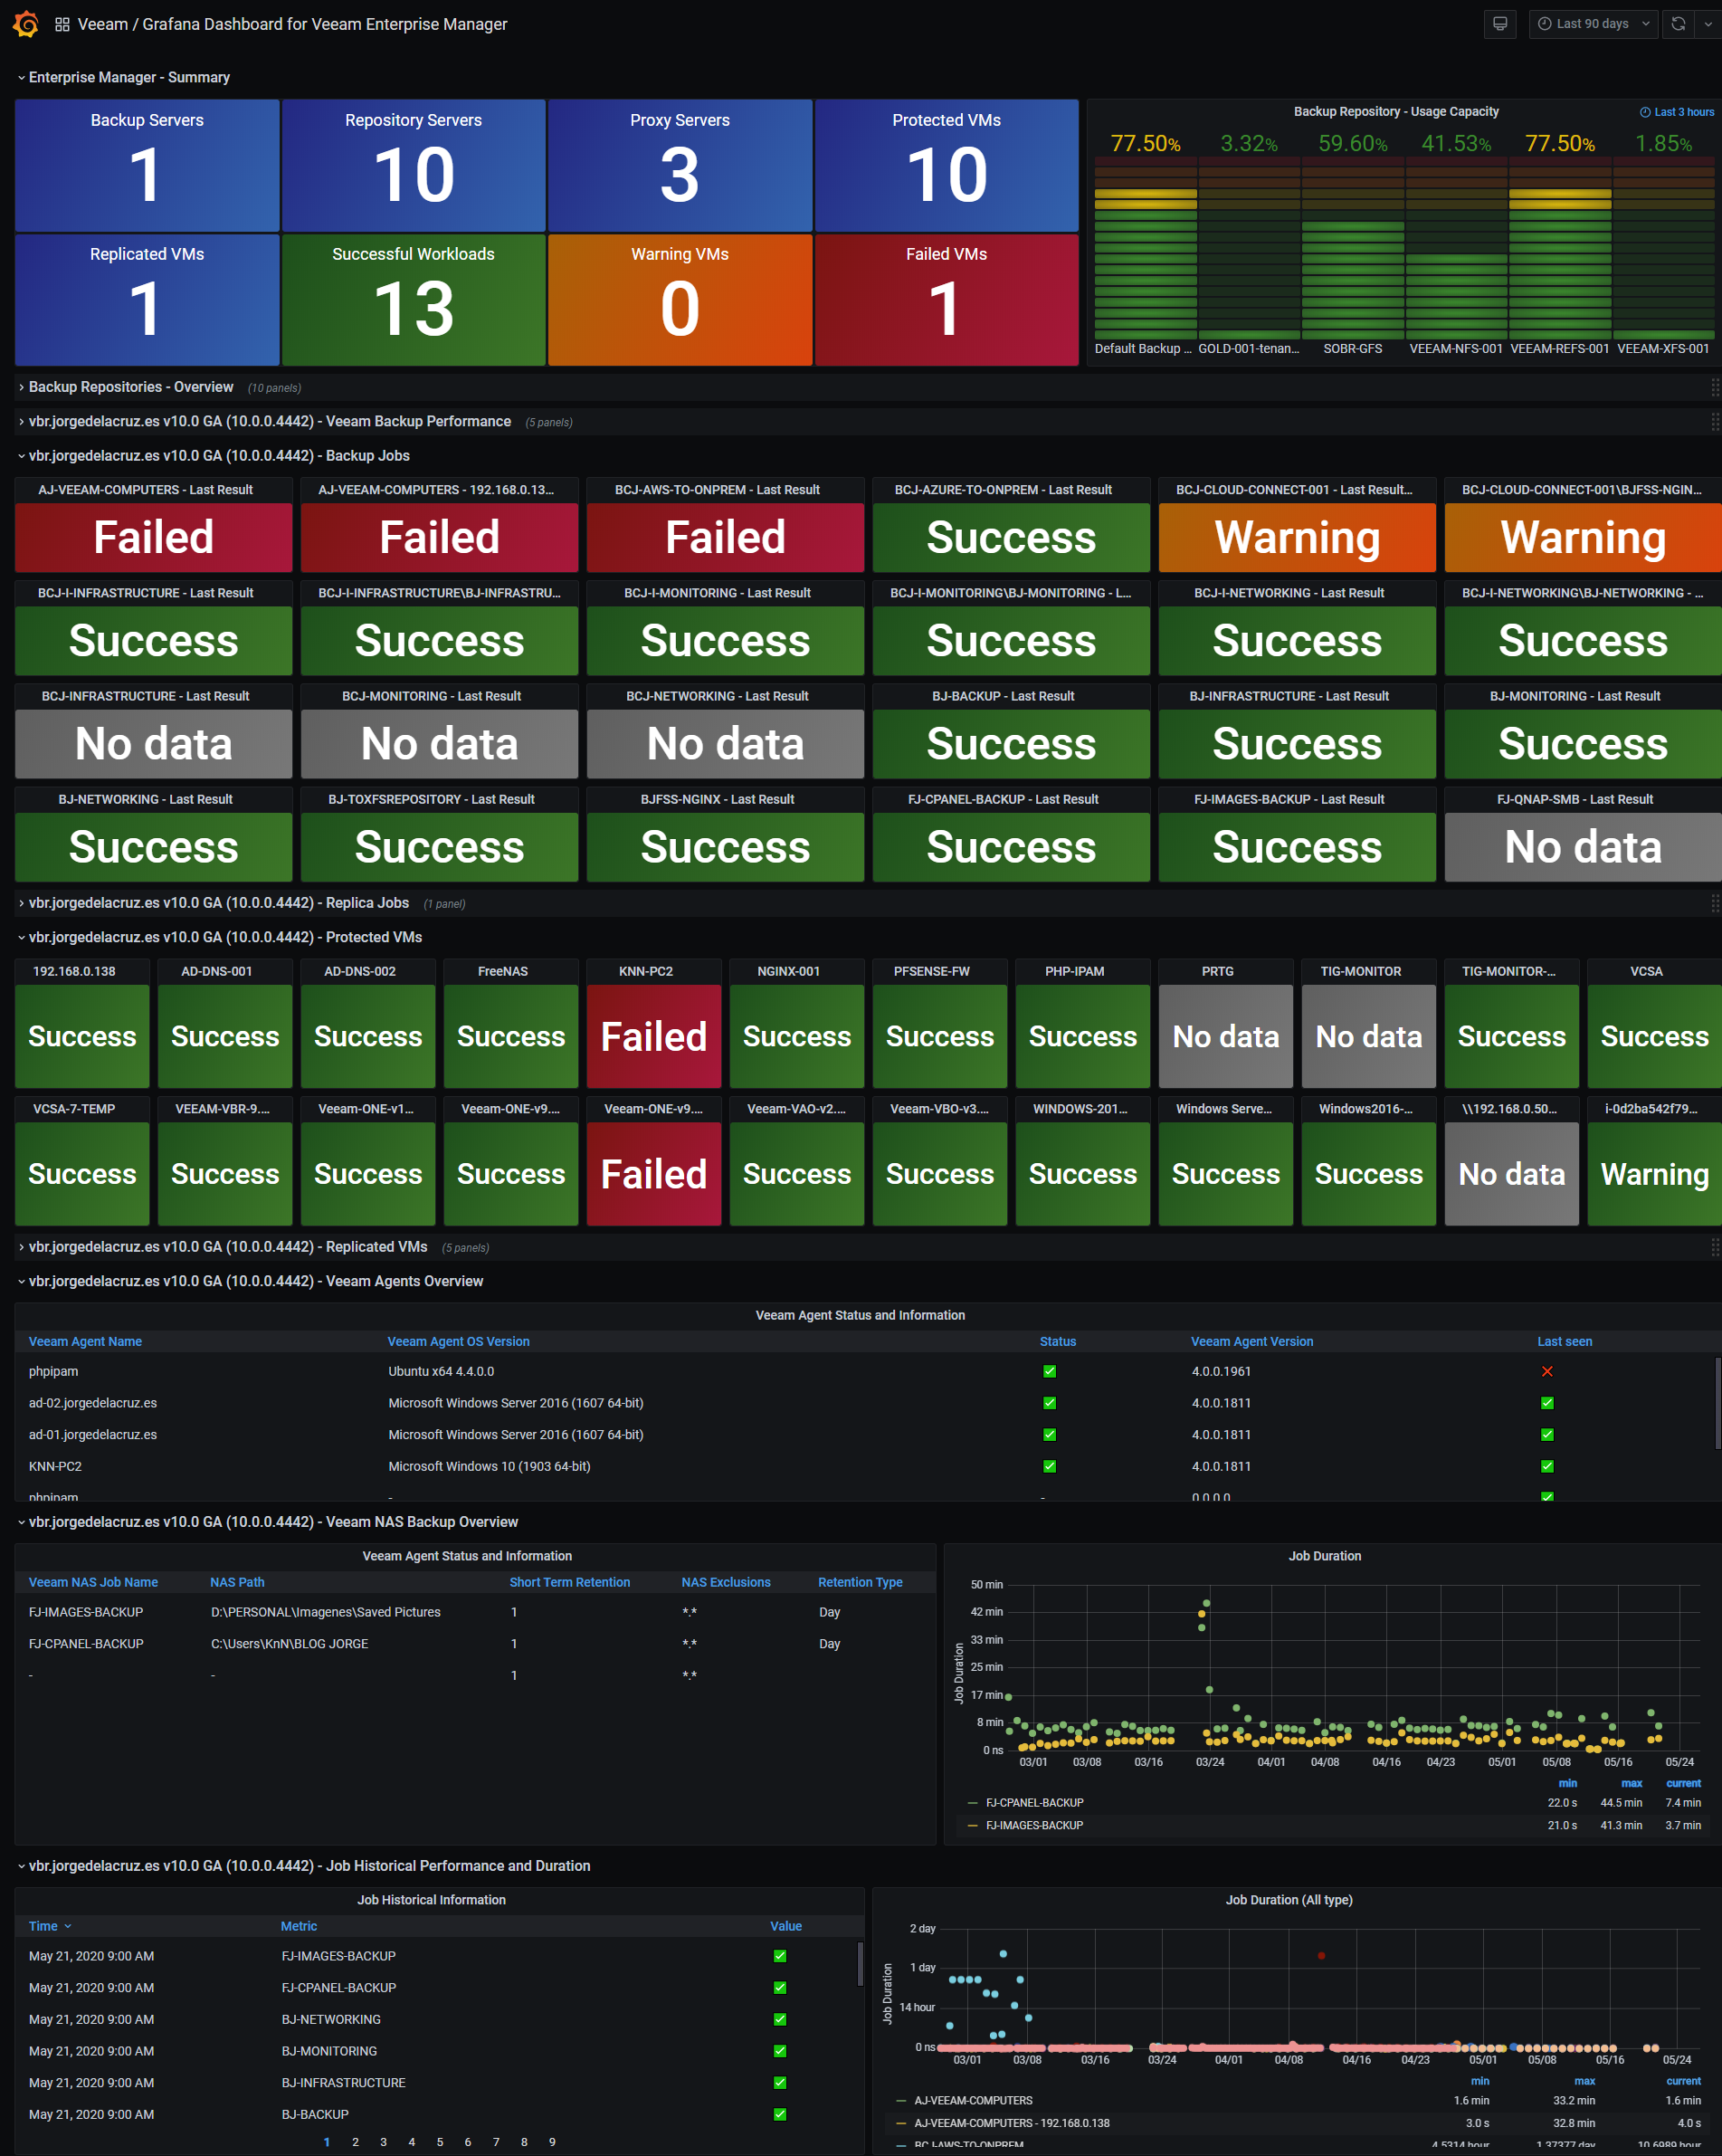
Veeam Enterprise Manager

A great dashboard that ingests all the data from Enterprise Manager RESTful API. Download it here - https://github.com/VeeamHub/grafana/tree/master/veeam-enterprise_manager-grafana
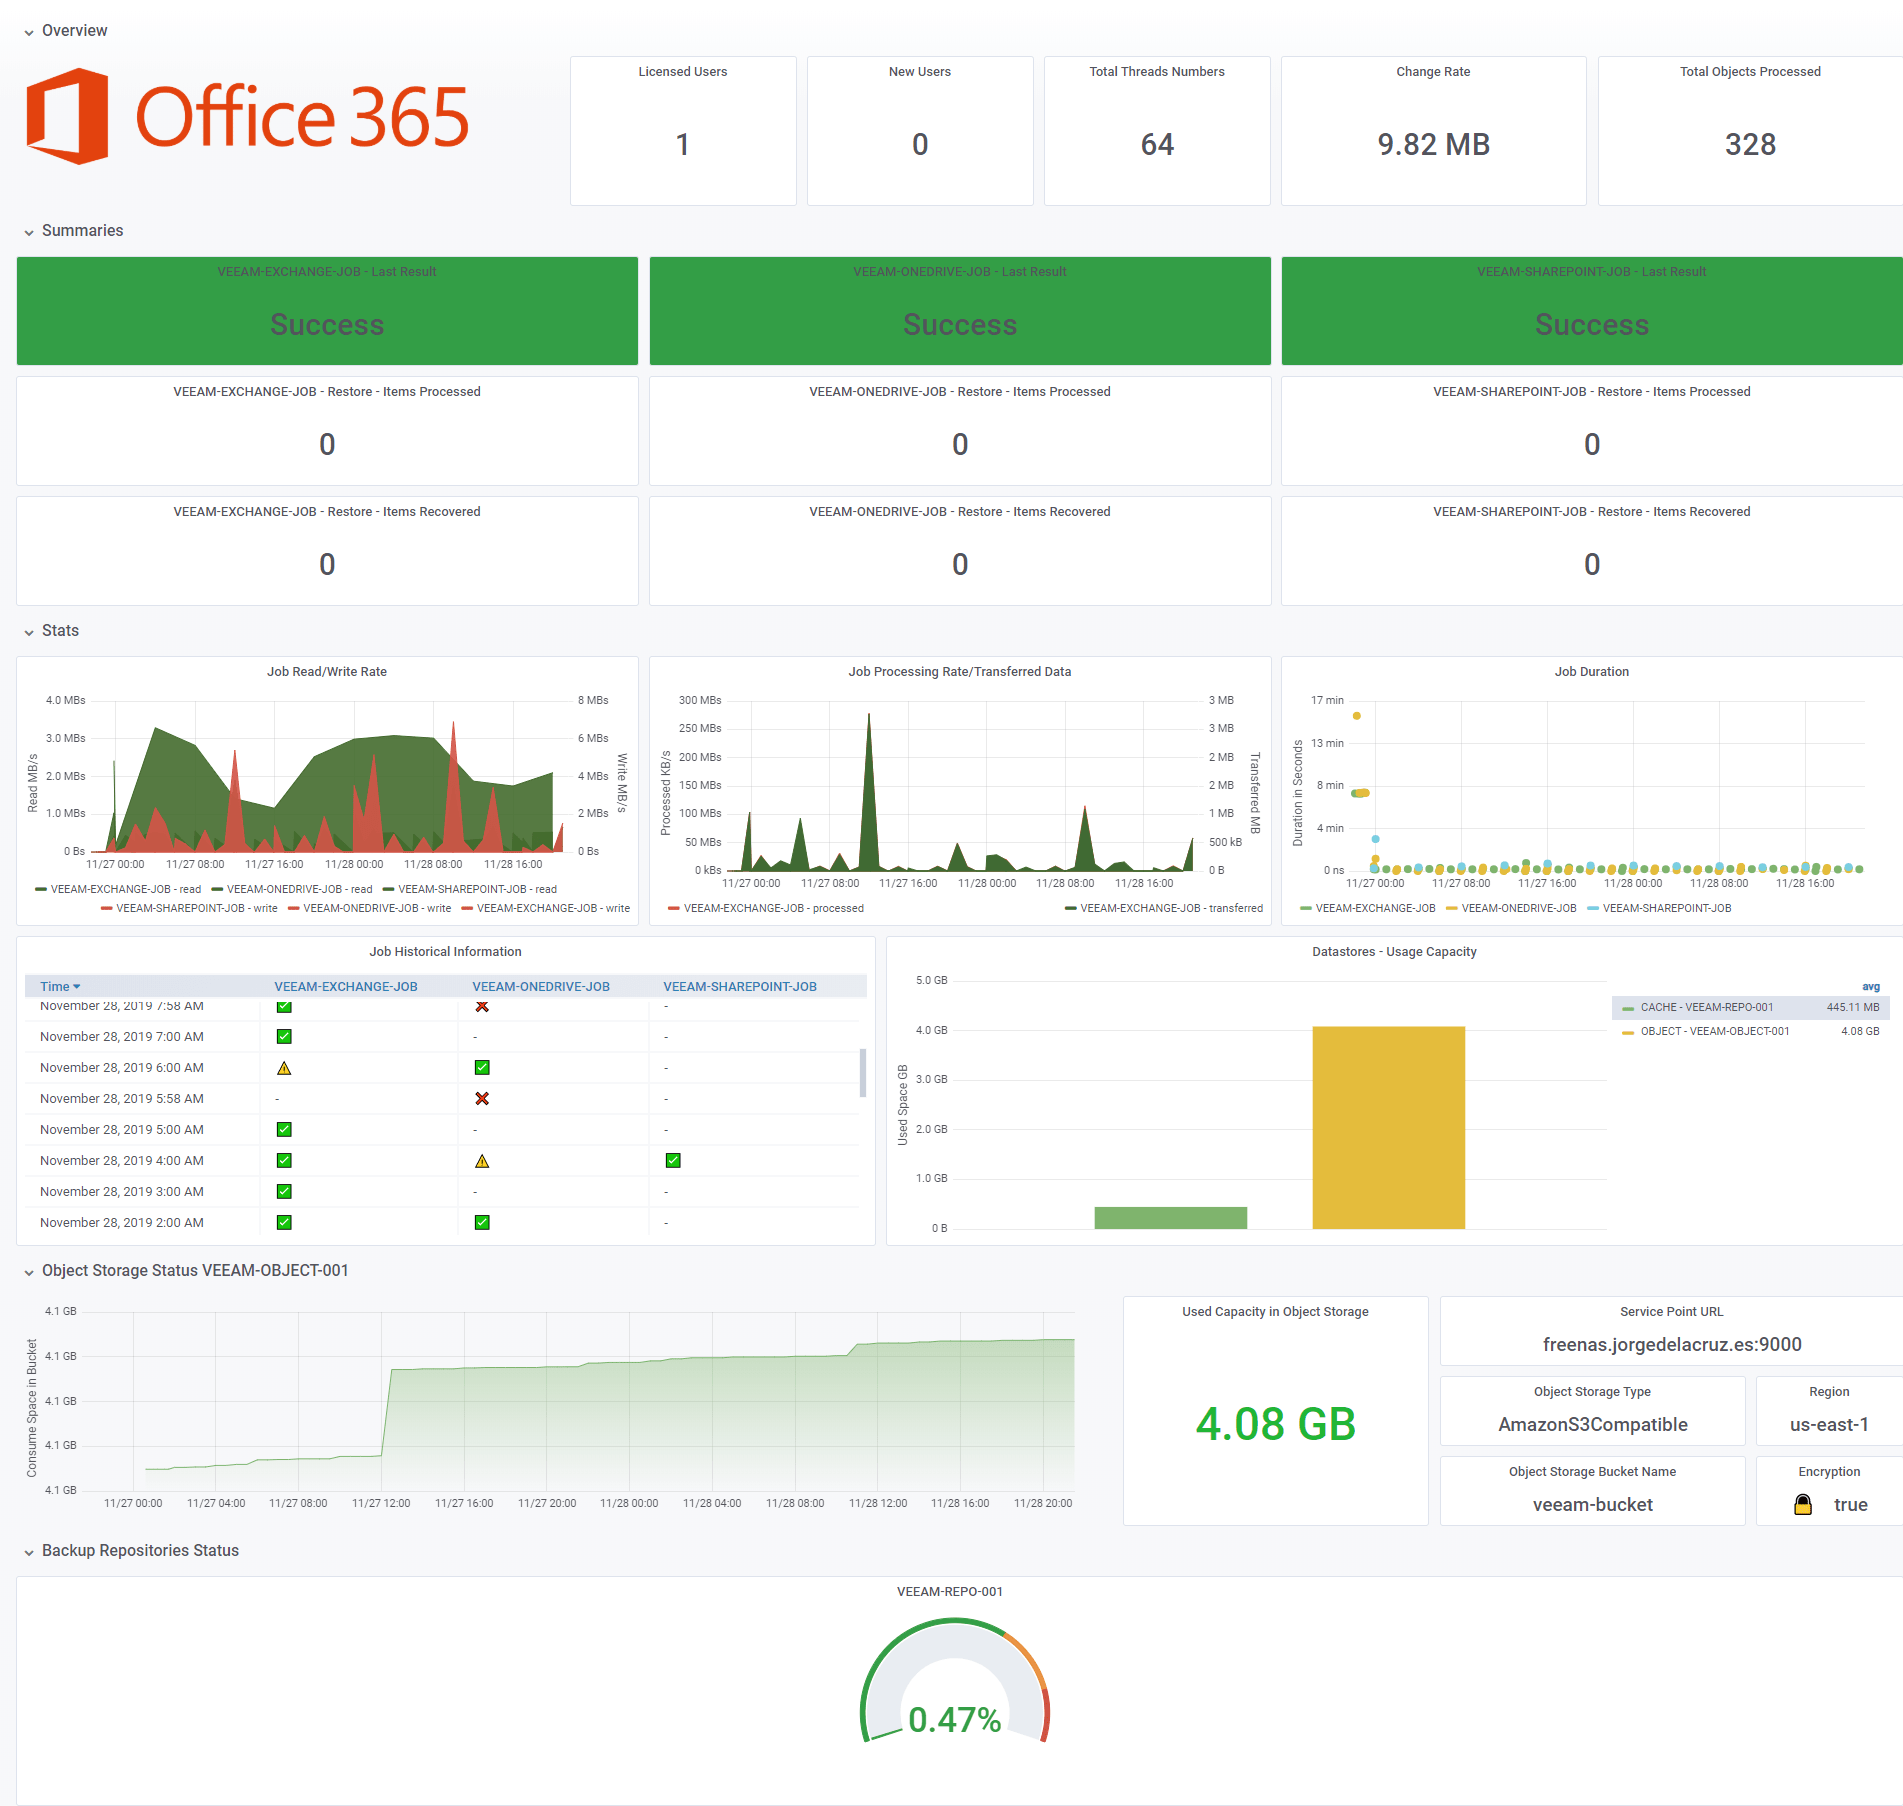
Veeam Backup for Microsoft Office 365

A great dashboard that ingests all the data from VBO RESTful API. Download it here - https://github.com/VeeamHub/grafana/tree/master/veeam-backup-for-office365-grafana
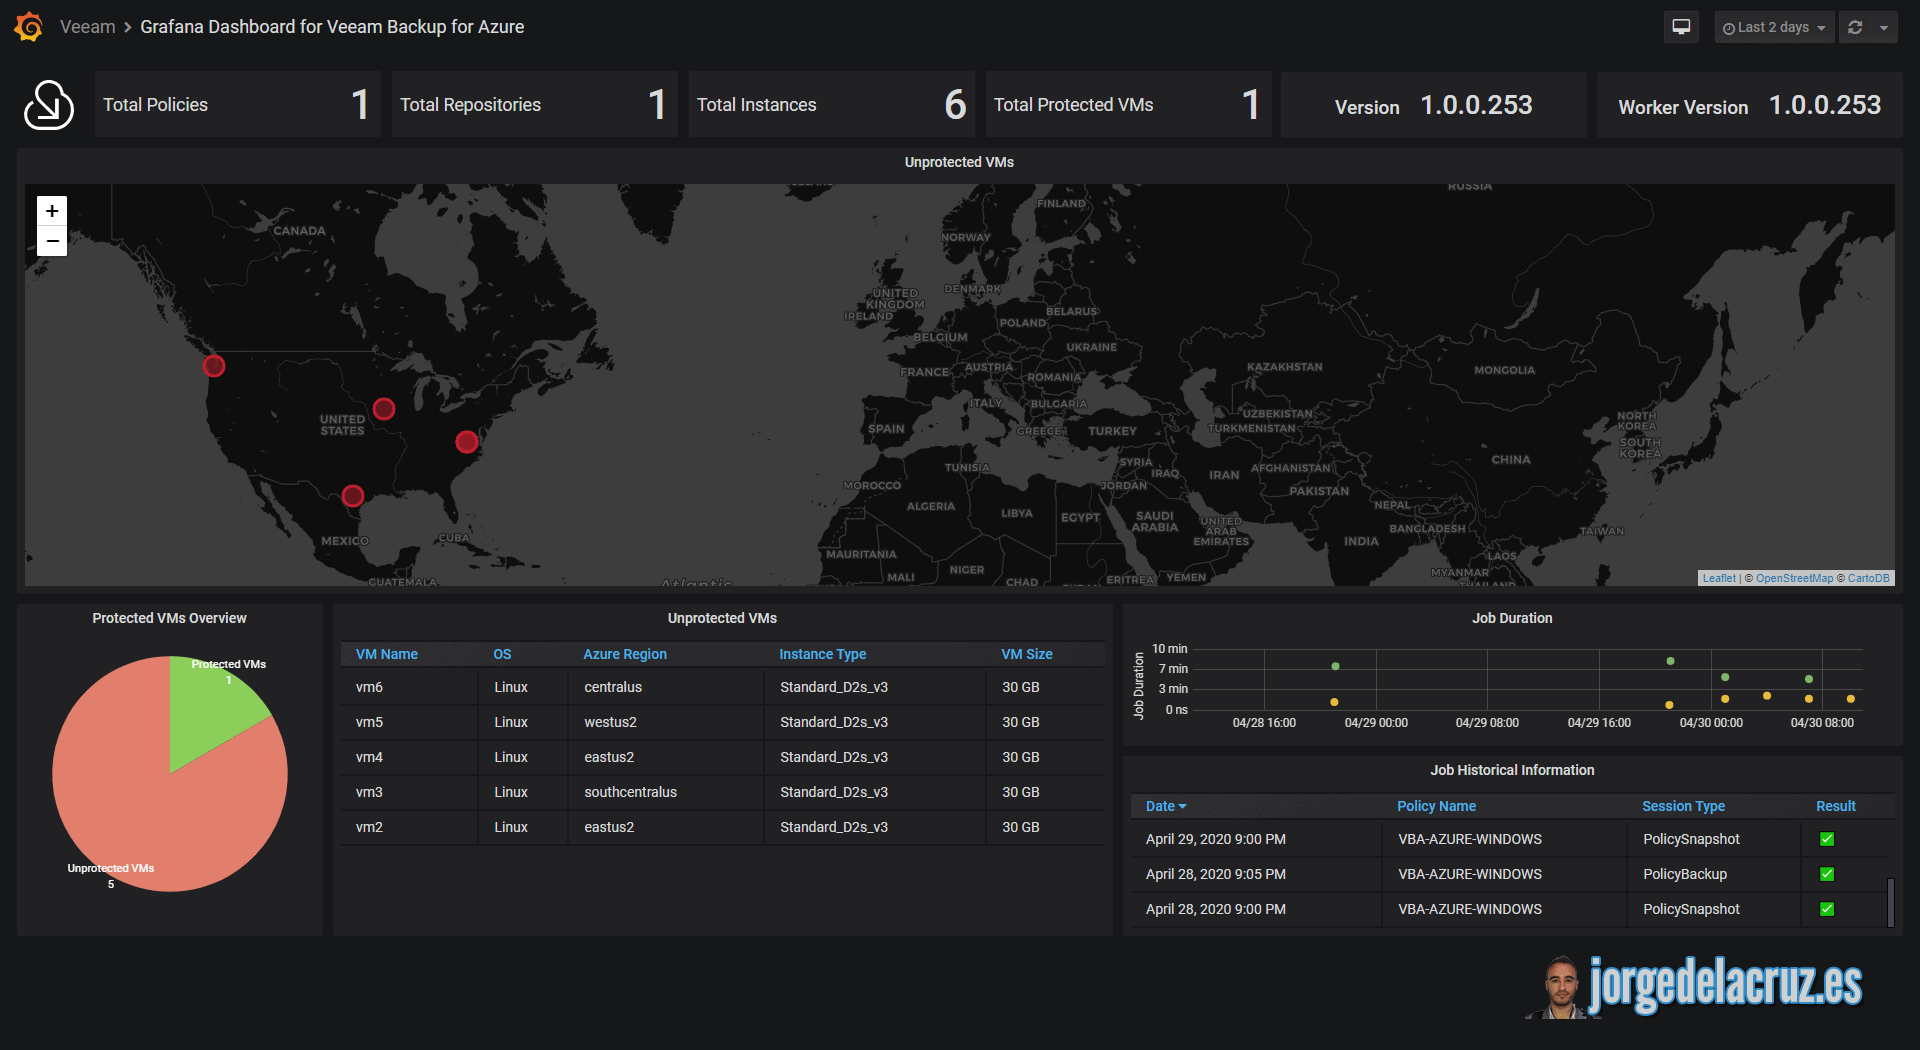
Veeam Backup for Azure

A great dashboard that ingests all the data from VBA Azure RESTful API. Download it here - https://github.com/VeeamHub/grafana/tree/master/veeam-backup-microsoft-azure-grafana
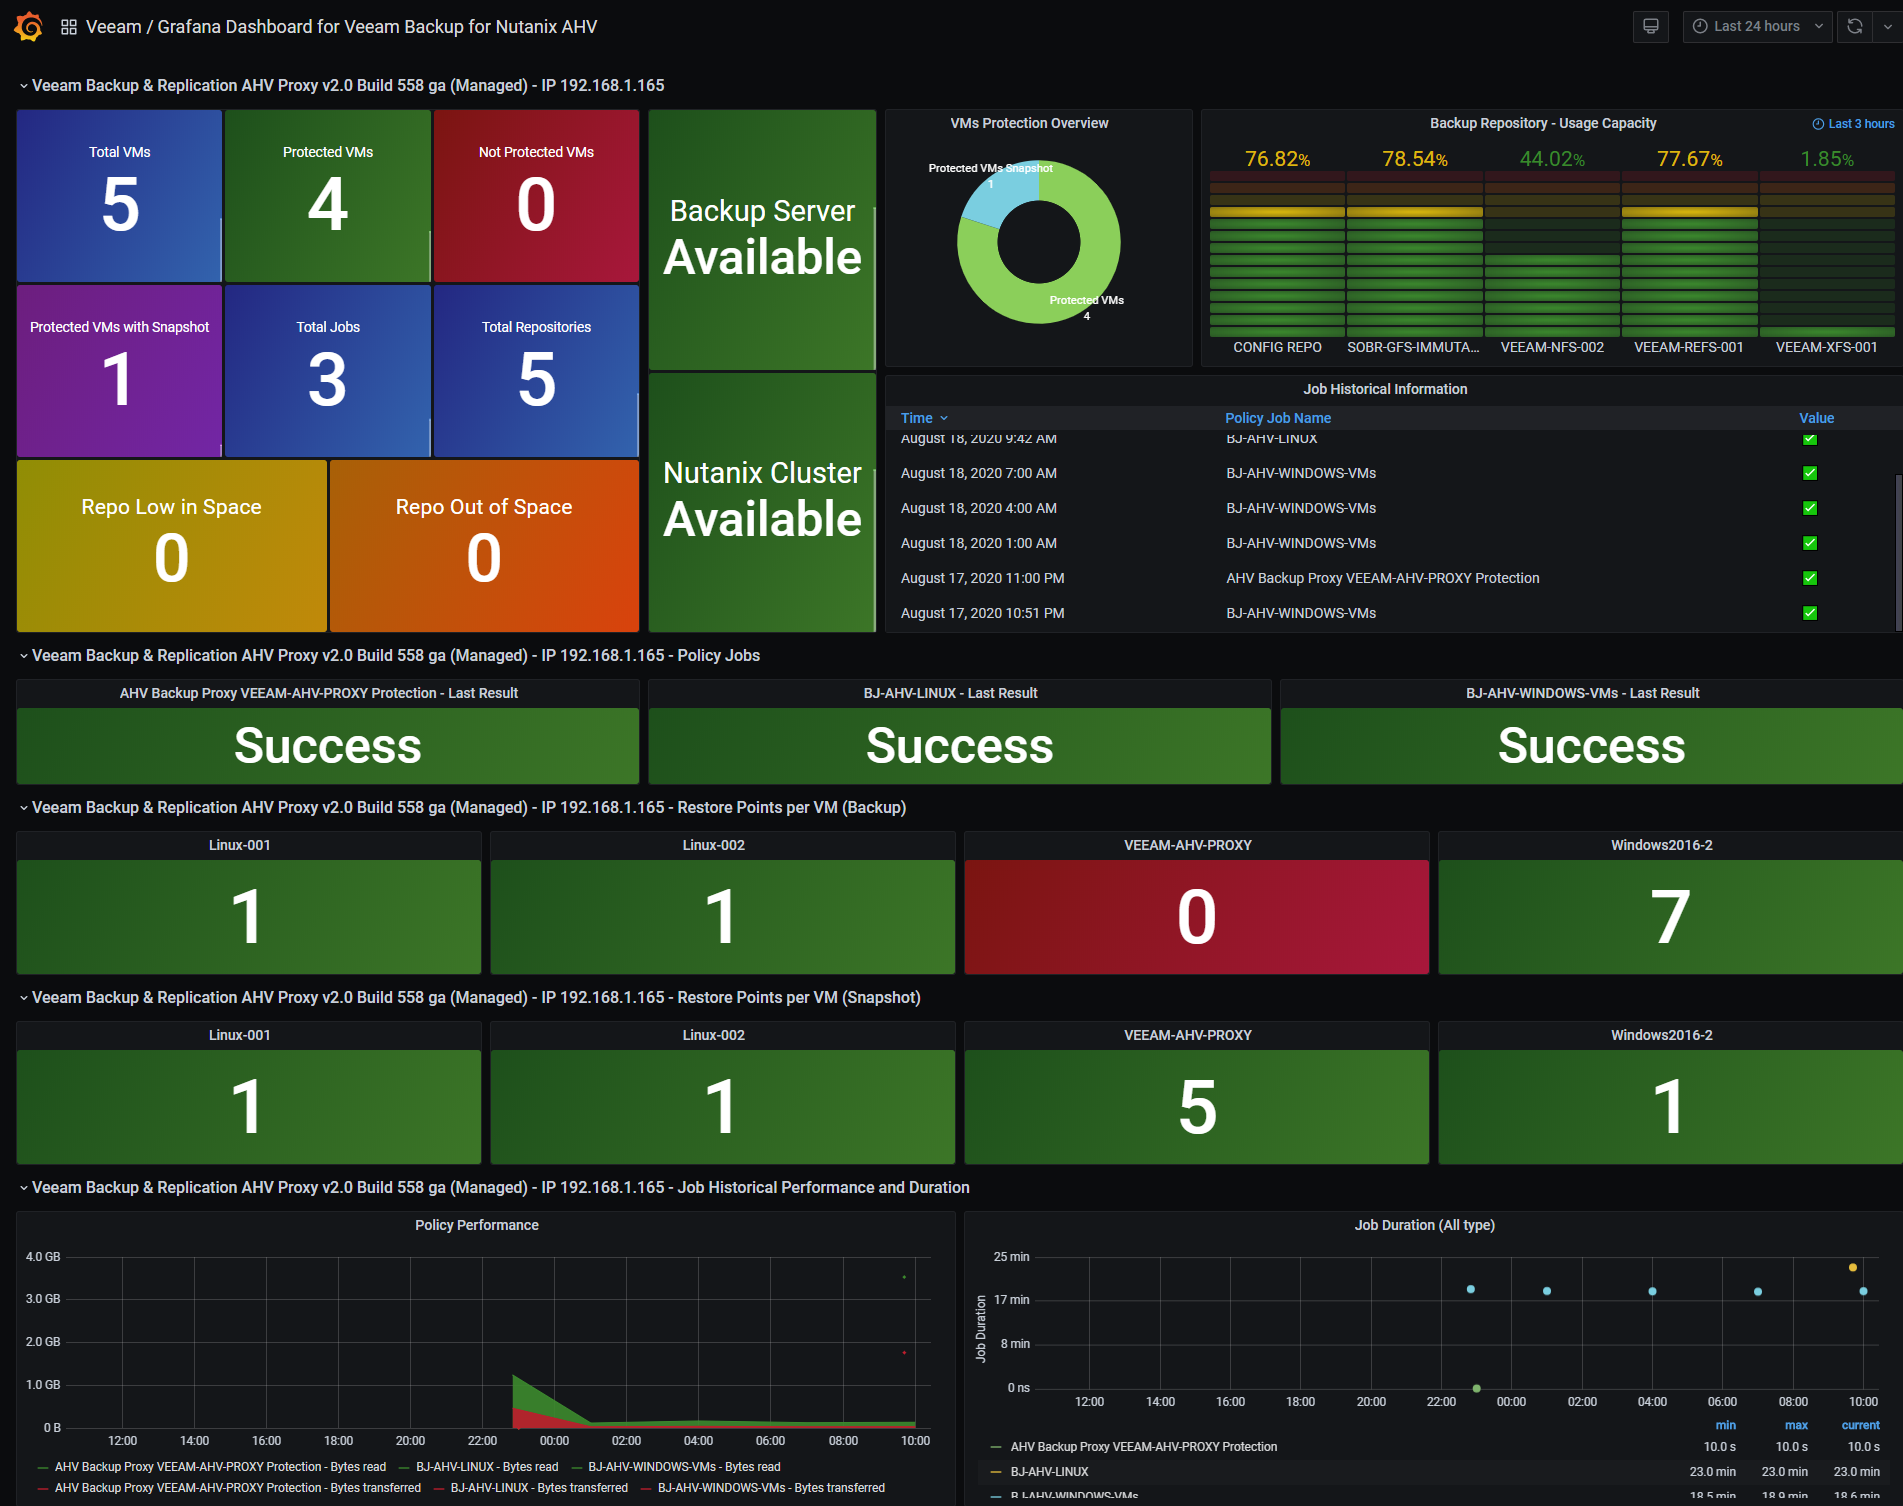
Veeam Backup for Nutanix AHV

An interesting Dashboard that looks at the RESTful API from VAN, extracts data, and finally you can see something like this - https://github.com/VeeamHub/grafana/tree/master/veeam_backup_nutanix_ahv-grafana
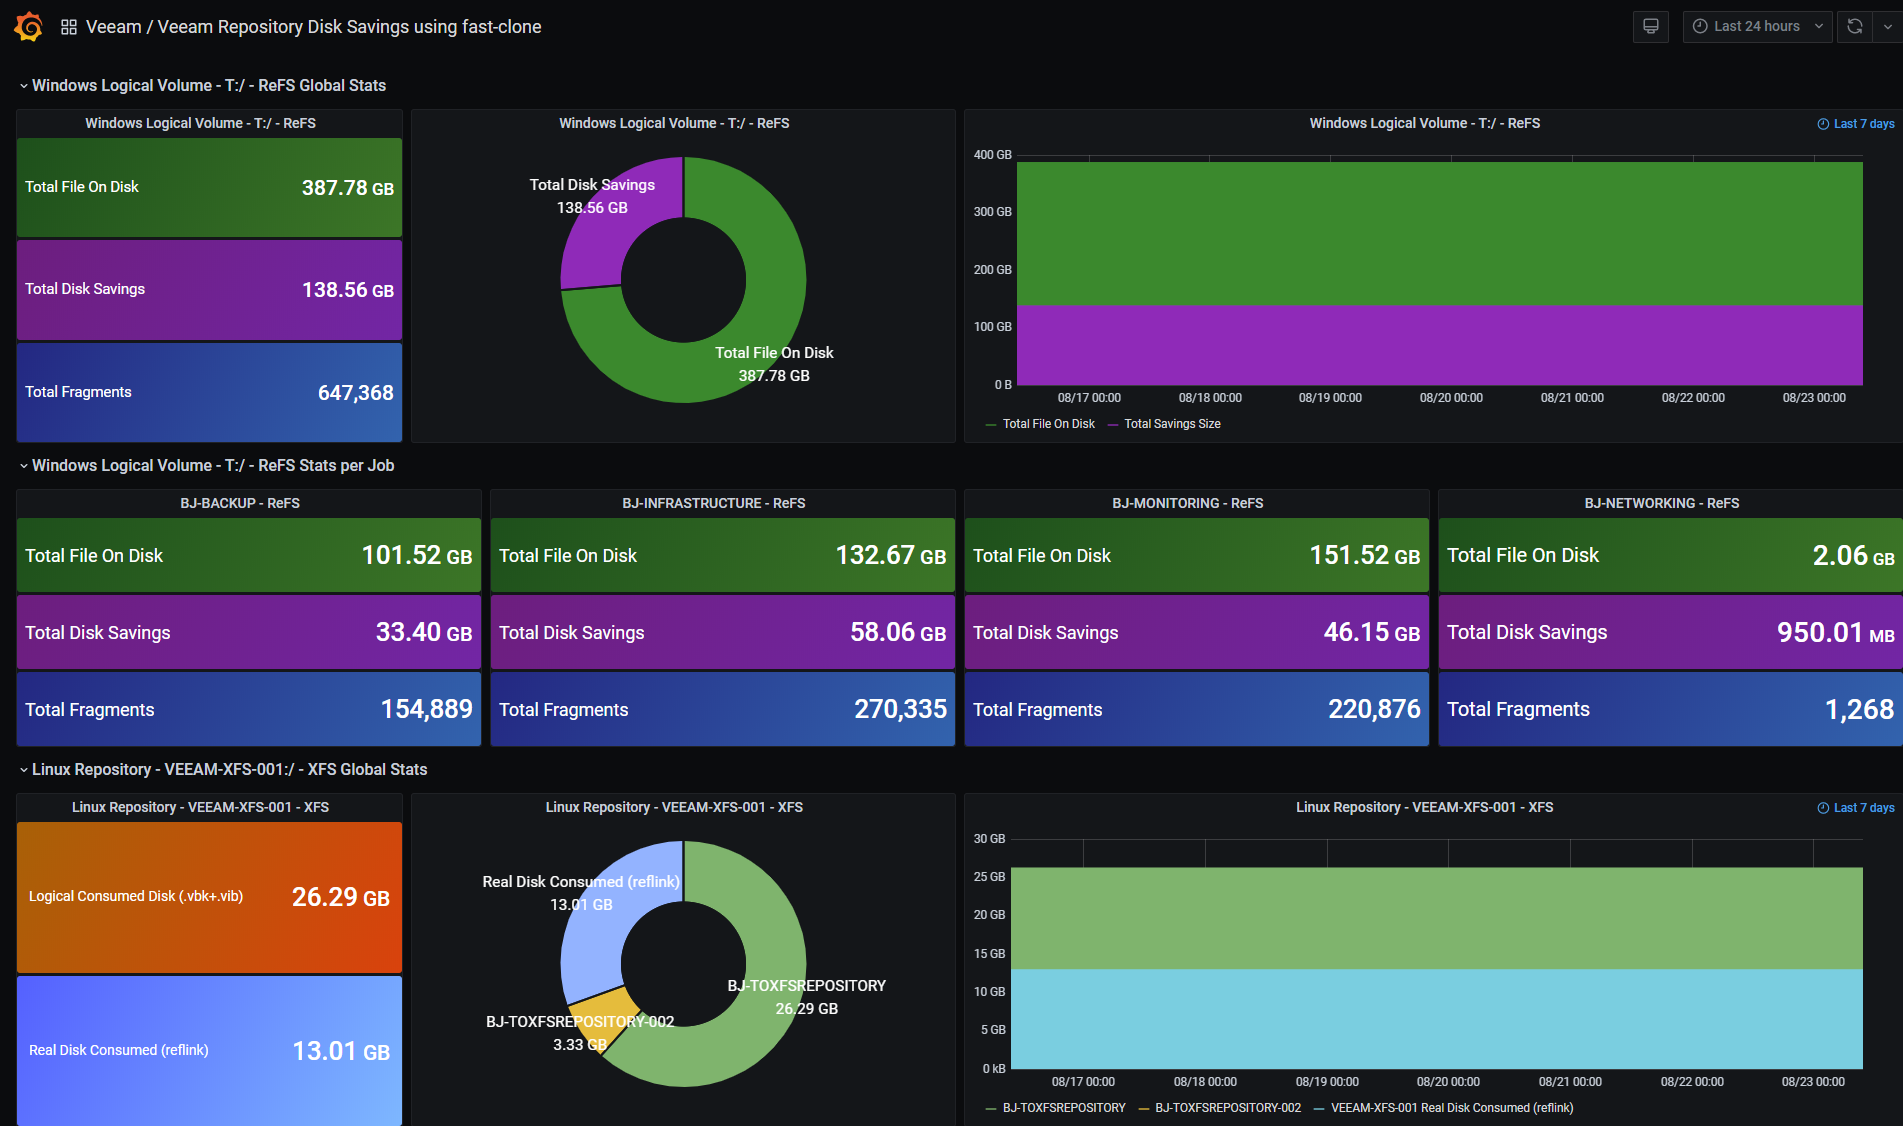
Veeam XFS/ReFS fast-clone Disk savings

By now, you must have heard about the good things ReFS can brings to your backups, and backup repository disk space, so this Dashboard would try to give some light to this disk savings - https://github.com/VeeamHub/grafana/tree/master/veeam-fastclone-stats
That’s it for today. Happy to gather some more feedback, add ideas into this, etc. Please keep the line open.

Whoa! Slick!


Thanks for the work, i already discover before on your blog. I Did the work to push metrics to graphite because we don’t have influx :)


some of that looks familiar ...you’re a machine mate :)


I’ve been looking for a reason to use Grafana. Thank you for giving me that reason.


Love the ReFS/XFS savings dashboard. Very cool stuff, Jorge. Thank you for sharing the scripts too, will take a closer look.


Thanks a lot for the great feedback guys, looking forward to understand and improve the dashboards with your ideas, they are all free, and for everyone.


Wow, great dashboards. I think, I will begin to use Grafana, too :sunglasses:
Especial the ReFS/XFS savings dashboard ist interesting, the information about the savngs are difficult to display with other methods - at least for me, perhaps I have missed the right method up to now...

Thank you for sharing :thumbsup_tone2:


Excellent Post, very clear, very useful 👏


@jorge.delacruz Hey! Have you already push your metrics to elasticsearch with telegraf 🙂?

I will try this soon, we’r implemeting a large elasticsearch for observability. I’m curious what i can do with anomaly detection / behavior analysis with metrics you gather and cross data with metricbeat module vmware :)


Hello @BertrandFR 

I have not played with sending thigs to Elastic, but I was planning on doing that, and extending a lot by parsing all Veeam logs across all products, as opposite of using the API, let’s see how it goes :)


Thanks for the good feedback, I think the AD/B on Elastic it is quite something amazing!


Hello @jorge.delacruz , i’m waiting attentively your work on Veeam logs 🙂. What’s you logs scrapper? Winlogbeat ? Nxlog?


Hello @jorge.delacruz , i’m waiting attentively your work on Veeam logs 🙂. What’s you logs scrapper? Winlogbeat ? Nxlog?

For the work on Elastic, I would prefer Winlogbeat, I will try to use the Grok on Graylog as well, so we can visualize them in Grafana as well.

These are my plans for 2021, so still early stages, and I hope I can find enough time to finish those great projects, I know that they will help us all moving forward.

For now, working on getting v11, and some pieces into Grafana using the normal API to InfluxDB :) 


Hi, I read how you managed to take veeam logs and have a beautiful console that extrapolates the logs perfectly.
Is it possible to do this with veeam backup and replication community edition ? Do we need veam enterprise manager?
Thank you
My name is Gabriele


Hello,

You can do anything with open source tools like Grafana, however Veeam Community Edition does not have RESTful API support, not the Veeam Backup & Replication Server, neither the Enterprise Manager.

So, my recommendation if you want to use open source to monitor your VBR Community will be, either parse the Windows Events, which is quite easy, or as you said read Windows Logs.

But in any of those cases, you willl need to build all the process, and dashboards yourself. Possible? Yes


Please share your work :)


First of all thanks for the answer, let's say that using Nable and NinjaRMM you get results by filtering the event log, but in the dashboard you don't clearly see which virtual machines are in error, you have to go and open the log.
I'll do a test but if you tell me that it can't be done with the comunity edition I'll try to understand the costs of Veeam enterprise or Veeam Backup replication server
Yesterday looking I found your guide https://www.jorgedelacruz.es/2017/02/28/en-busca-del-dashboard-perfecto-influxdb-telegraf-y-grafana-parte-vi-monitorizando-veeam/
But I didn't understand if I can use it with my veeam comunity...


Hello,

That is another possibility, yes. Put in a PowerShell all the things you need, and from there sending them to InfluxDB and build a dashboard, that is quite old and I have not worked on it for years, 2017 is the last update.

I could revisit it if there is some more apettite, but as almost everyone uses licensed Veeams, they usually have either Enterprise Manager, or standalone VBR with RESTAPI.

You can give that a try, some stuff regarding powershell has changed that is for sure.


Surely we need to work on it, now I have to decide whether to test it, I have to immediately propose a Veeam Enterprise or VBR SERVER license and then I will follow your guide to reach a dashboard like this one in your guide https://github.com/ VeeamHub/grafana/tree/master/veeam-enterprise_manager-grafana
But is this the latest release or is there some other guide?


Yes, that guide and work is still perfect. It does uses InfluxDB v2.0. If you are running 1.8, you need to download the files that are inside the 1.8 folder.


Cheers


Come on, I'll keep you updated and let's see if I can sell the license to the customer so there's already something ready, but if you need it, even if you pay you, you could help us create an interface to monitor backups, maybe even not only veeam, but also of others ask me like veritas or synology hyperbackup backup . Thank you


I do all of this open source monitoring as a passion, never took any payment, or gift in exchange.

My time ir pretty limited, but if you want to expand the visibility of your platform with open source tools like Grafana, and monitor other stuff (including other backup products buhhh) you can always take a look at what others are doing, it is pretty comprehensive - https://grafana.com/grafana/dashboards/


Thanks a lot!


The truth is that I too have little time ... then in this period of hacker attacks I'm looking at all the security policies, updating firewalls, enabling passwords and double factor authentication I'm going crazy

Anyway I look at it and I hope to find the solution

My aim is to monitor customer backups in the best possible way and that even a non-expert person is able to understand if there is any problem and in a short time notify those responsible

You might reach out to a Veeam Accredited Service Partner (VASP) as they can help you with configuring and maintaining your backup solution. Different Dev specifically has a managed service where they will give you monitoring and some automatically generated/emailed reports as well as support if errors pop up.


Sorry Jorge can I ask you which version of veeam backup would I need to buy to have the API ready?


Sorry Jorge can I ask you which version of veeam backup would I need to buy to have the API ready?

For the Restful API you need the Veeam Universal License Foundation at least or Veeam Backup & Replication Enterprise Plus


Hello @Sgabar 

Sorry, I missed your message 2 weeks ago! @cymon is right for the Veeam Backup & Replication Dashboard made using Enterprise Manager. For Veeam Backup for Azure/AWS/GCP/Microsoft 365 the Community edition has full API funcionality enabled, so the dashboards would work with those even running Community Edition.


Thanks!


Comment