ReFS (Resilient File System) is a file system by Microsoft that provides - since Windows Server 2016 - a feature named Block cloning. Basically it uses pointers to already existing blocks instead of copying or re-creating them. This saves time and disk space. Veeam uses this feature for synthetic operations like merging incremental backups with full or synthetic full.
In my opinion Microsoft does not offer a proper utility to analyse ReFS space savings with Block cloning. I think there are at least three ways to show the space benefit of Block cloning:
- Windows explorer
- Application that makes use of Block cloning
- Timothy Dewin's blockstat.exe
Windows explorer
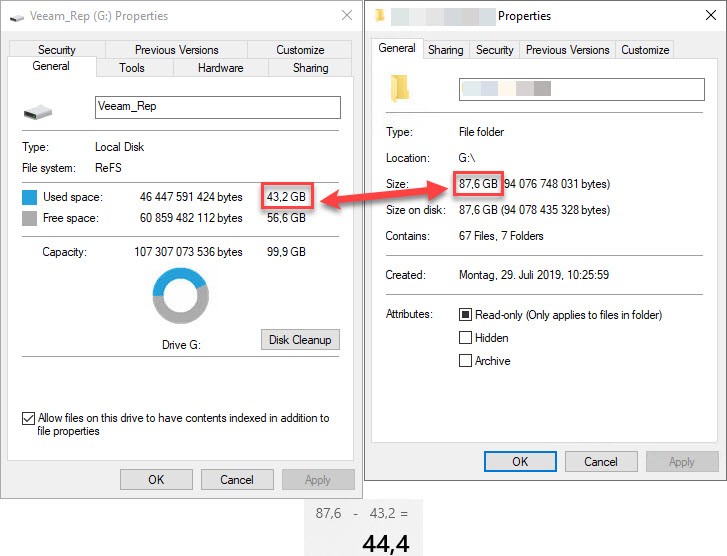
The native way to calculate saved space is to simply compare the sum of all files in a partition to the used space of the same partition. Because the partition view includes the space savings and file view does not, the difference shows saved space.

As you can see, there are about 44,4 GB space savings. Keep in mind, the properties of the partition includes the file system's overhead.
Application
Veeam shows capacity, free and used space in their repository view. The following screenshot shows a Veeam repository on the same partition as before (G:):

The outcome is near the same as before. Difference here is that Veeam just take files into account created by Veeam. This could be interesting when analyzing a volume including files from other applications.
blockstat.exe
First two options have one in common: they compare to the partition properties. This third option provides an insight on file level. The utility can be downloaded here. Timothy also provides some great PowerShell code snippets.
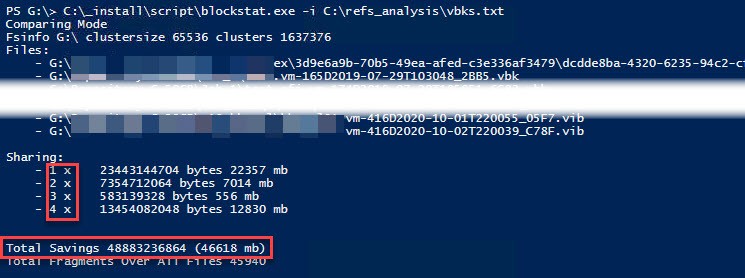
Here I will demonstrate the basic feature of this tool. Basically it analyses used blocks of a list of files. Blocks that are getting pointed to are summed up depending on the number of pointers. See the screenshot for clarification:

The multipliers beneath Sharing show how often these bytes are referred to. The counter includes the data itself as self-reference. Therefore this counter must be reduced by one for analyzing space reduction. See this excel-calculation according to the screenshot.

Actually shared values show space savings
blockstat.exe usage
For creating such a file level report, blockstat.exe needs just a list of files to analyse. This can be accomplished by a simple PowerShell command that lists necessary files and write them to a text file.
Get-ChildItem -Path g: -Recurse -Include @("*.vbk"; "*.vbr"; "*.vib") | ForEach-Object { $_.FullName } | Set-Content -encoding unicode "c:\refs_analysis\vbks.txt"Because of Veeam, fulls and incremental files are listed. This command created the list of files, used in the screenshot above. To run blockstat.exe run this command:
C:\_install\script\blockstat.exe -i C:\refs_analysis\vbks.txtIt should be clear to replace these paths by your own.
Notes
- The difference of saved space of the first two options compared to blockstat.exe in these examples can be explained by the file system meta data. blockstat.exe sums blocks that are use multiple times and do not take the used partition size into account.
- When backing up VMware vSphere environments, using Changed Block Tracking, it is also very interesting how many block in what size are selected for backup. To analyse this, see my post What is the size of a changed block tracking block.


