Veeam ONE is an important part of Veeam Availability Suite. If you are new to Veeam, or currently running Veeam Availability Suite, you may not know that you have a powerful monitoring solution not only for your data protection environment but also your virtual environment. Veeam ONE provides visibility into your environment by monitoring and analyzing data trends that identify resource usage, helping plan for capacity, ensuring applications are performing efficiently and confirming backup operations are completing successfully. Veeam ONE does all of this, and if you are first getting started with Veeam ONE, this blog post is for you.
- Monitoring your environment
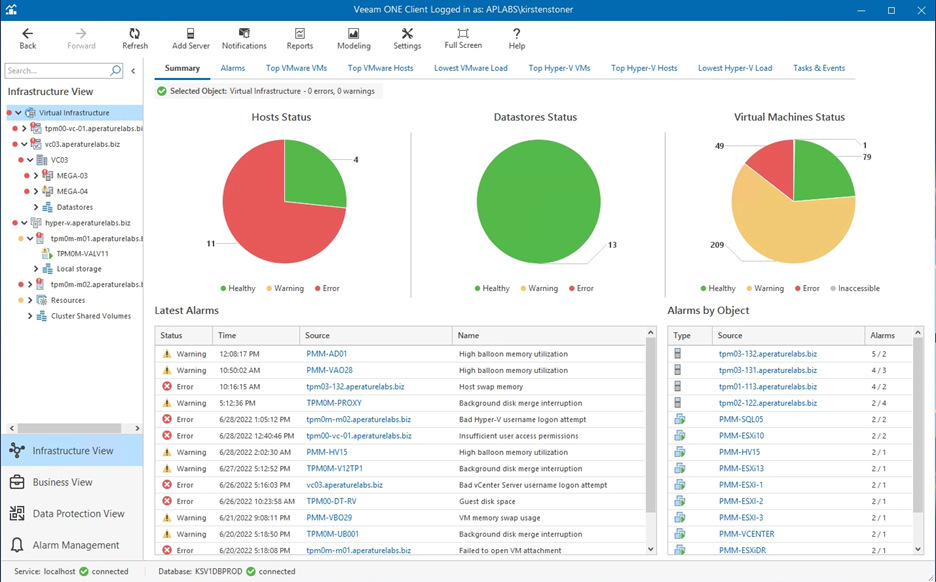
Once you have added your environment into Veeam ONE, it immediately starts collecting data on how resources are being consumed, finds any problem areas and identifies bottlenecks. By switching through the different Veeam ONE Client views, you can monitor different environments, get more granular based on infrastructure components (backup and virtual) and run reports. The Veeam ONE Client is the main interface for monitoring and troubleshooting any alarms that are triggered in your environment.
- Assessment reporting
Just one of the great features of Veeam ONE is the reporting. These reports allow you to document, analyze, track changes and can help with decision making for planning for future capacity. There are some reports that can be very useful when first starting with Veeam ONE. These are the assessment reports.
Once you have Veeam Backup & Replication setup and Veeam ONE installed, you can run a report that compares your backup infrastructure to a set of best practices that addresses configuration to ensure that your backup environment is running efficiently. The Backup Infrastructure Assessment report helps identify VMs that cannot be properly backed up due to configuration limitations, verifies problem areas and helps mitigate issues.
One component of the backup infrastructure is the backup repository. Veeam ONE can report on VM Change Rate Estimation and Data Change rate to help with backup repository planning.

After you have properly assessed your environment and ensured that you have the correct setup for proper backup operations you can utilize some of the other helpful reports included in Veeam ONE.
To view information about backup and replication jobs you can view the Job History Report. This report contains information on each job including completion status, number of processed objects, backup type, session start time, duration, processing rate, the amount of transferred data and total backup size.
The modern data center today can be complex, ever-changing and dispersed. To help ensure that you are backing up your machines, Protection Reports are available. These reports let you know which machines are not meeting their Recovery Point Objectives so you can make sure they are included in data protection operations. These reports are available for physical, virtual and cloud workloads.
These are just some of the helpful reports included, there are so many more that can contribute to optimizing your environment.
- What notifications do you want to receive?
With all the different alarms included in Veeam ONE it is important to set up notifications for critical issues so you receive notifications in real-time to troubleshoot when needed. Working with the different alarms is made easy by the many ways to adjust alarms based on operations, disable un-needed alarms, suppress them and set up actions to occur when they are triggered.
Alarms, by default, have parameters set based on best practice recommendations, however by clicking on ‘edit alarm’ you can tailor them based on your environment. As an additional tip, if you have a very noisy machine and you don’t want to edit the default settings just for that machine, you can clone the alarm, change the parameters and ‘assign’ it to that particular machine. You can assign alarms to a specific machine or Business View group.
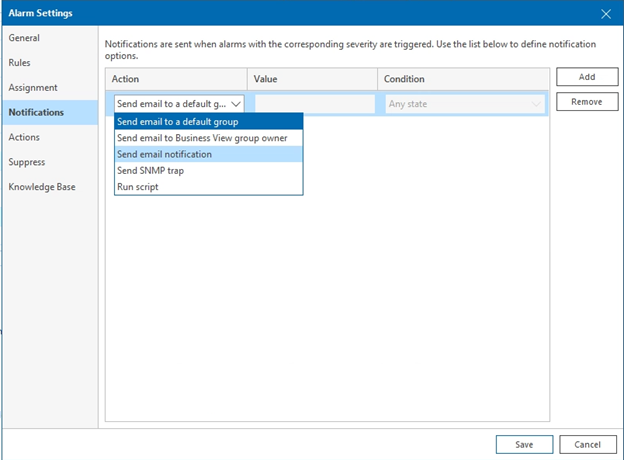
Lastly, you want to make sure you setup notifications for those most critical alarms. You can be notified through email or run a PowerShell script to notify you through a different option.
Rick Vanover wrote a good blog post talking more about this here: https://community.veeam.com/blogs-and-podcasts-57/configure-notify-action-veeam-one-s-ransomware-detection-2825
- Business View Groups
I briefly mentioned Business View groups in step three on this blog post. If you don’t know what Business View is, it allows you to categorize and group your environment based on a business perspective. Categorizing your environment is just a few steps of the wizard within Veeam ONE. If you are already using vSphere Tags or System Center Virtual Machine Manager custom properties to categorize your environment, you can import these tags right into Business View easily.
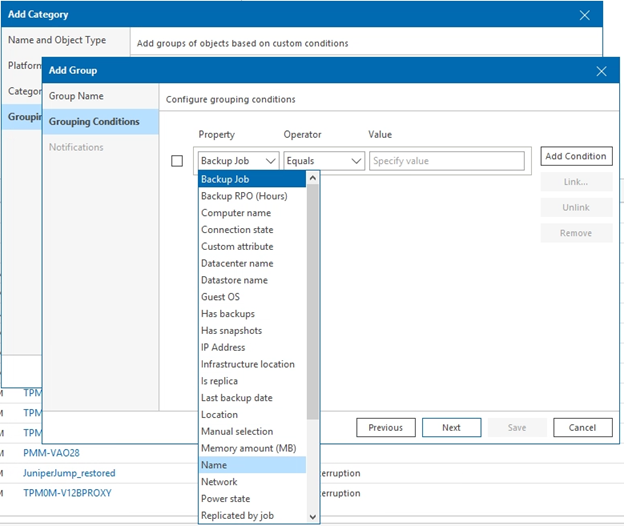
One of the best benefits of using Business View is being to build reports around business view groups. Not only that, but you can assign alarms to Business View groups and even set group owners to get notified about what is happening to the machines they are in charge off.
- Don’t forget Remediation Actions
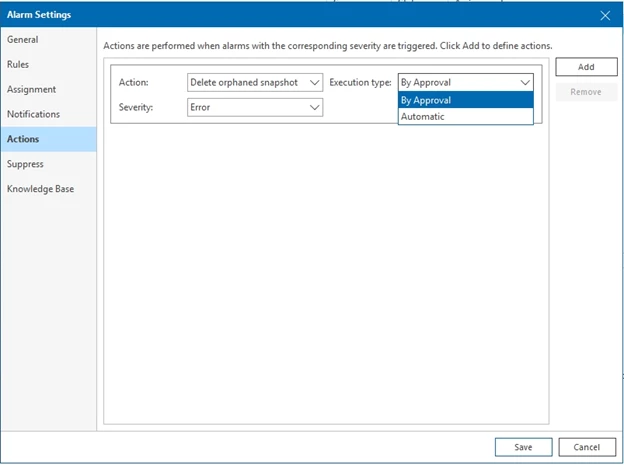
Every alarm in Veeam ONE had the option to setup a remediation action. This allows you to resolve issues automatically or manually in real time. There are two different types of actions you can set, a predefined action or the option to run a custom script. Only some of the alarms contain predefined actions, but all the alarms have the option to run a script. Setting up remediation actions based on the severity of alarm rules can streamline troubleshooting to make sure data is protected and machines are running as normal.
These five steps to getting started with Veeam ONE is just the beginning. The product has so many more tools in its toolset that provides monitoring, reporting and automation to identify and resolve customer problems before they begin. What is your favorite report to run when getting started with Veeam ONE? Be sure to leave a comment below. 👇🏻


