We should be plotting something!
As part of the presentation at VeeamON 2025 with
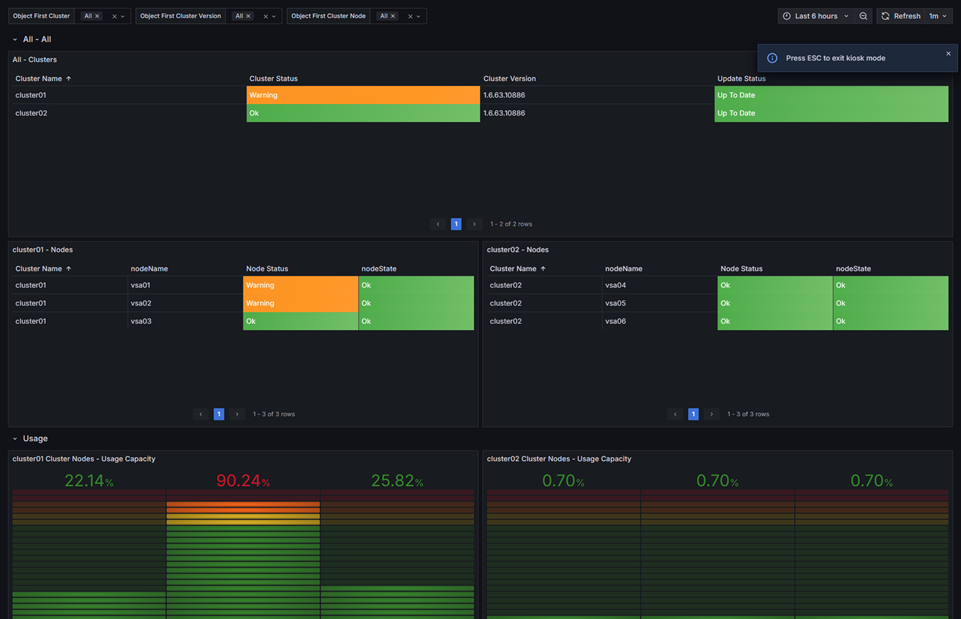
The dashboard supports one or multiple clusters containing one or multiple nodes.
For both the cluster and the nodes, the following details are available:
- Cluster and Node status
- Including Update and join/leave status
- Capacity status
- CPU & Disk I/O
- Network graphs (S3 and Internode)
- Internode graph will be empty if there is only one node in the cluster
- S3 Service
- Storage Usage
The following things are required:
- Grafana
- InfluxDB 2
- Git
- Linux OS
You need to install some software if you are not already running a Grafana dashboard for Veeam. To get things started, follow Jorge's blog post. You could skip the Telegraf parts.
After successfully installing Grafana and InfluxDB 2, you can continue installing the dashboard according to the procedure on the GitHub repository.
If you have any issues, please create an issue on GitHub.
Cheers,
Maurice